CD5L
[ENSRNOP00000053854]
Main page
| | | Plot |
Mito |
Lyso |
|
Perox |
ER |
Golgi |
PM |
Cytosol |
Nucleus |
|
| Expt A |
 5
5
peptides |
15
spectra |
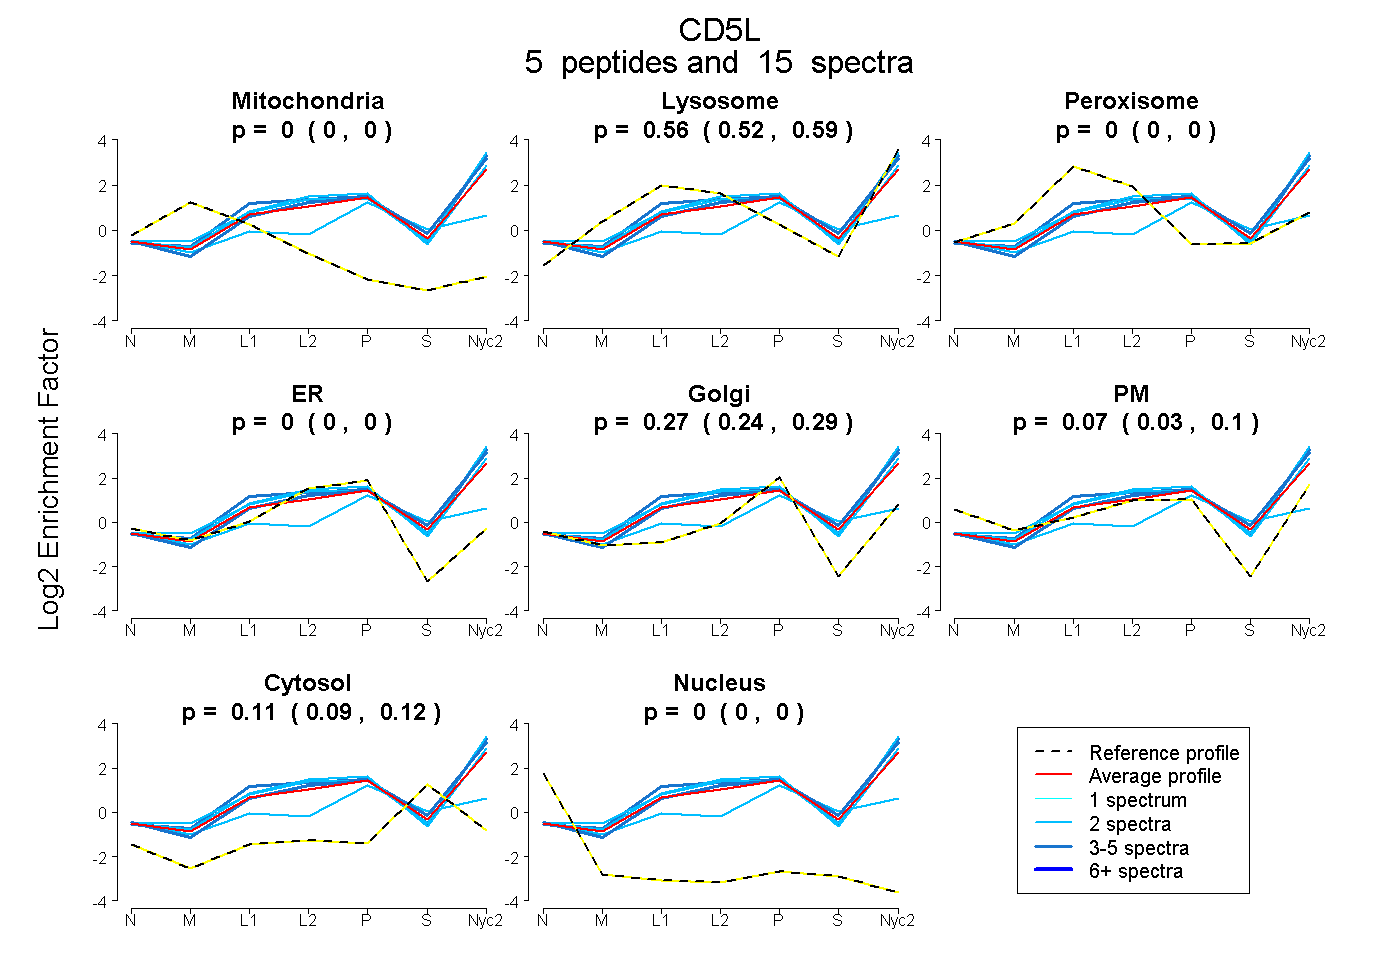 |
0.000
0.000 | 0.000 |
0.556
0.523 | 0.586 |
|
0.000
0.000 | 0.000 |
0.000
0.000 | 0.000 |
0.269
0.237 | 0.295 |
0.070
0.032 | 0.100 |
0.105
0.087 | 0.119 |
0.000
0.000 | 0.000 |
|
| | | Plot |
Mito |
|
Lyso or Perox |
|
ER |
Golgi |
PM |
Cytosol |
Nucleus |
|
| Expt B |
2
peptides |
3
spectra |
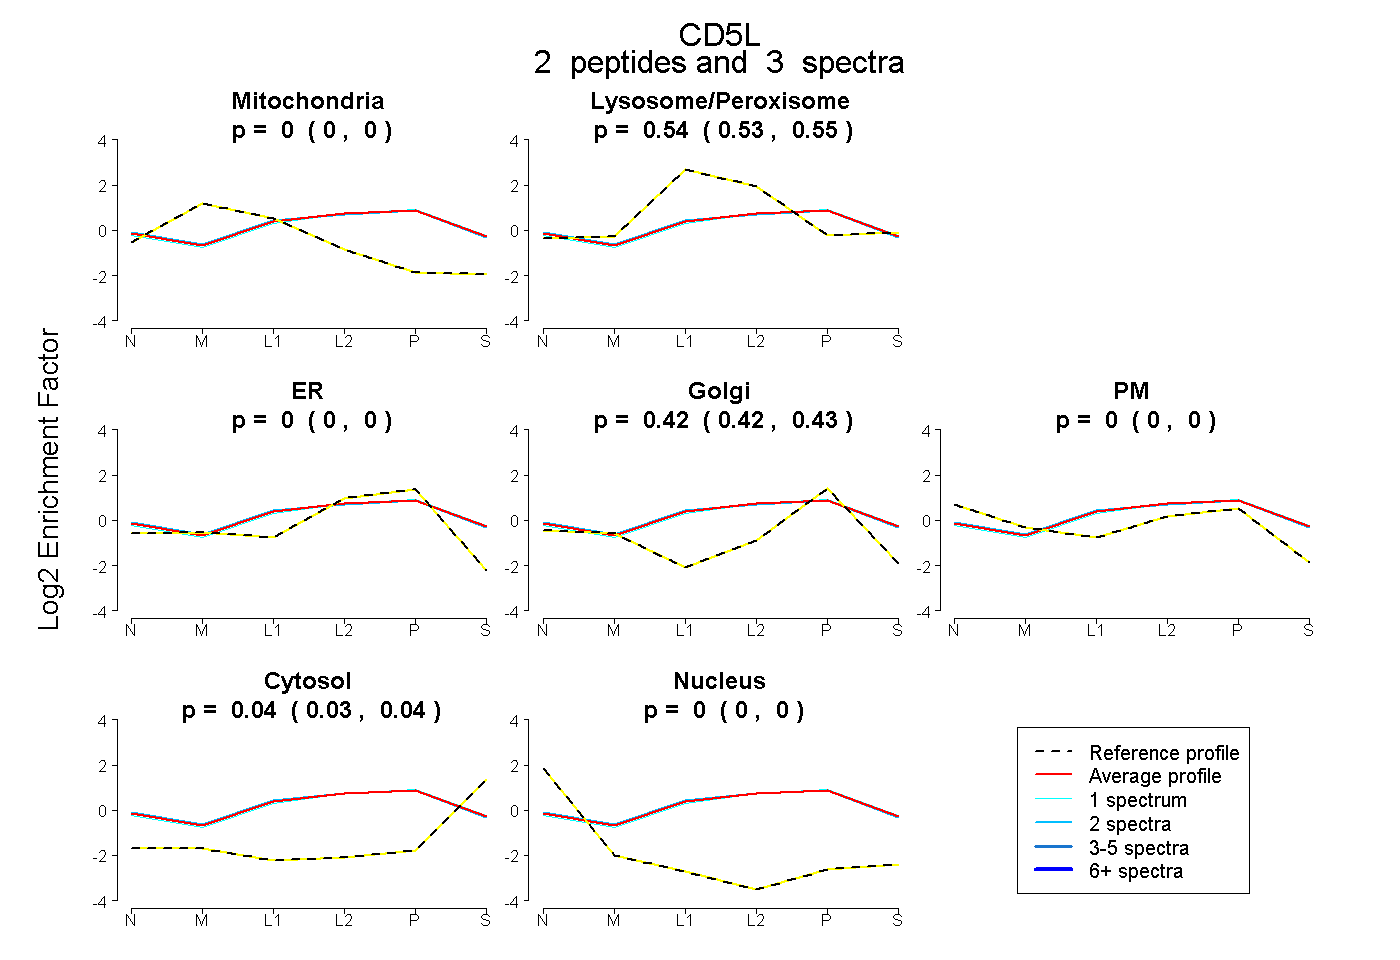 |
0.000
0.000 | 0.000 |
|
0.541
0.535 | 0.547 |
|
0.000
0.000 | 0.000 |
0.423
0.415 | 0.430 |
0.000
0.000 | 0.000 |
0.035
0.028 | 0.041 |
0.000
0.000 | 0.000 |
|
| | | Plot |
|
Lyso |
|
|
|
|
|
|
|
Other |
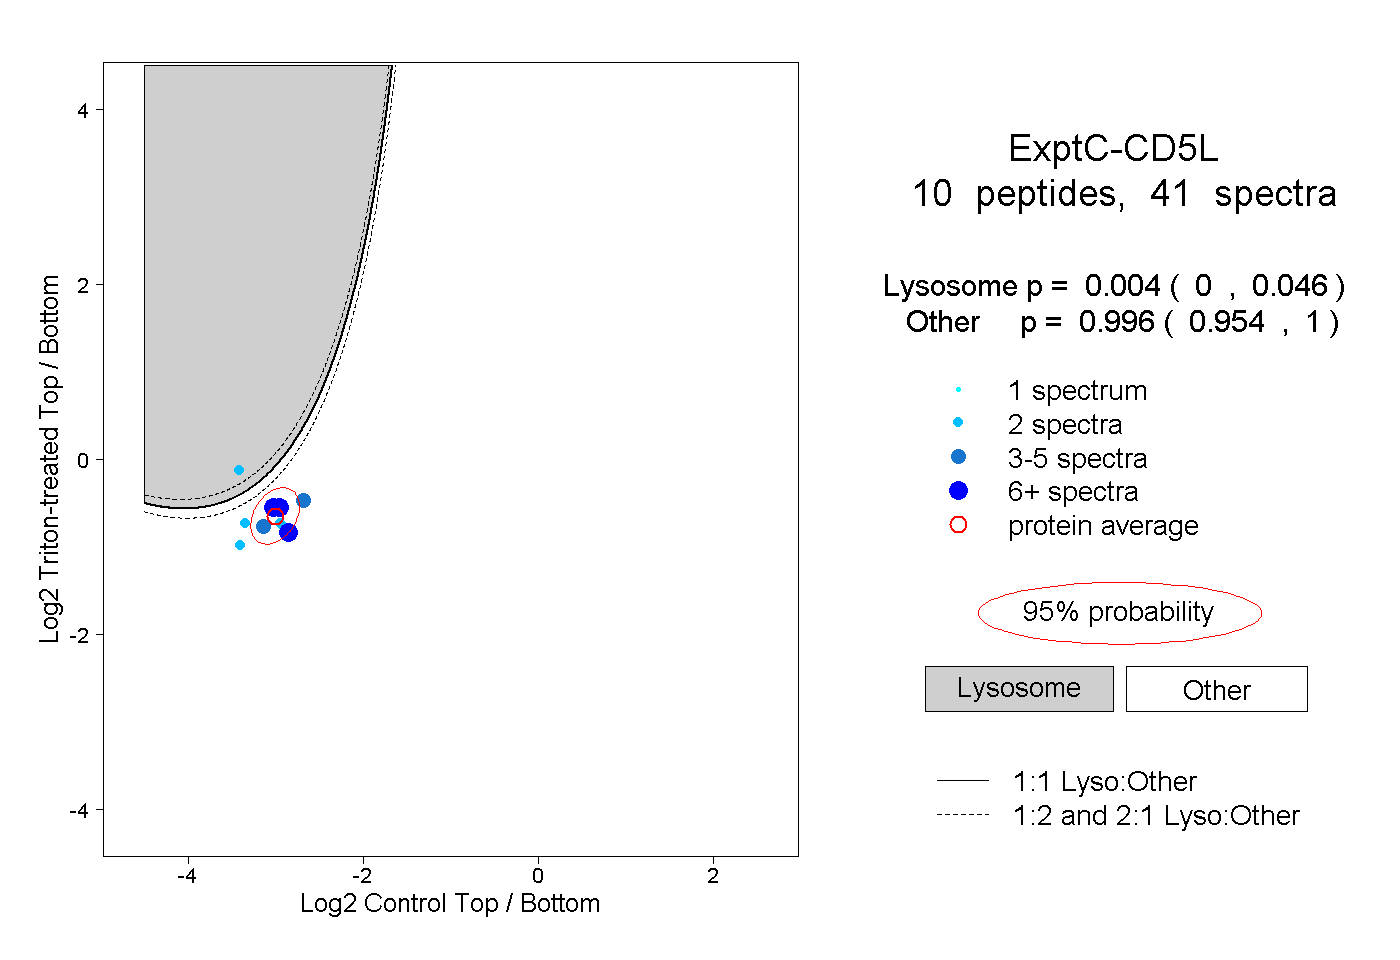
| Expt C |
10
peptides |
41
spectra |
 |
|
0.004
0.000 | 0.046 |
|
|
|
|
|
|
|
0.996
0.954 | 1.000 |
| 2 spectra, GPIWMSK |
|
0.002 |
|
|
|
|
|
|
|
0.998 |
| 7 spectra, QSFGPGTGR |
|
0.000 |
|
|
|
|
|
|
|
1.000 |
| 6 spectra, LEVLHK |
|
0.013 |
|
|
|
|
|
|
|
0.987 |
| 2 spectra, SLFPSPK |
|
0.957 |
|
|
|
|
|
|
|
0.043 |
| 5 spectra, ALLAHR |
|
0.004 |
|
|
|
|
|
|
|
0.996 |
| 4 spectra, EESLELCR |
|
0.001 |
|
|
|
|
|
|
|
0.999 |
| 2 spectra, LVEGLGR |
|
0.001 |
|
|
|
|
|
|
|
0.999 |
| 2 spectra, LVGGAHR |
|
0.019 |
|
|
|
|
|
|
|
0.981 |
| 9 spectra, LVGGDTTCSGR |
|
0.007 |
|
|
|
|
|
|
|
0.993 |
| 2 spectra, ELNCGAAK |
|
0.001 |
|
|
|
|
|
|
|
0.999 |
| | | Plot |
|
Lyso |
|
|
|
|
|
|
|
Other |
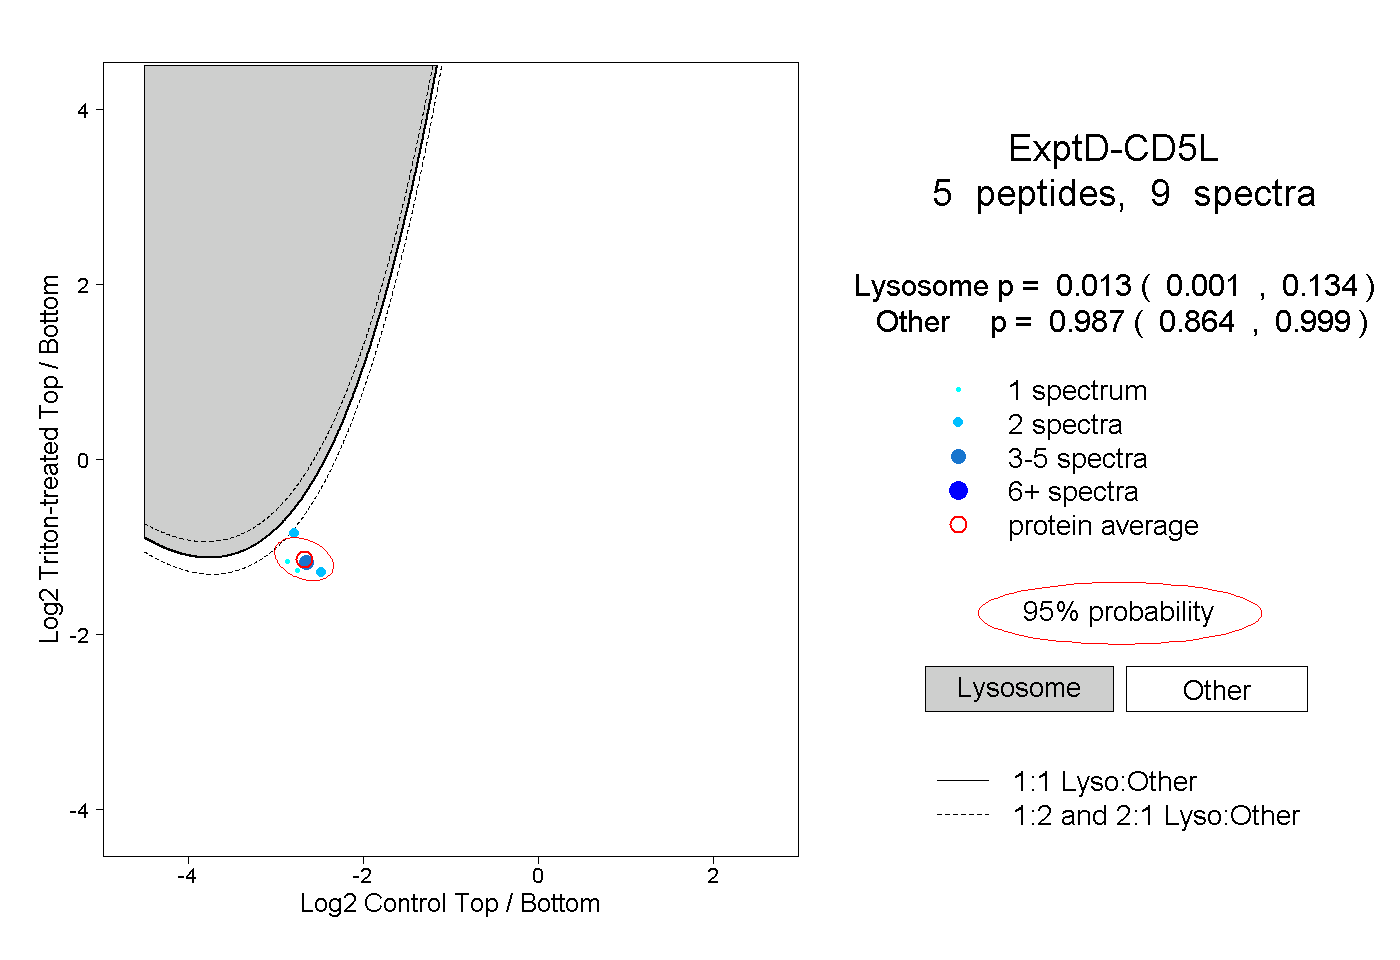
| Expt D |
5
peptides |
9
spectra |
 |
|
0.013
0.001 | 0.134 |
|
|
|
|
|
|
|
0.987
0.864 | 0.999 |