 5
5peptides
spectra
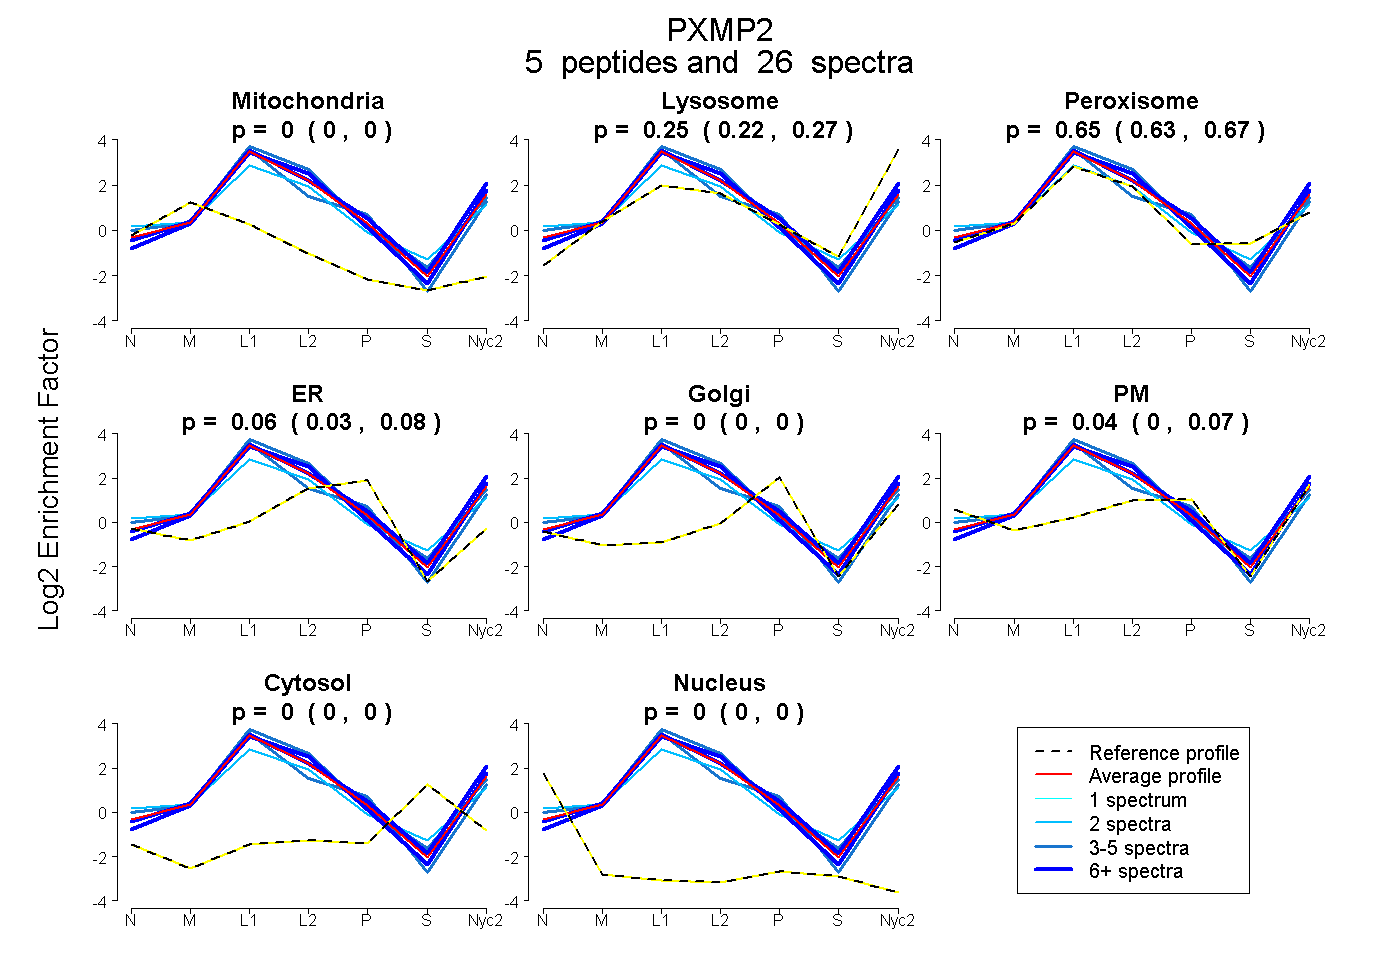
0.000 | 0.000
0.220 | 0.267
0.633 | 0.674
0.032 | 0.084
0.000 | 0.000
0.000 | 0.069
0.000 | 0.000
0.000 | 0.000
5peptides
spectra
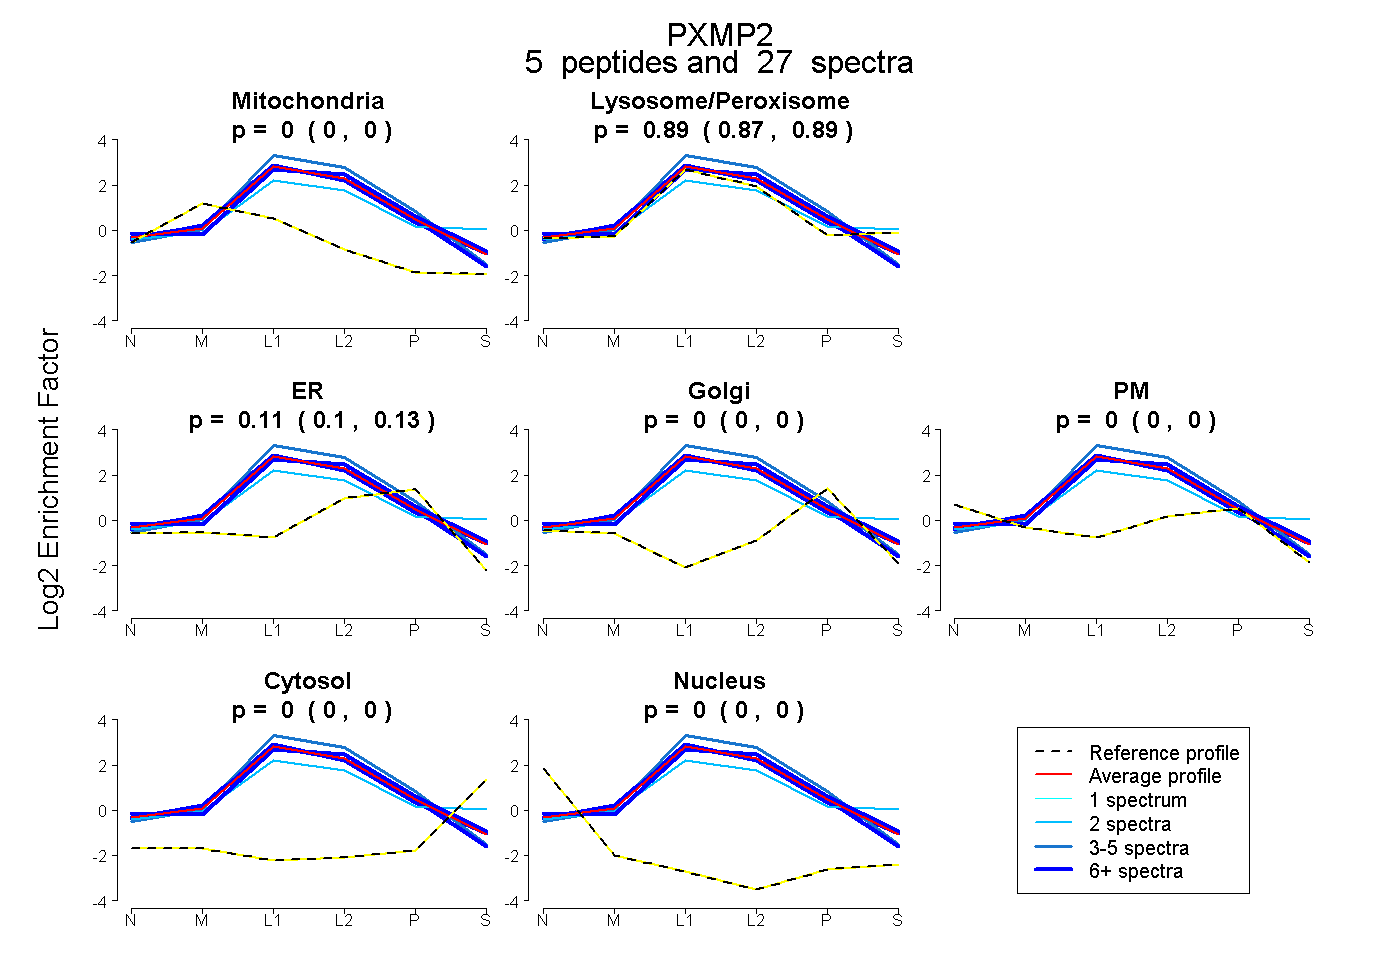
0.000 | 0.000
0.873 | 0.895
0.104 | 0.125
0.000 | 0.000
0.000 | 0.000
0.000 | 0.000
0.000 | 0.000
6peptides
spectra
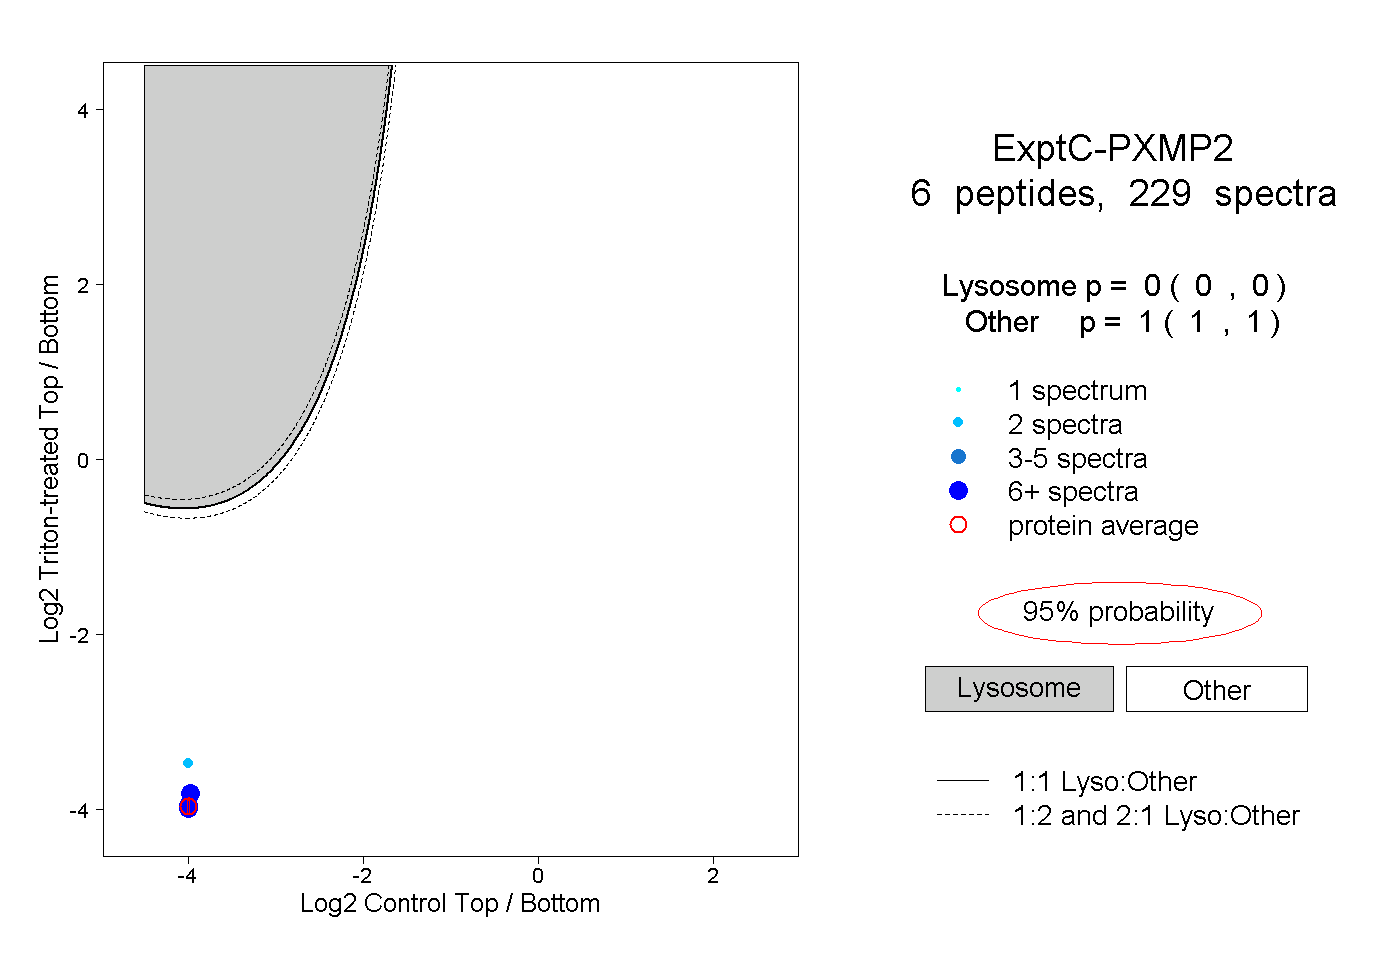
0.000 | 0.000
1.000 | 1.000
2peptides
spectra
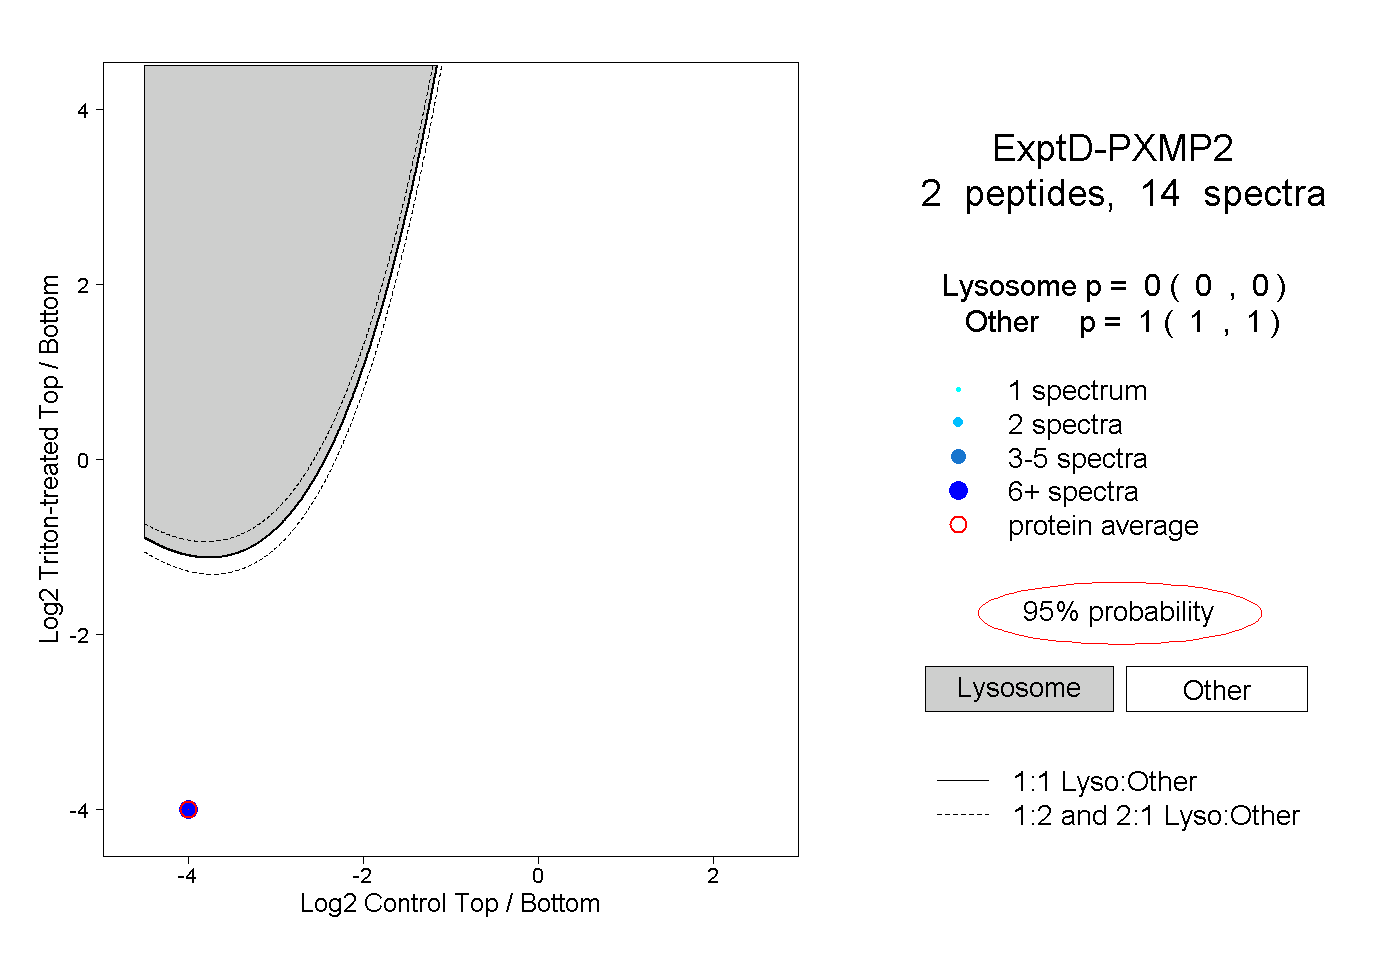
0.000 | 0.000
1.000 | 1.000