 5
5peptides
spectra
0.000 | 0.000
0.220 | 0.267
0.633 | 0.674
0.032 | 0.084
0.000 | 0.000
0.000 | 0.069
0.000 | 0.000
0.000 | 0.000
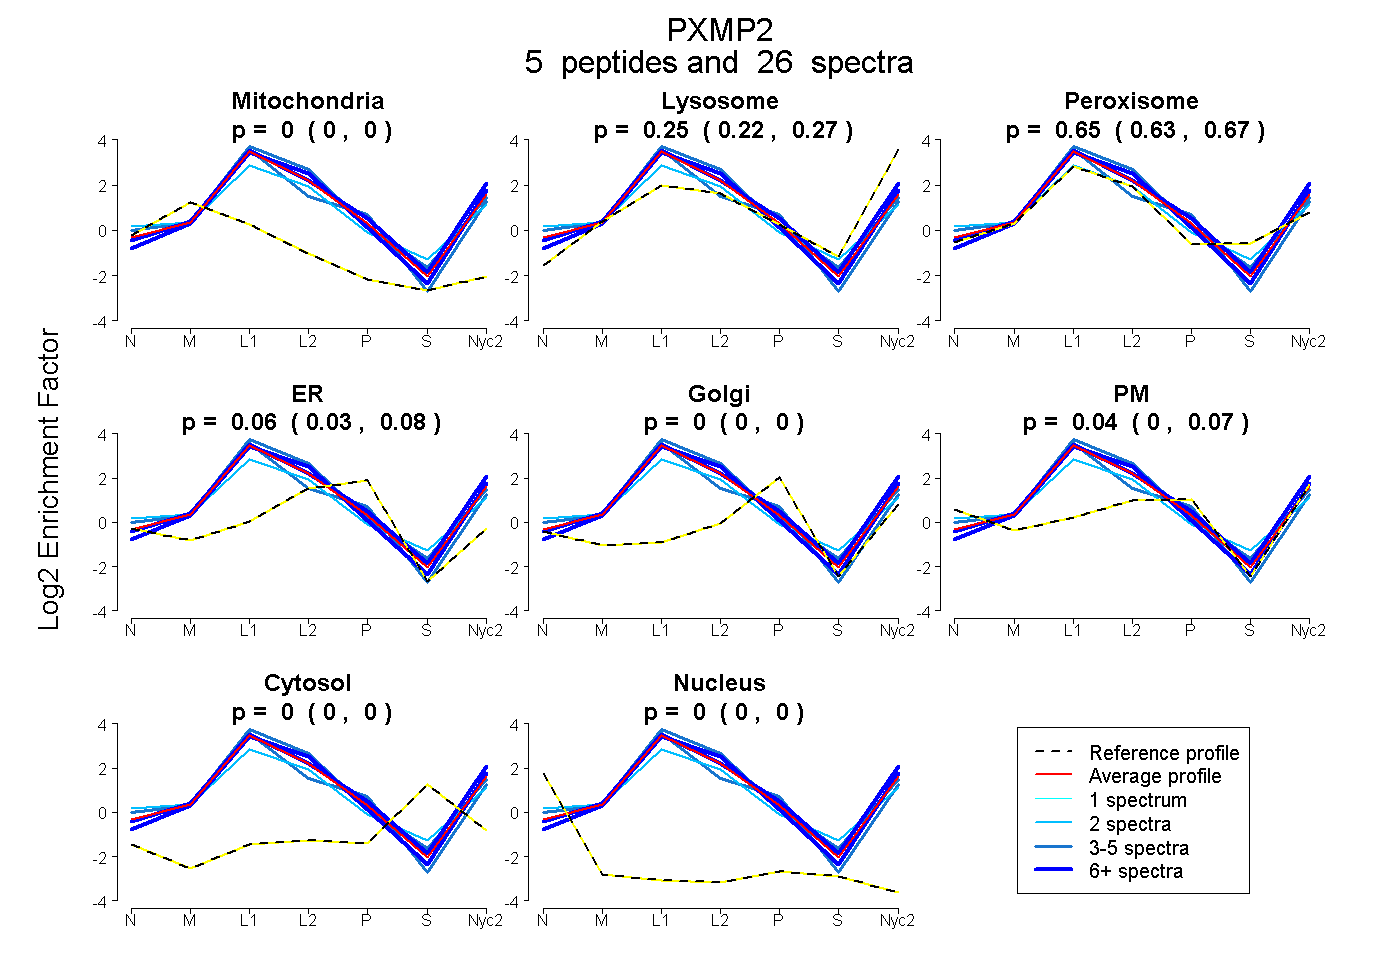
| Plot | Mito | Lyso | Perox | ER | Golgi | PM | Cytosol | Nucleus | |||||
| Expt A |
5 peptides |
26 spectra |
|
0.000 0.000 | 0.000 |
0.248 0.220 | 0.267 |
0.655 0.633 | 0.674 |
0.062 0.032 | 0.084 |
0.000 0.000 | 0.000 |
0.036 0.000 | 0.069 |
0.000 0.000 | 0.000 |
0.000 0.000 | 0.000 |
| 9 spectra, SLEVSGLLR | 0.000 | 0.403 | 0.546 | 0.026 | 0.000 | 0.024 | 0.000 | 0.000 | ||
| 8 spectra, SGFWPALQMNWR | 0.000 | 0.344 | 0.580 | 0.076 | 0.000 | 0.000 | 0.000 | 0.000 | ||
| 4 spectra, APAASR | 0.000 | 0.188 | 0.807 | 0.005 | 0.000 | 0.000 | 0.000 | 0.000 | ||
| 3 spectra, FYPVVTK | 0.000 | 0.079 | 0.610 | 0.058 | 0.000 | 0.253 | 0.000 | 0.000 | ||
| 2 spectra, NISVFVAK | 0.000 | 0.000 | 0.811 | 0.000 | 0.000 | 0.189 | 0.000 | 0.000 |
| Plot | Mito | Lyso or Perox | ER | Golgi | PM | Cytosol | Nucleus | ||||||
| Expt B |
5 peptides |
27 spectra |
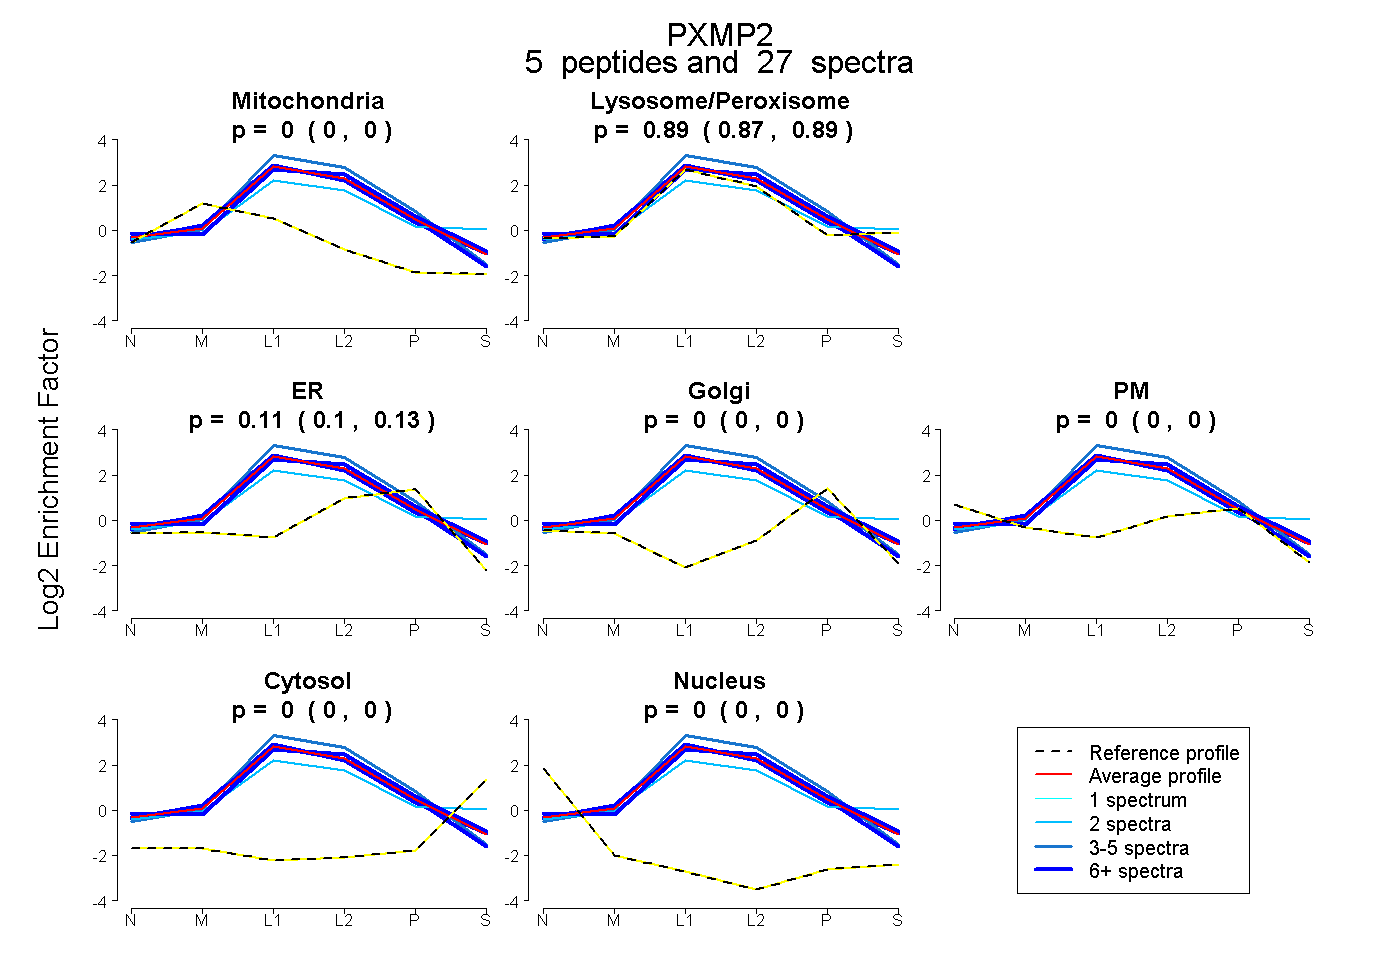 |
0.000 0.000 | 0.000 |
0.885 0.873 | 0.895 |
0.115 0.104 | 0.125 |
0.000 0.000 | 0.000 |
0.000 0.000 | 0.000 |
0.000 0.000 | 0.000 |
0.000 0.000 | 0.000 |
|||
| Plot | Lyso | Other | |||||||||||
| Expt C |
6 peptides |
229 spectra |
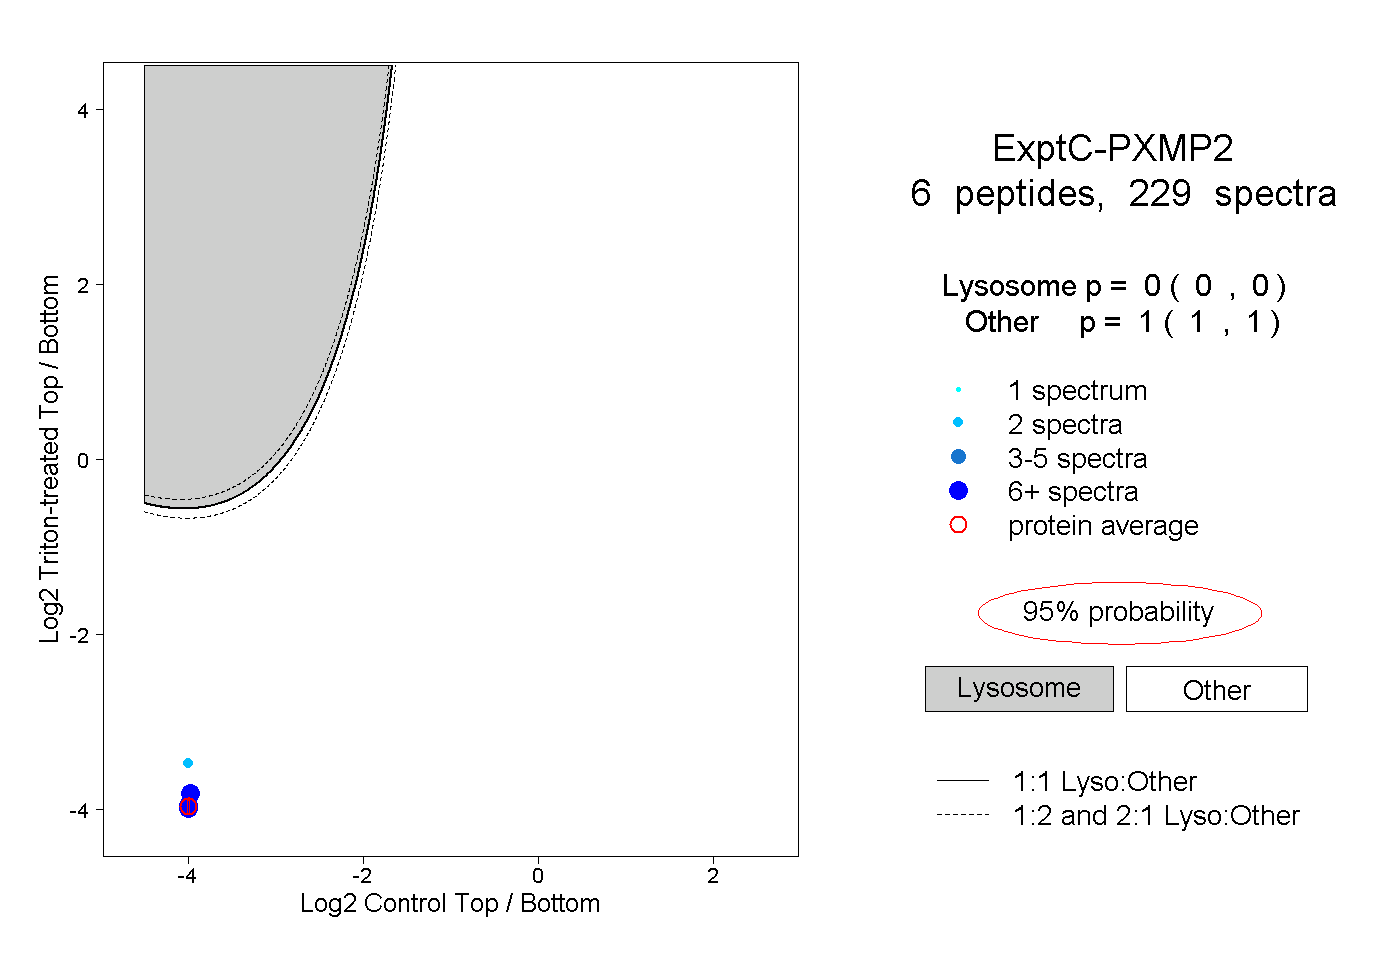 |
0.000 0.000 | 0.000 |
1.000 1.000 | 1.000 |
||||||||
| Plot | Lyso | Other | |||||||||||
| Expt D |
2 peptides |
14 spectra |
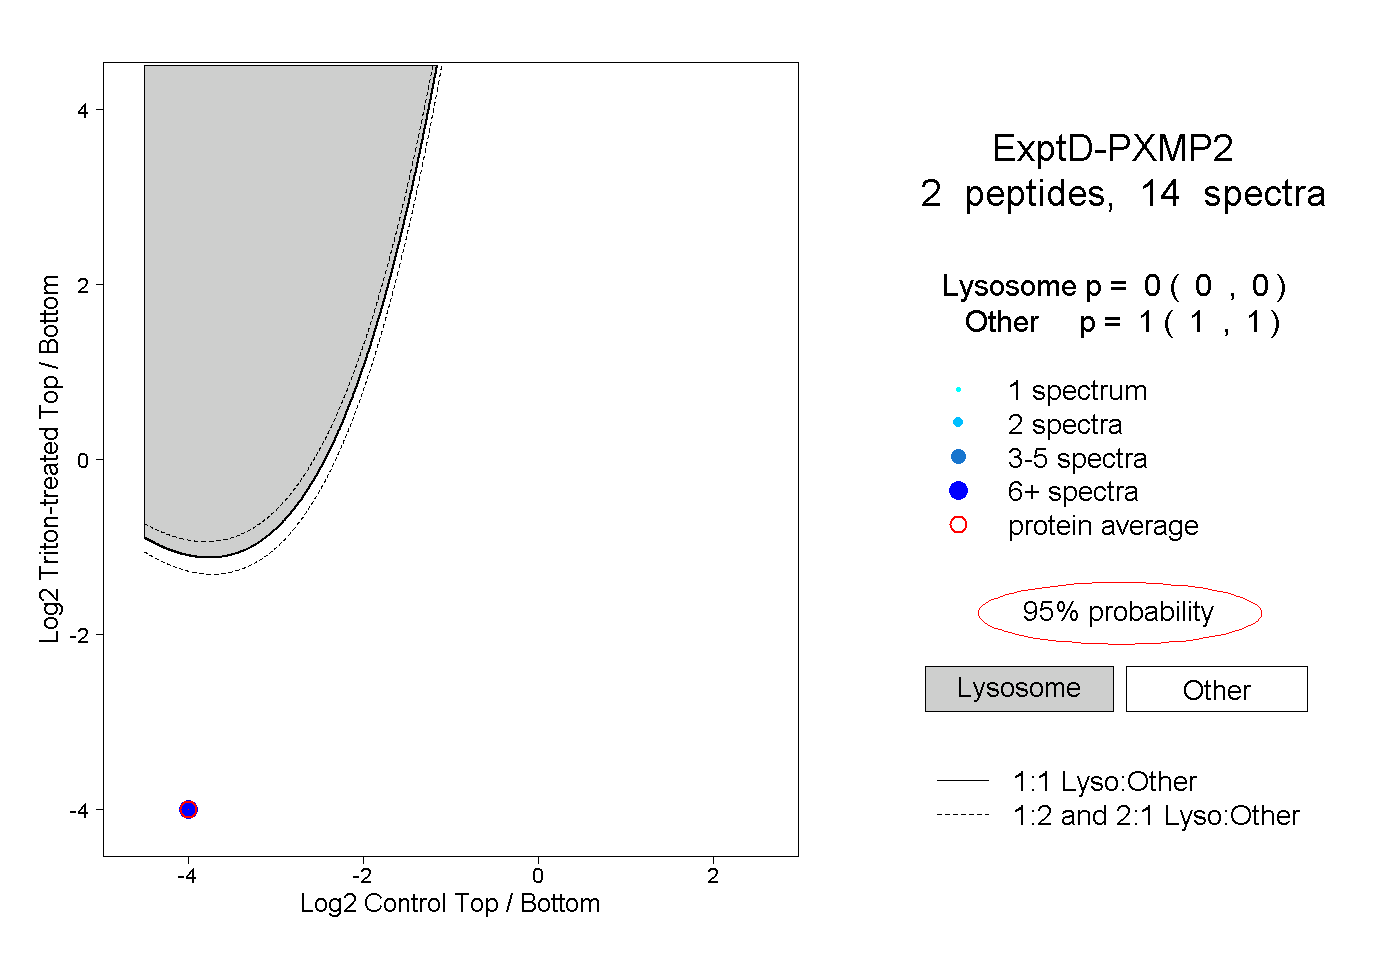 |
0.000 0.000 | 0.000 |
1.000 1.000 | 1.000 |