PXMP2
[ENSRNOP00000053518]
Main page
| | | Plot |
Mito |
Lyso |
|
Perox |
ER |
Golgi |
PM |
Cytosol |
Nucleus |
|
| Expt A |
 5
5
peptides |
26
spectra |
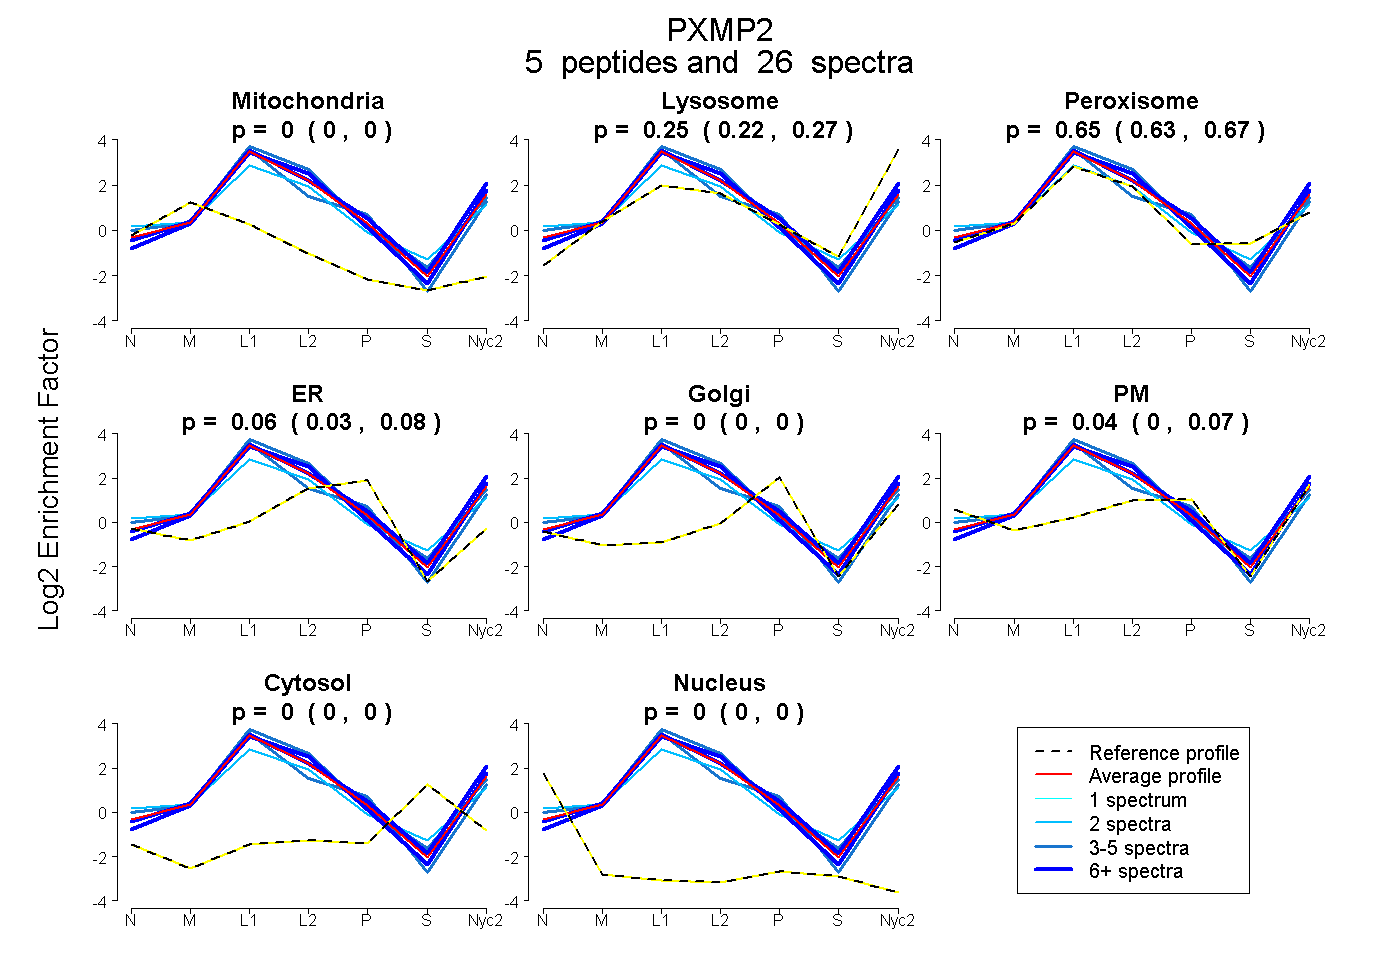 |
0.000
0.000 | 0.000 |
0.248
0.220 | 0.267 |
|
0.655
0.633 | 0.674 |
0.062
0.032 | 0.084 |
0.000
0.000 | 0.000 |
0.036
0.000 | 0.069 |
0.000
0.000 | 0.000 |
0.000
0.000 | 0.000 |
|
| | | Plot |
Mito |
|
Lyso or Perox |
|
ER |
Golgi |
PM |
Cytosol |
Nucleus |
|
| Expt B |
5
peptides |
27
spectra |
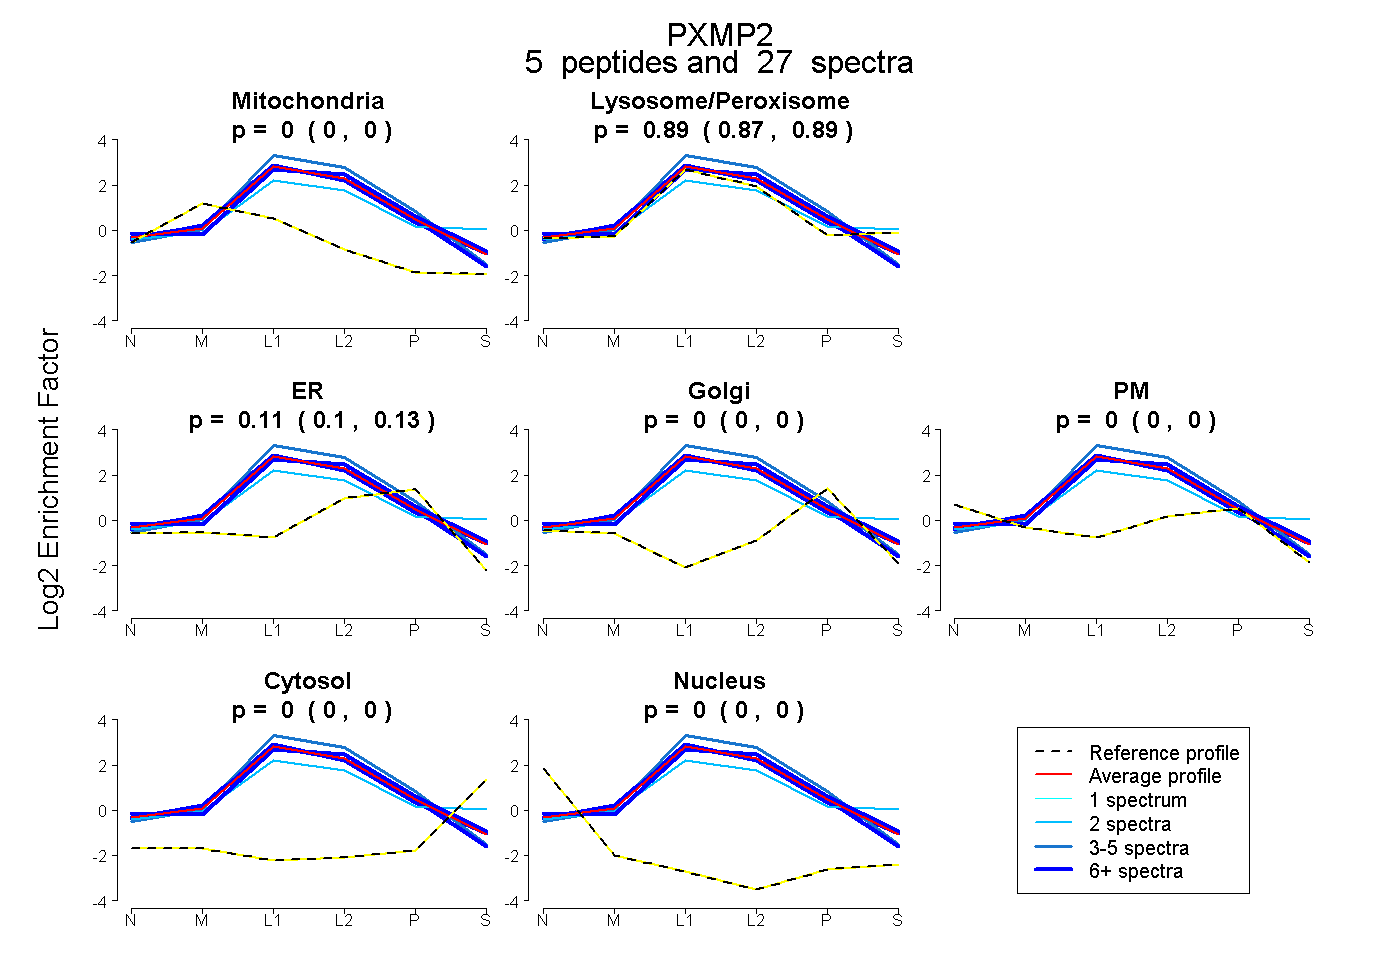 |
0.000
0.000 | 0.000 |
|
0.885
0.873 | 0.895 |
|
0.115
0.104 | 0.125 |
0.000
0.000 | 0.000 |
0.000
0.000 | 0.000 |
0.000
0.000 | 0.000 |
0.000
0.000 | 0.000 |
|
| 10 spectra, ALAQYLLFLK |
0.000 |
|
0.911 |
|
0.089 |
0.000 |
0.000 |
0.000 |
0.000 |
|
| 6 spectra, SLEVSGLLR |
0.000 |
|
0.873 |
|
0.127 |
0.000 |
0.000 |
0.000 |
0.000 |
|
| 2 spectra, SGFWPALQMNWR |
0.000 |
|
0.909 |
|
0.000 |
0.091 |
0.000 |
0.000 |
0.000 |
|
| 3 spectra, APAASR |
0.000 |
|
0.912 |
|
0.088 |
0.000 |
0.000 |
0.000 |
0.000 |
|
| 6 spectra, FYPVVTK |
0.000 |
|
0.830 |
|
0.170 |
0.000 |
0.000 |
0.000 |
0.000 |
|
| | | Plot |
|
Lyso |
|
|
|
|
|
|
|
Other |
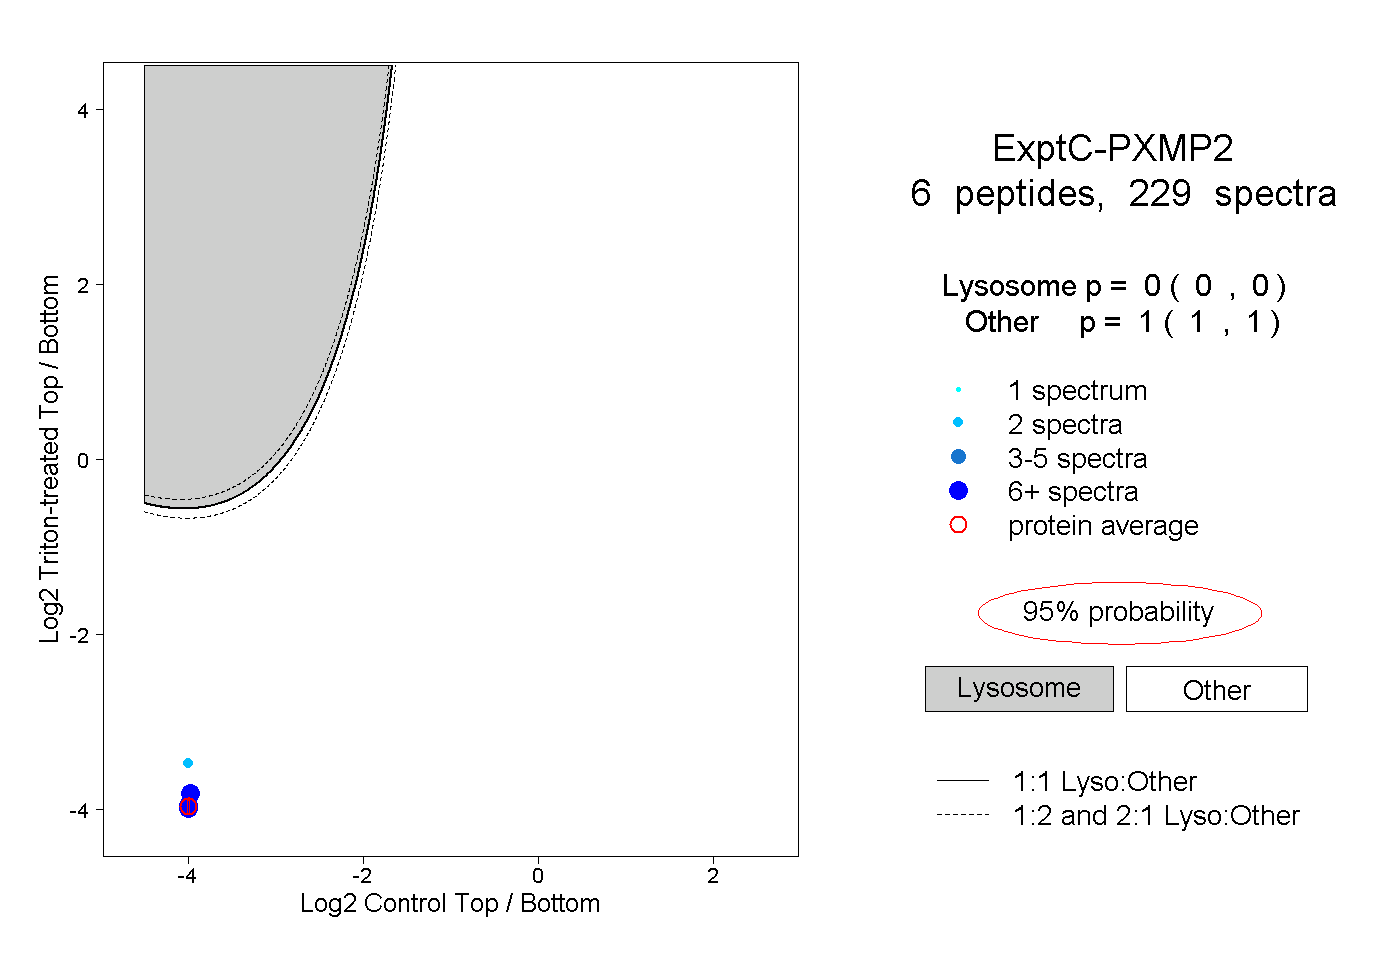
| Expt C |
6
peptides |
229
spectra |
 |
|
0.000
0.000 | 0.000 |
|
|
|
|
|
|
|
1.000
1.000 | 1.000 |
| | | Plot |
|
Lyso |
|
|
|
|
|
|
|
Other |
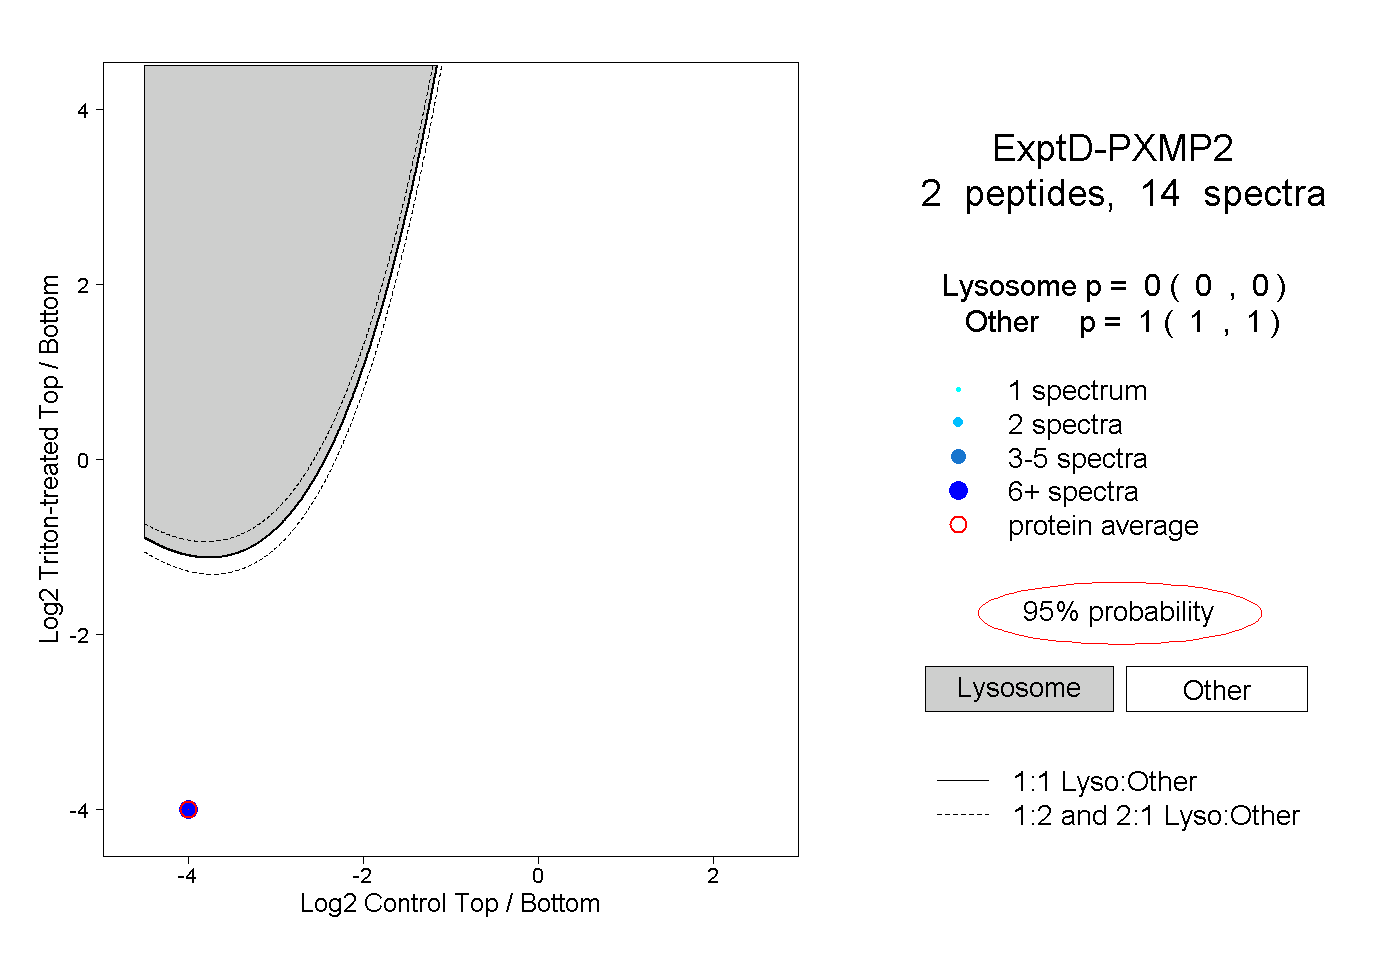
| Expt D |
2
peptides |
14
spectra |
 |
|
0.000
0.000 | 0.000 |
|
|
|
|
|
|
|
1.000
1.000 | 1.000 |