 7
7peptides
spectra

0.682 | 0.711
0.056 | 0.087
0.000 | 0.043
0.047 | 0.103
0.000 | 0.000
0.111 | 0.152
0.000 | 0.000
0.000 | 0.000
7peptides
spectra
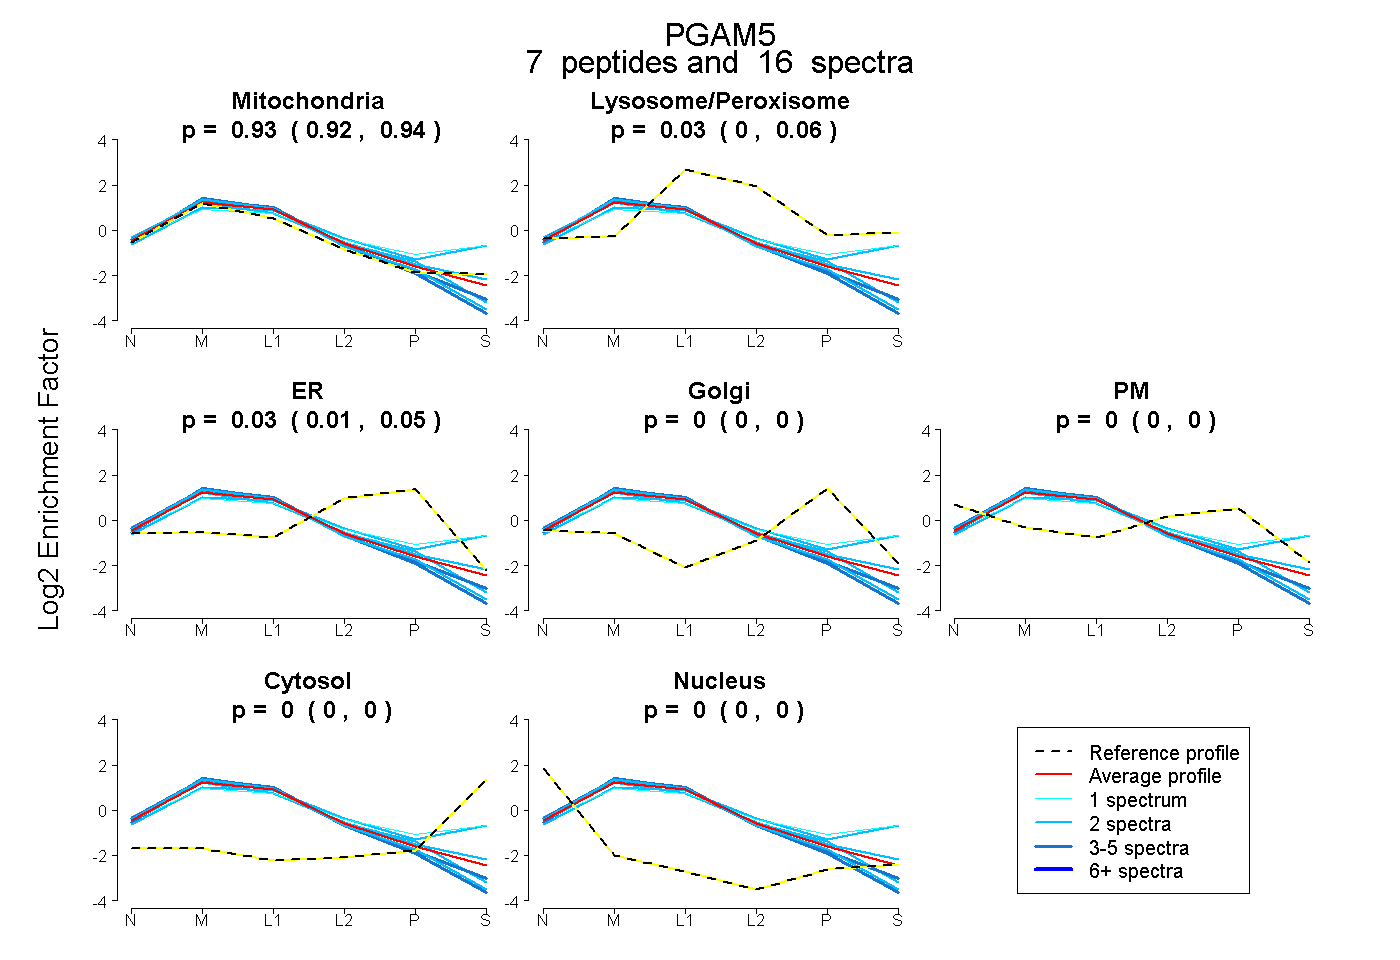
0.917 | 0.944
0.004 | 0.059
0.012 | 0.051
0.000 | 0.000
0.000 | 0.000
0.000 | 0.000
0.000 | 0.000
14peptides
spectra
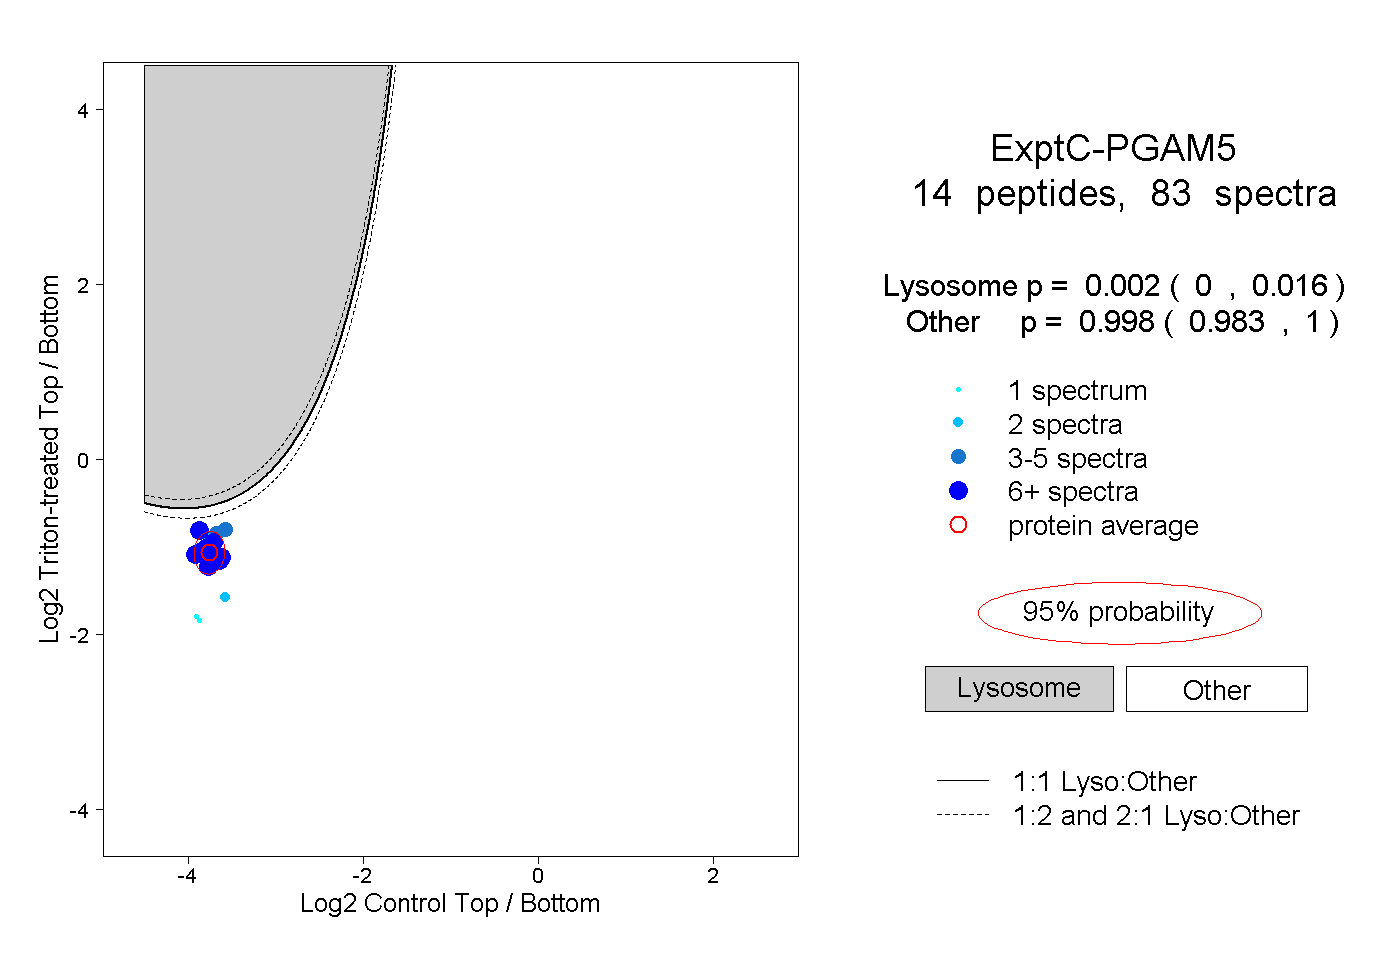
0.000 | 0.016
0.983 | 1.000
8peptides
spectra
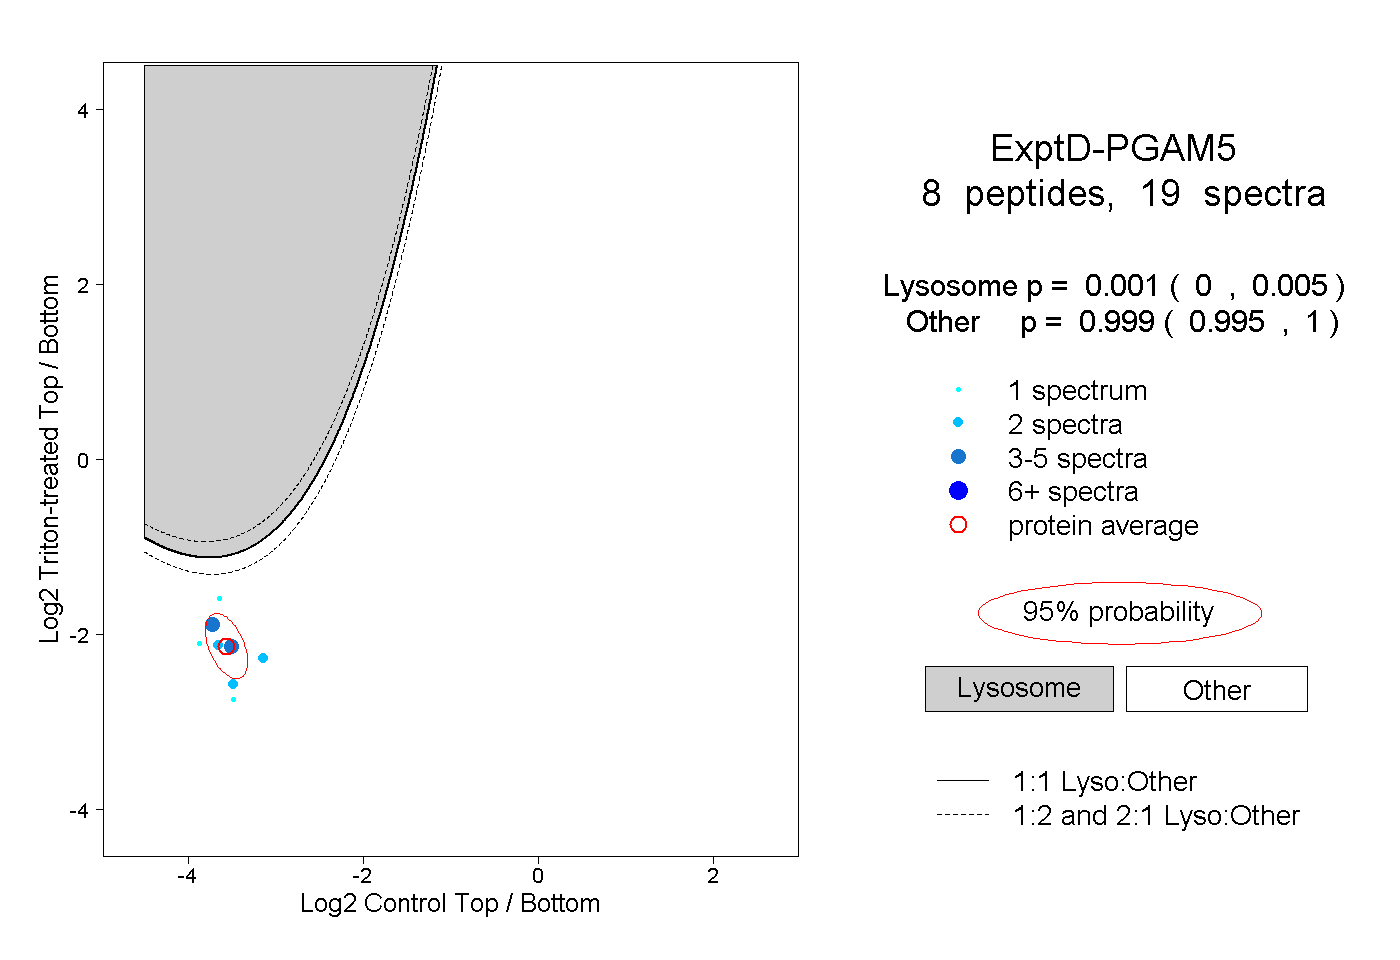
0.000 | 0.005
0.995 | 1.000