PGAM5
[ENSRNOP00000053513]
Main page
| | | Plot |
Mito |
Lyso |
|
Perox |
ER |
Golgi |
PM |
Cytosol |
Nucleus |
|
| Expt A |
 7
7
peptides |
22
spectra |
 |
0.698
0.682 | 0.711 |
0.075
0.056 | 0.087 |
|
0.017
0.000 | 0.043 |
0.078
0.047 | 0.103 |
0.000
0.000 | 0.000 |
0.132
0.111 | 0.152 |
0.000
0.000 | 0.000 |
0.000
0.000 | 0.000 |
|
| | | Plot |
Mito |
|
Lyso or Perox |
|
ER |
Golgi |
PM |
Cytosol |
Nucleus |
|
| Expt B |
7
peptides |
16
spectra |
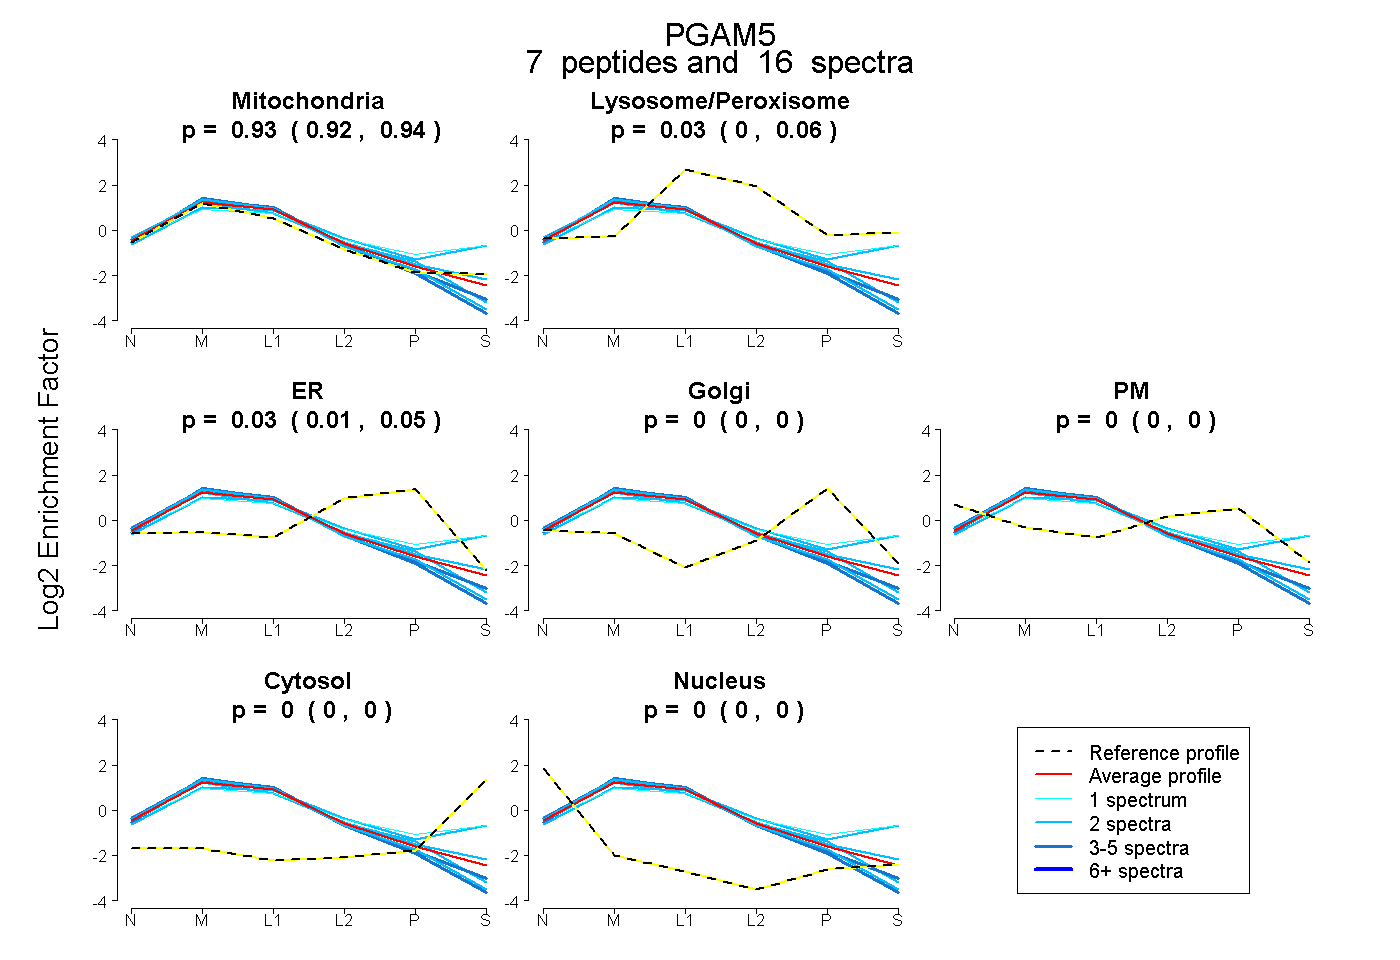 |
0.932
0.917 | 0.944 |
|
0.034
0.004 | 0.059 |
|
0.034
0.012 | 0.051 |
0.000
0.000 | 0.000 |
0.000
0.000 | 0.000 |
0.000
0.000 | 0.000 |
0.000
0.000 | 0.000 |
|
| | | Plot |
|
Lyso |
|
|
|
|
|
|
|
Other |
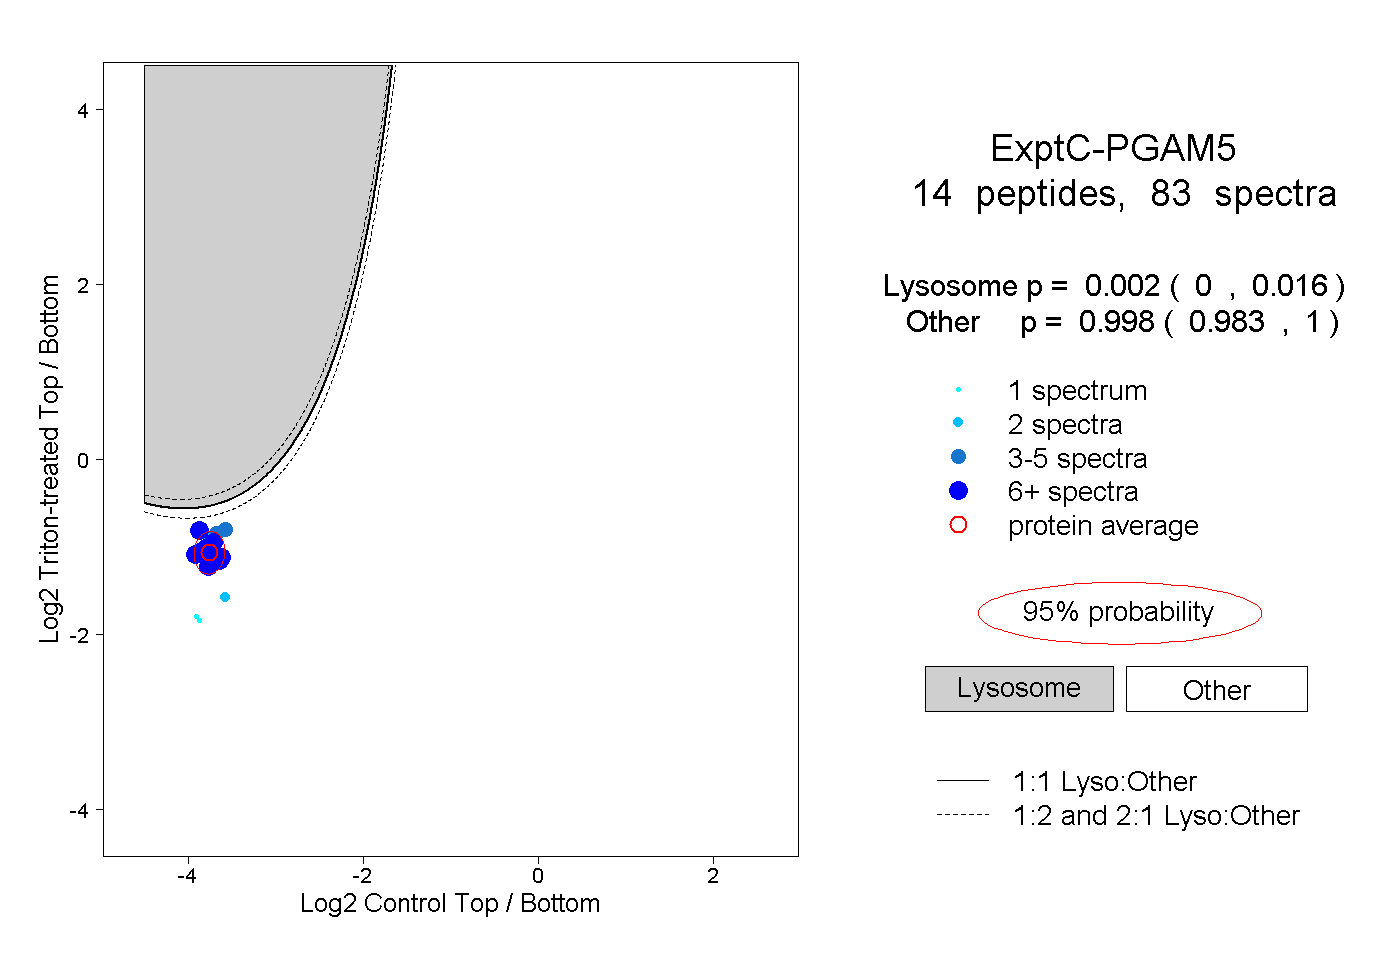
| Expt C |
14
peptides |
83
spectra |
 |
|
0.002
0.000 | 0.016 |
|
|
|
|
|
|
|
0.998
0.983 | 1.000 |
| 9 spectra, LASLGIK |
|
0.000 |
|
|
|
|
|
|
|
1.000 |
| 5 spectra, AVETTDIISK |
|
0.021 |
|
|
|
|
|
|
|
0.979 |
| 2 spectra, TLGDTGFMPPDK |
|
0.000 |
|
|
|
|
|
|
|
1.000 |
| 2 spectra, EPLSLINLK |
|
0.015 |
|
|
|
|
|
|
|
0.985 |
| 9 spectra, LEAAFR |
|
0.000 |
|
|
|
|
|
|
|
1.000 |
| 1 spectrum, IVHSSMTR |
|
0.000 |
|
|
|
|
|
|
|
1.000 |
| 12 spectra, VSTDLLR |
|
0.001 |
|
|
|
|
|
|
|
0.999 |
| 3 spectra, HSQYNVDGSMEK |
|
0.026 |
|
|
|
|
|
|
|
0.974 |
| 1 spectrum, HIFLIR |
|
0.000 |
|
|
|
|
|
|
|
1.000 |
| 8 spectra, ALQFPPEGWLR |
|
0.001 |
|
|
|
|
|
|
|
0.999 |
| 7 spectra, EQAELTGIR |
|
0.006 |
|
|
|
|
|
|
|
0.994 |
| 6 spectra, NVESGEDELASR |
|
0.039 |
|
|
|
|
|
|
|
0.961 |
| 8 spectra, HLPGVCR |
|
0.002 |
|
|
|
|
|
|
|
0.998 |
| 10 spectra, TLTPLGR |
|
0.003 |
|
|
|
|
|
|
|
0.997 |
| | | Plot |
|
Lyso |
|
|
|
|
|
|
|
Other |
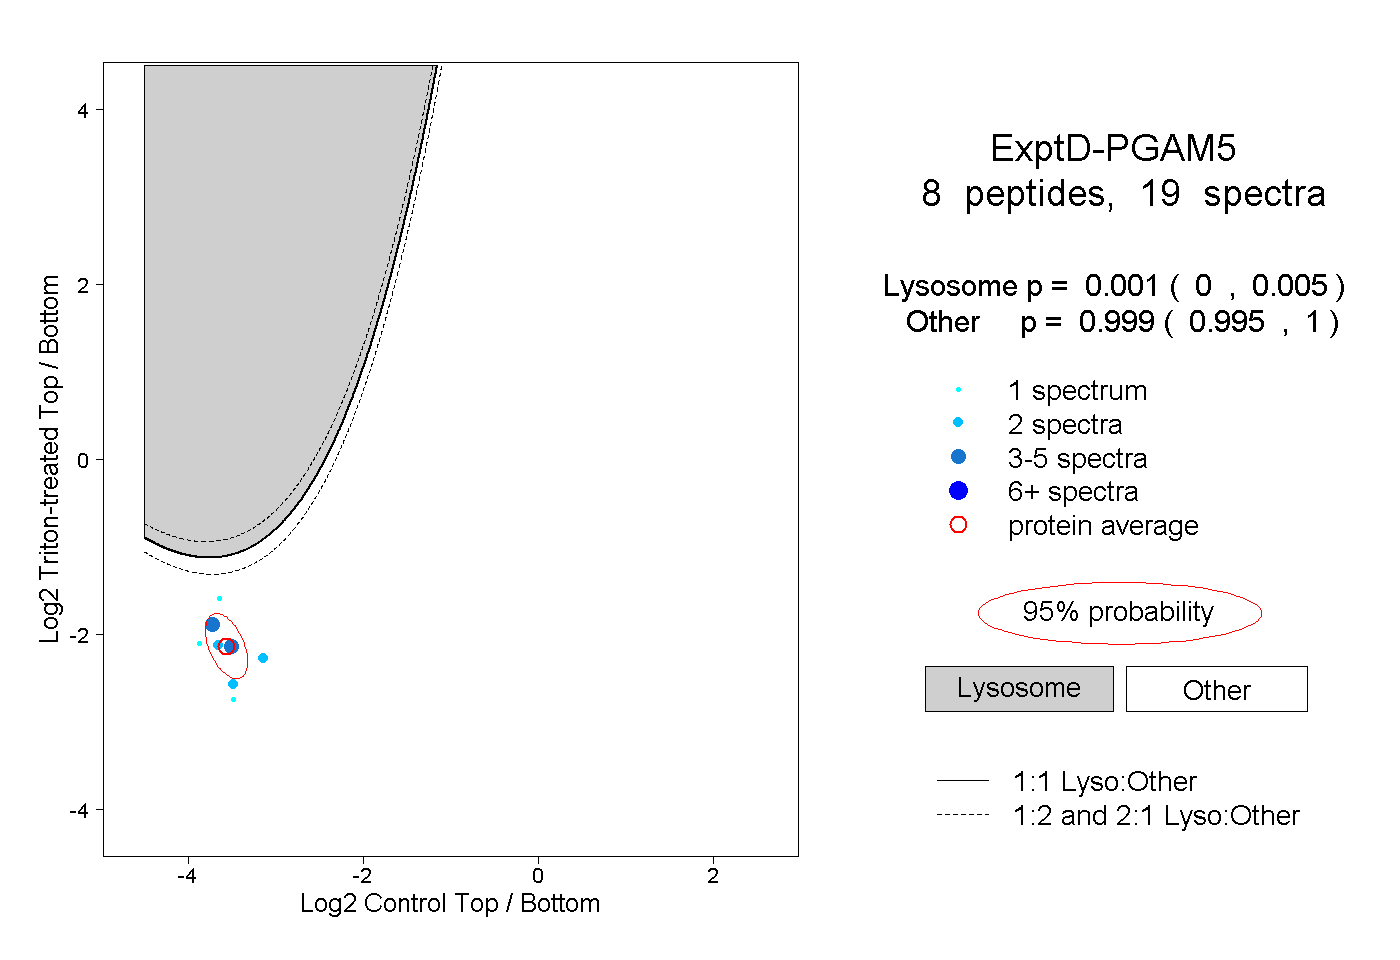
| Expt D |
8
peptides |
19
spectra |
 |
|
0.001
0.000 | 0.005 |
|
|
|
|
|
|
|
0.999
0.995 | 1.000 |