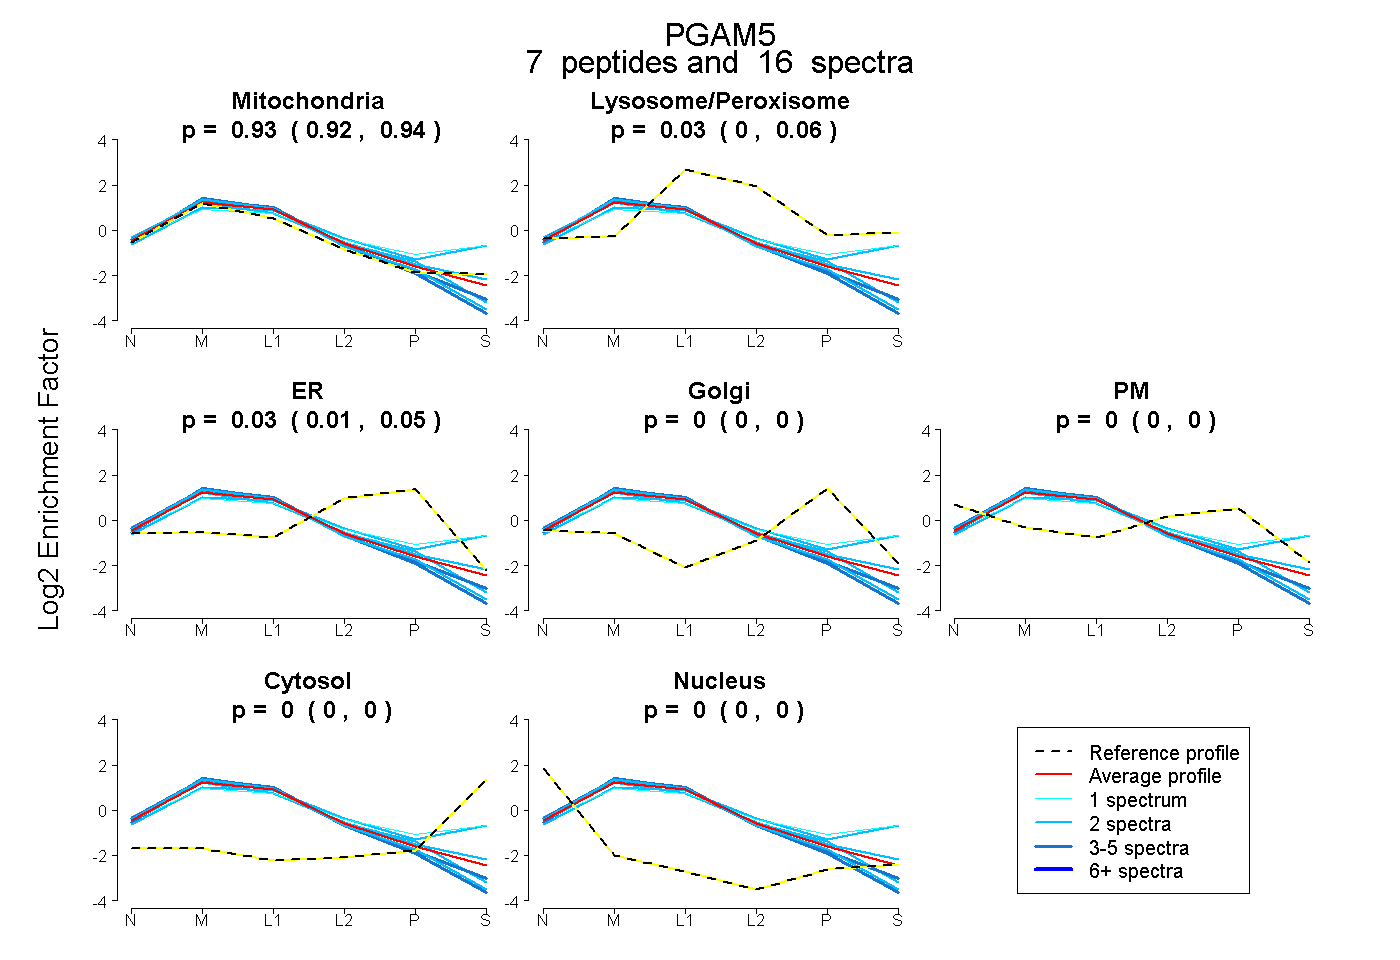
 7
7peptides
spectra

0.682 | 0.711
0.056 | 0.087
0.000 | 0.043
0.047 | 0.103
0.000 | 0.000
0.111 | 0.152
0.000 | 0.000
0.000 | 0.000
| Plot | Mito | Lyso | Perox | ER | Golgi | PM | Cytosol | Nucleus | |||||
| Expt A |
7 peptides |
22 spectra |
|
0.698 0.682 | 0.711 |
0.075 0.056 | 0.087 |
0.017 0.000 | 0.043 |
0.078 0.047 | 0.103 |
0.000 0.000 | 0.000 |
0.132 0.111 | 0.152 |
0.000 0.000 | 0.000 |
0.000 0.000 | 0.000 |
| 2 spectra, EQAELTGIR | 0.822 | 0.000 | 0.047 | 0.044 | 0.000 | 0.087 | 0.000 | 0.000 | ||
| 4 spectra, NVESGEDELASR | 0.794 | 0.000 | 0.000 | 0.023 | 0.000 | 0.183 | 0.000 | 0.000 | ||
| 3 spectra, HLPGVCR | 0.531 | 0.047 | 0.045 | 0.377 | 0.000 | 0.000 | 0.000 | 0.000 | ||
| 2 spectra, IVHSSMTR | 0.449 | 0.058 | 0.231 | 0.000 | 0.211 | 0.051 | 0.000 | 0.000 | ||
| 1 spectrum, TLTPLGR | 0.837 | 0.008 | 0.000 | 0.000 | 0.000 | 0.155 | 0.000 | 0.000 | ||
| 8 spectra, HIFLIR | 0.772 | 0.039 | 0.000 | 0.049 | 0.000 | 0.140 | 0.000 | 0.000 | ||
| 2 spectra, ALQFPPEGWLR | 0.503 | 0.119 | 0.213 | 0.000 | 0.025 | 0.090 | 0.050 | 0.000 |
| Plot | Mito | Lyso or Perox | ER | Golgi | PM | Cytosol | Nucleus | ||||||
| Expt B |
7 peptides |
16 spectra |
 |
0.932 0.917 | 0.944 |
0.034 0.004 | 0.059 |
0.034 0.012 | 0.051 |
0.000 0.000 | 0.000 |
0.000 0.000 | 0.000 |
0.000 0.000 | 0.000 |
0.000 0.000 | 0.000 |
|||
| Plot | Lyso | Other | |||||||||||
| Expt C |
14 peptides |
83 spectra |
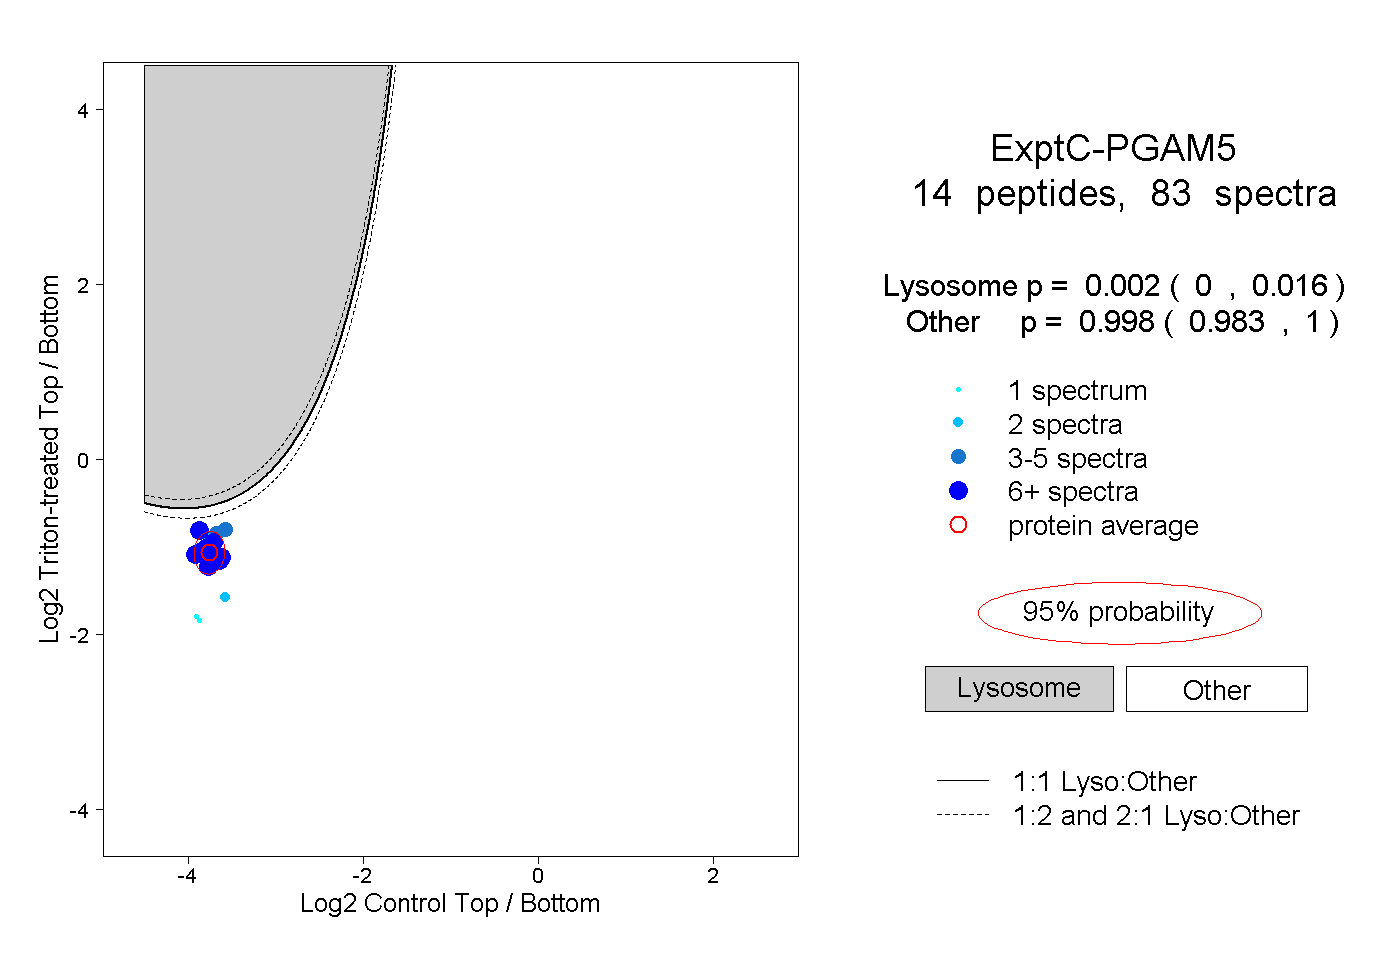 |
0.002 0.000 | 0.016 |
0.998 0.983 | 1.000 |
||||||||
| Plot | Lyso | Other | |||||||||||
| Expt D |
8 peptides |
19 spectra |
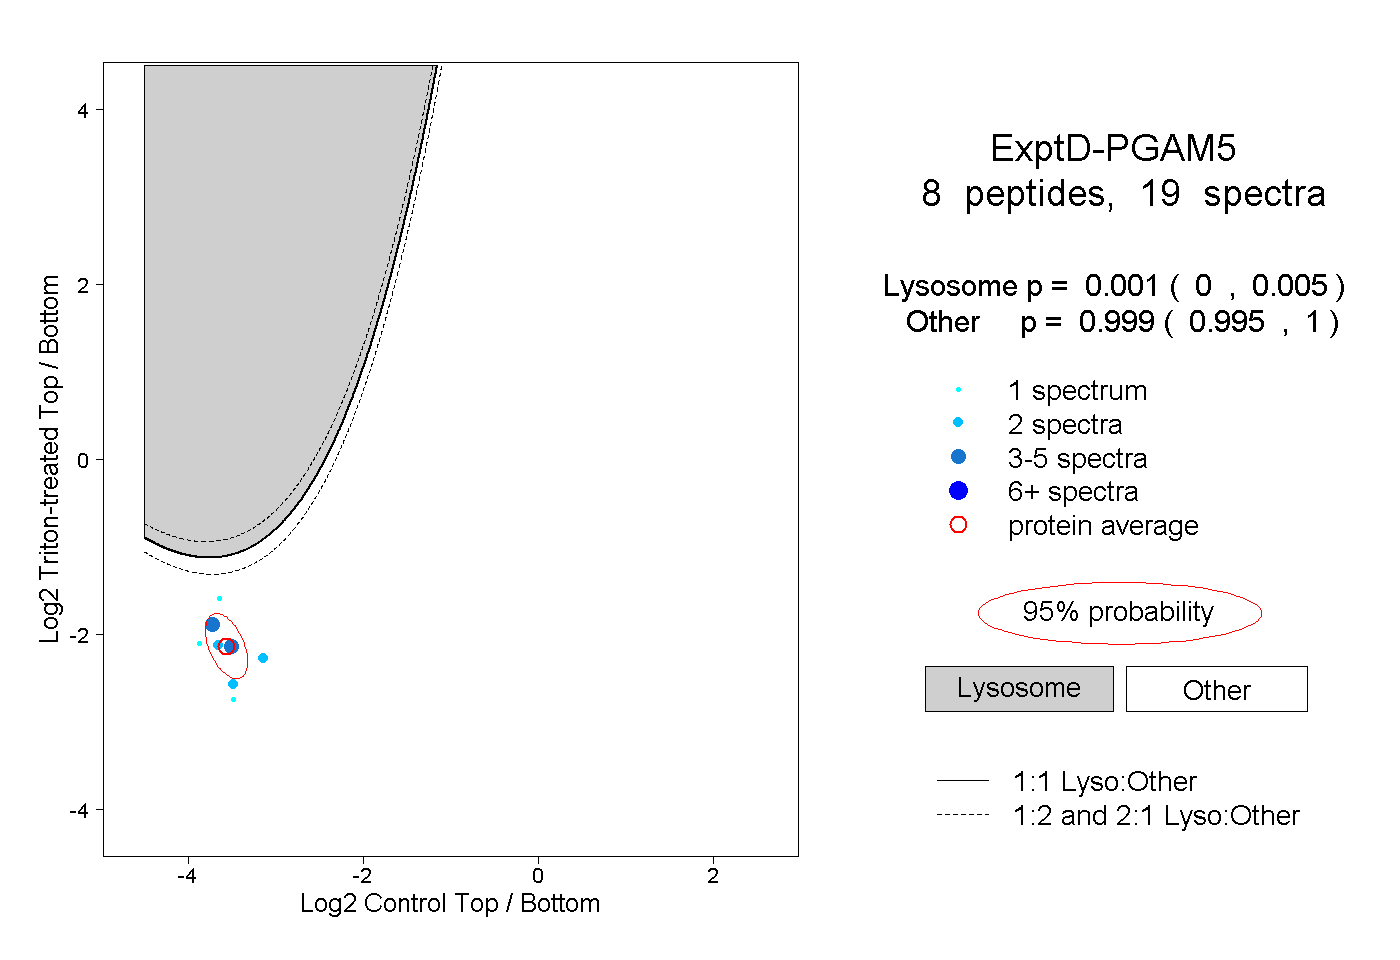 |
0.001 0.000 | 0.005 |
0.999 0.995 | 1.000 |