 13
13peptides
spectra
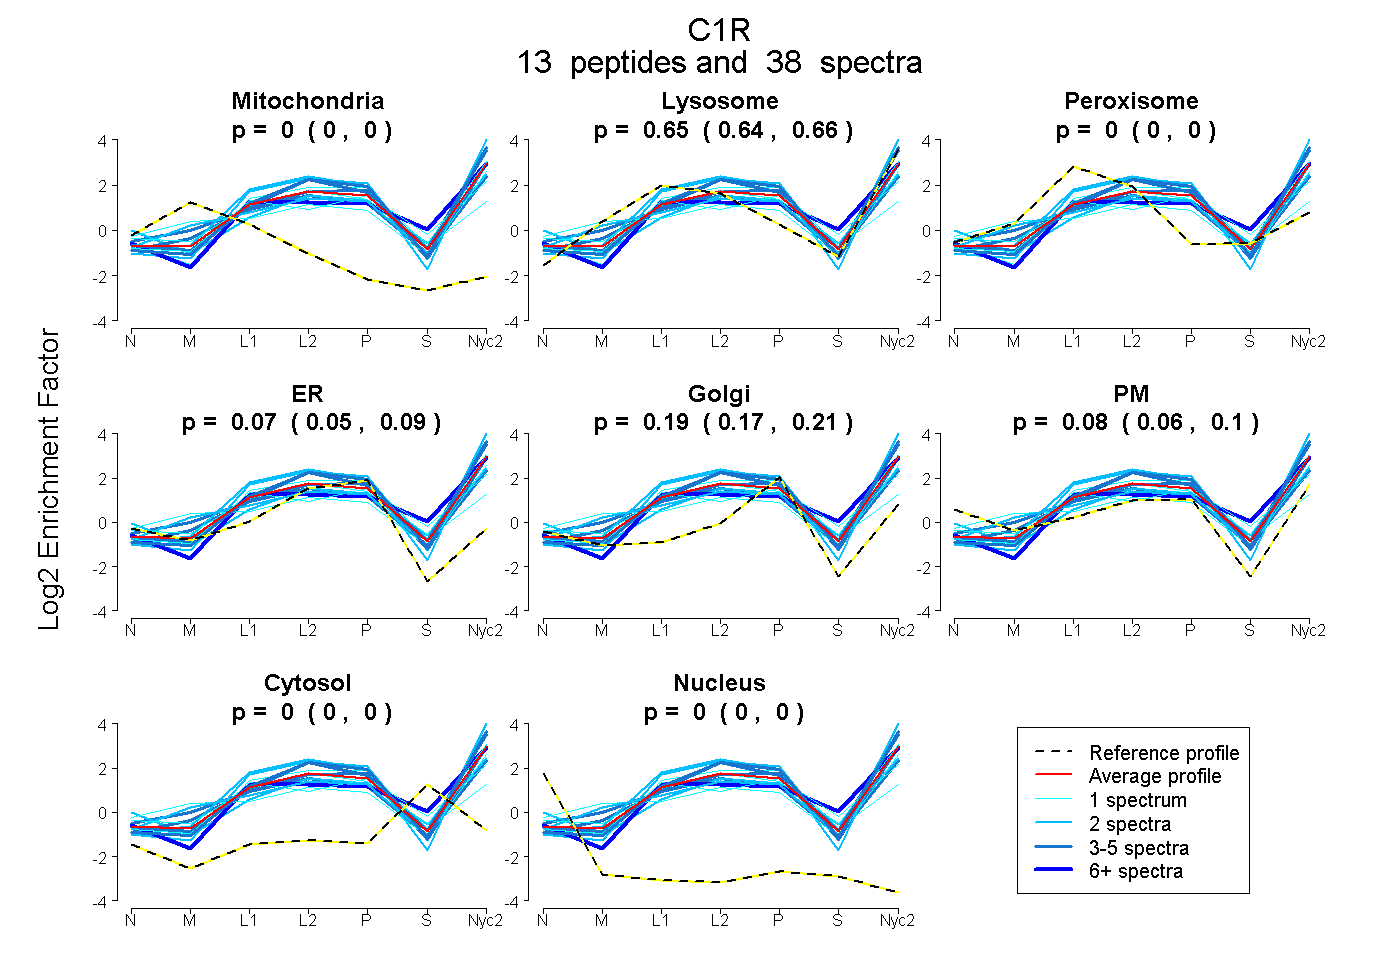
0.000 | 0.000
0.644 | 0.661
0.000 | 0.000
0.046 | 0.093
0.170 | 0.208
0.063 | 0.103
0.000 | 0.000
0.000 | 0.000
6peptides
spectra
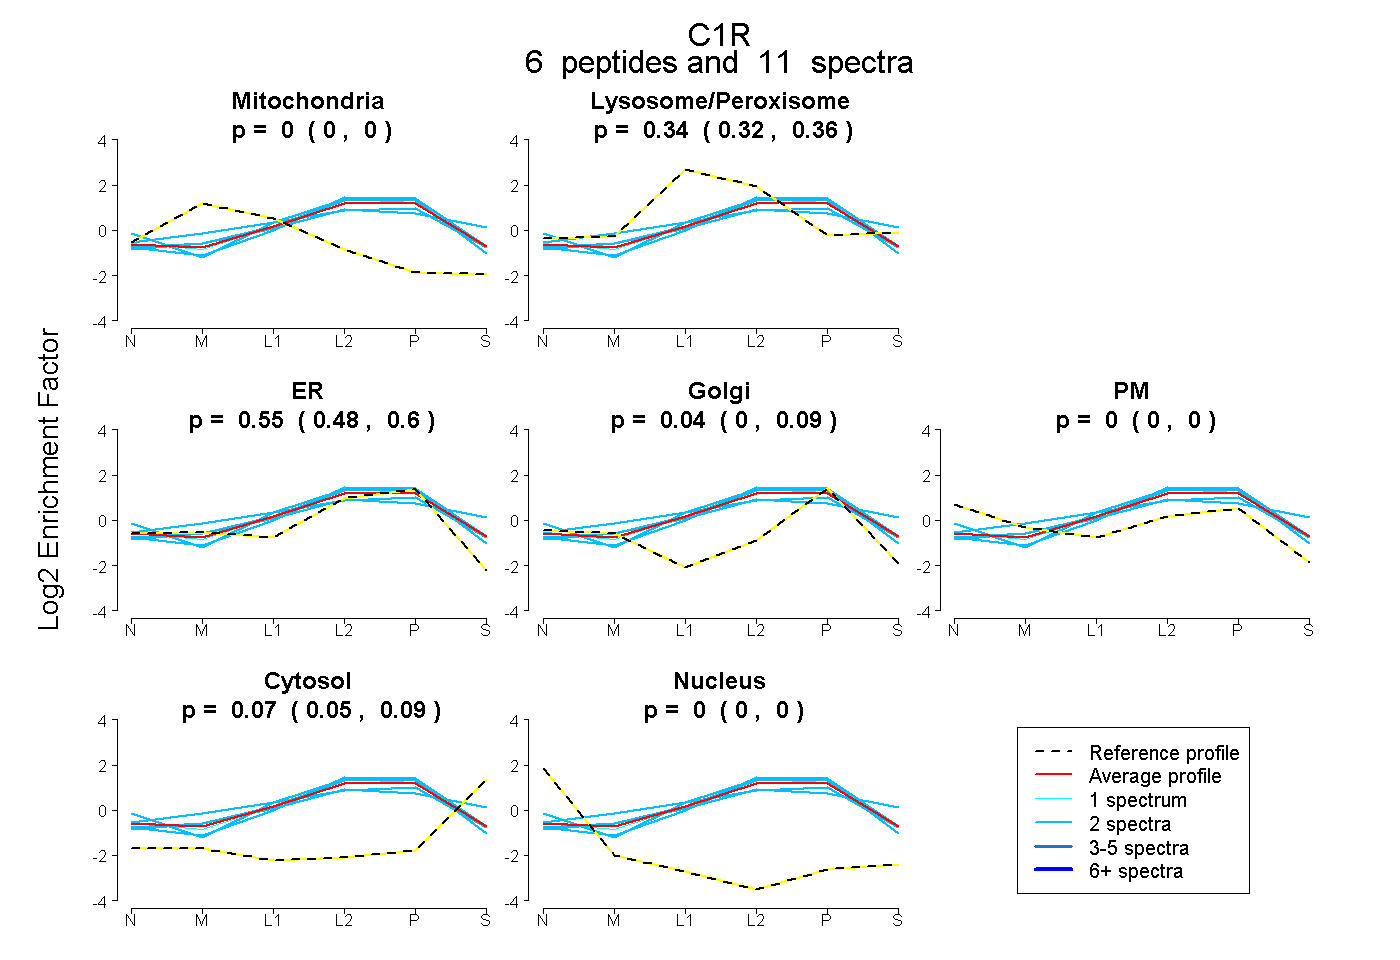
0.000 | 0.000
0.321 | 0.363
0.479 | 0.598
0.000 | 0.090
0.000 | 0.000
0.048 | 0.085
0.000 | 0.000
19peptides
spectra
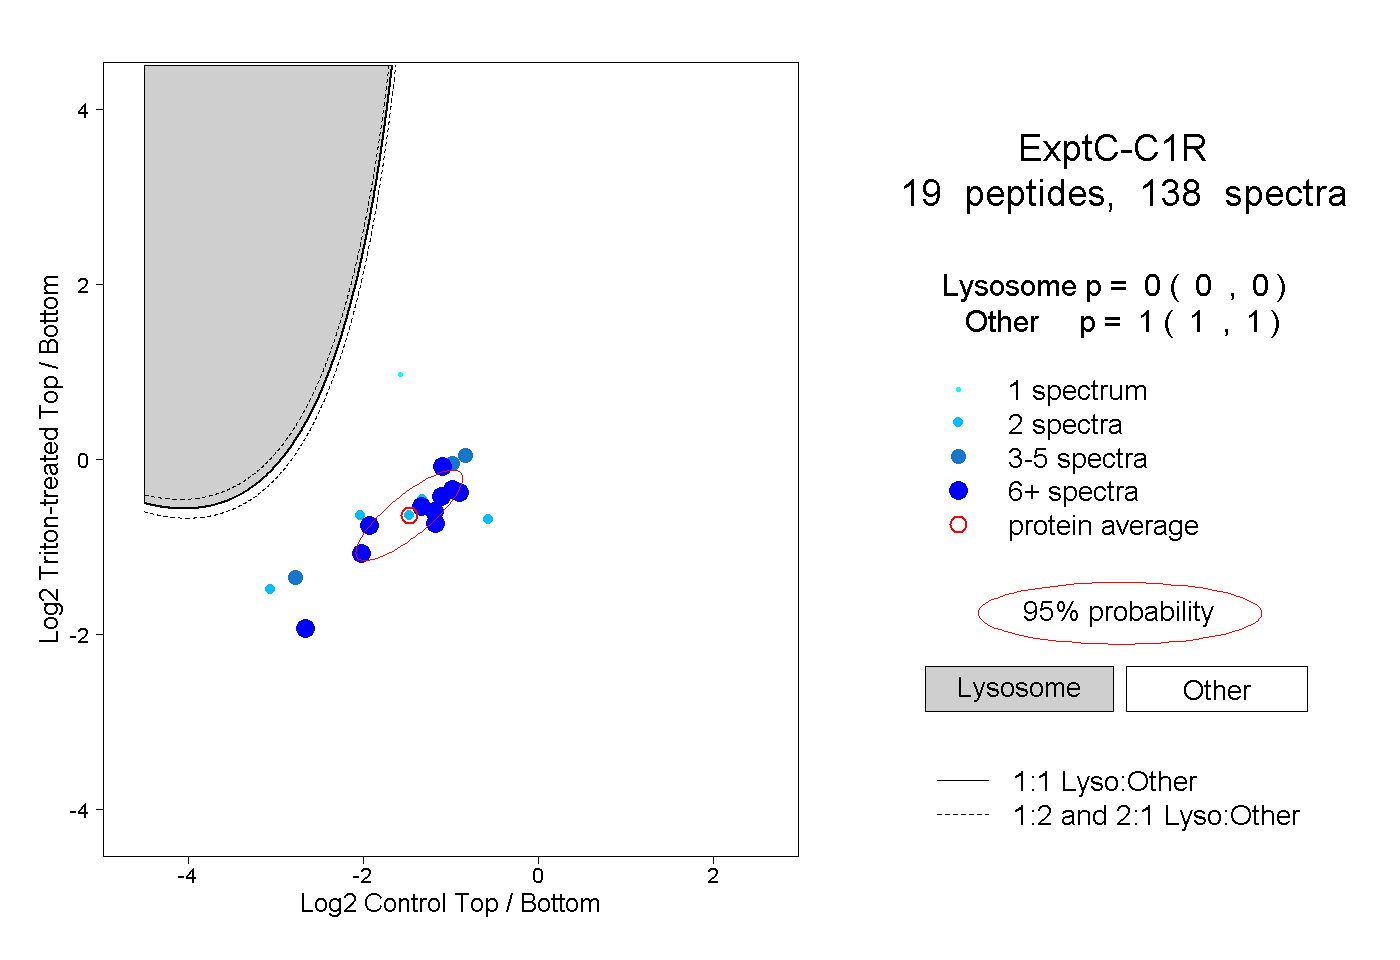
0.000 | 0.000
1.000 | 1.000
7peptides
spectra
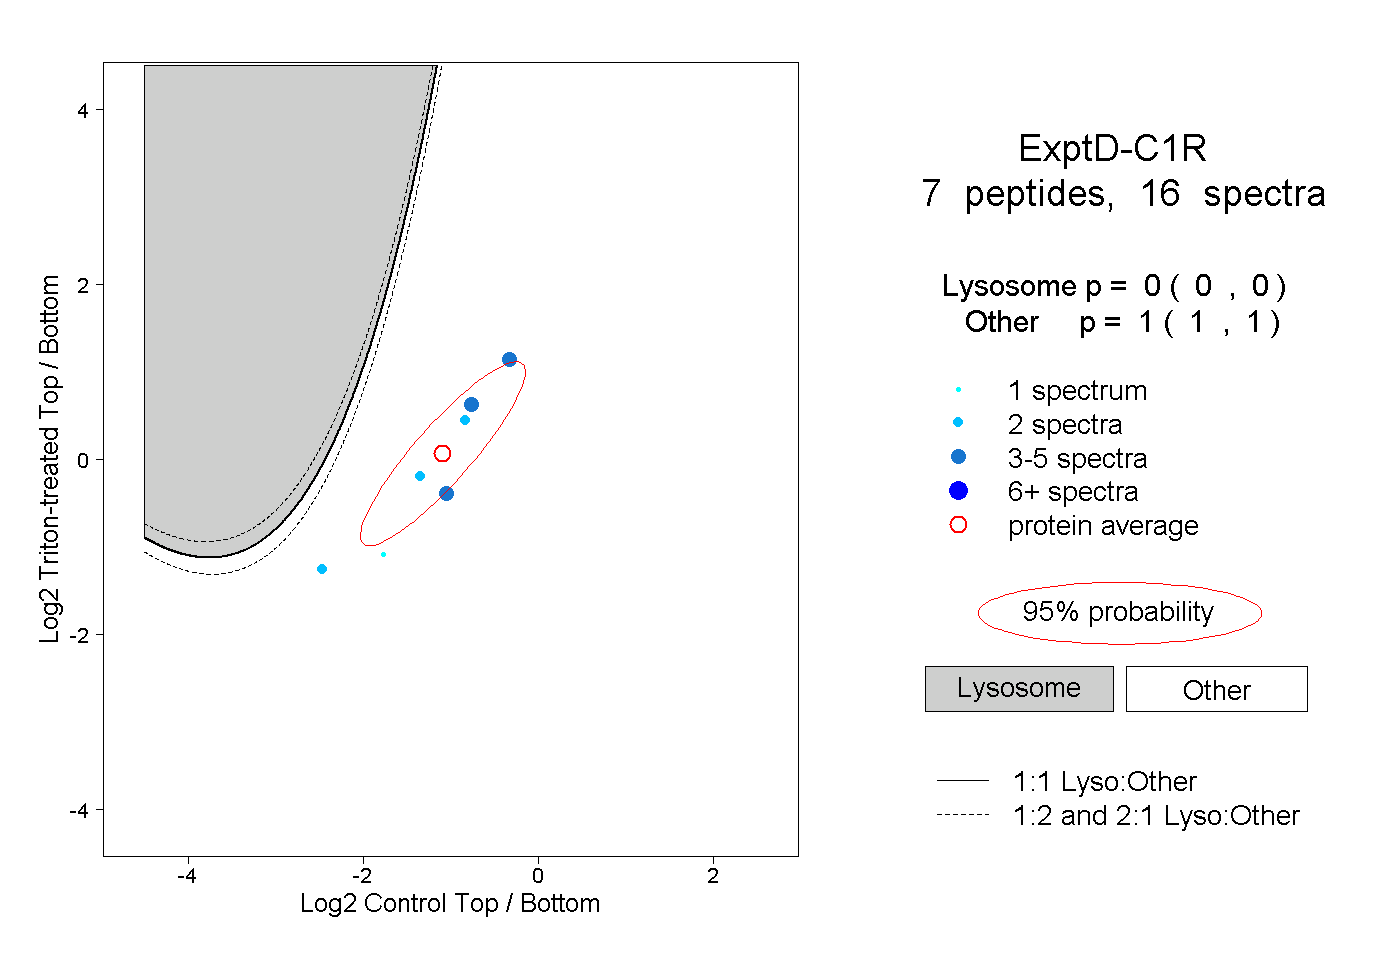
0.000 | 0.000
1.000 | 1.000