 13
13peptides
spectra
0.000 | 0.000
0.644 | 0.661
0.000 | 0.000
0.046 | 0.093
0.170 | 0.208
0.063 | 0.103
0.000 | 0.000
0.000 | 0.000
| Plot | Mito | Lyso | Perox | ER | Golgi | PM | Cytosol | Nucleus | |||||
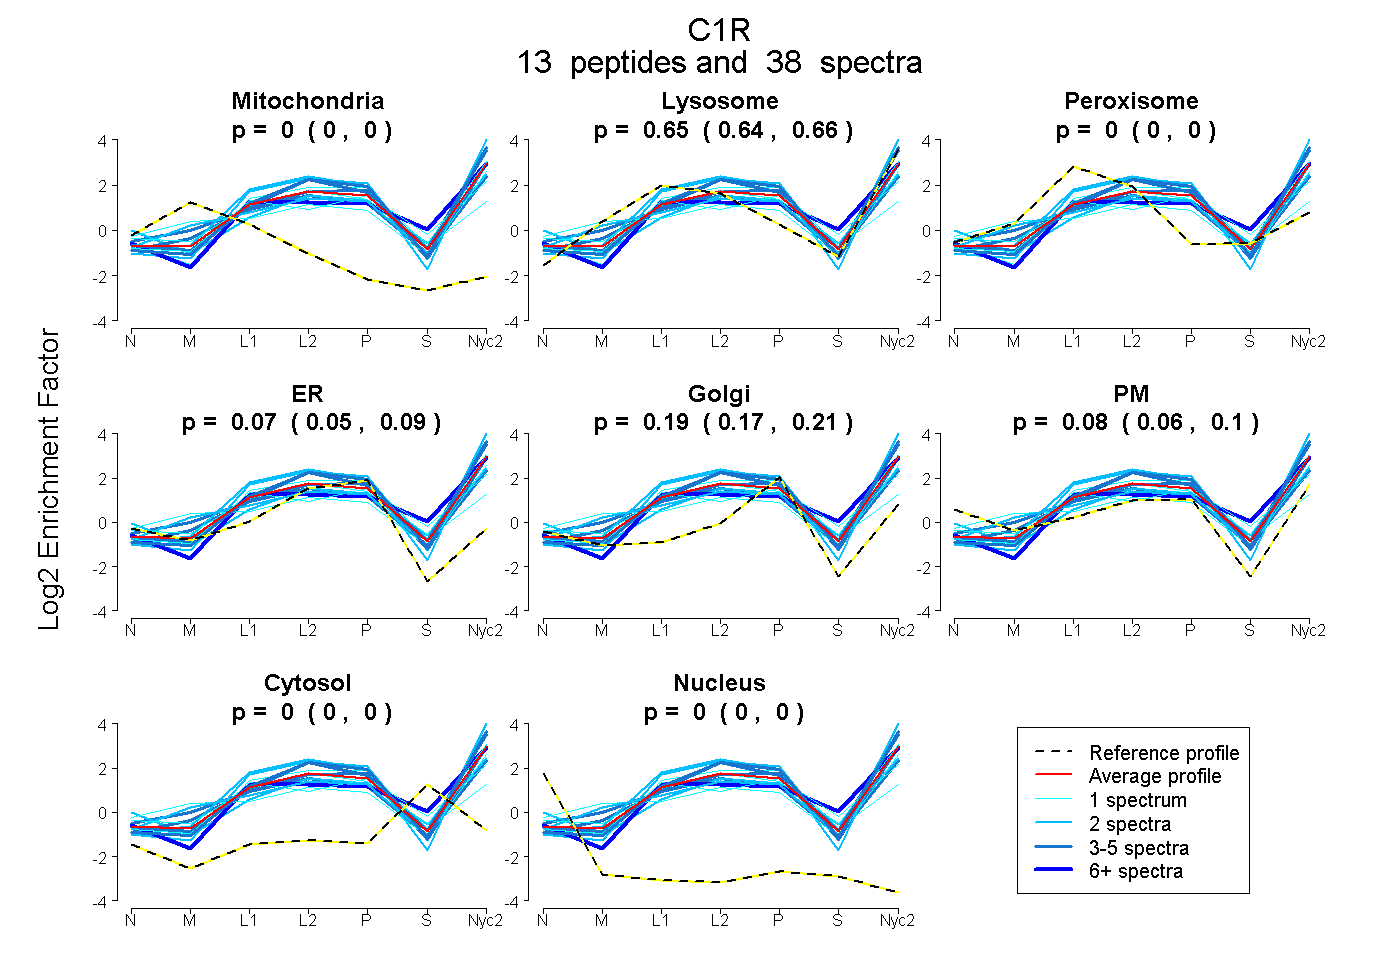
| Expt A |
13 peptides |
38 spectra |
|
0.000 0.000 | 0.000 |
0.653 0.644 | 0.661 |
0.000 0.000 | 0.000 |
0.072 0.046 | 0.093 |
0.190 0.170 | 0.208 |
0.085 0.063 | 0.103 |
0.000 0.000 | 0.000 |
0.000 0.000 | 0.000 |
| 1 spectrum, IQYYCHDPYYK | 0.000 | 0.510 | 0.101 | 0.000 | 0.273 | 0.000 | 0.116 | 0.000 | ||
| 2 spectra, FCGQQDSPQGNPPGR | 0.000 | 0.382 | 0.000 | 0.012 | 0.016 | 0.474 | 0.117 | 0.000 | ||
| 1 spectrum, LGHHPVR | 0.000 | 0.458 | 0.000 | 0.000 | 0.019 | 0.473 | 0.050 | 0.000 | ||
| 11 spectra, GVNTYEAR | 0.000 | 0.643 | 0.000 | 0.000 | 0.089 | 0.087 | 0.181 | 0.000 | ||
| 2 spectra, EFMSQGNK | 0.000 | 0.817 | 0.000 | 0.055 | 0.127 | 0.000 | 0.000 | 0.000 | ||
| 1 spectrum, DYFIVTCK | 0.000 | 0.338 | 0.103 | 0.495 | 0.000 | 0.000 | 0.064 | 0.000 | ||
| 4 spectra, ANPGNFPWQAFTNIHGR | 0.000 | 0.537 | 0.000 | 0.151 | 0.019 | 0.260 | 0.033 | 0.000 | ||
| 1 spectrum, LPIADR | 0.000 | 0.615 | 0.000 | 0.000 | 0.057 | 0.299 | 0.029 | 0.000 | ||
| 4 spectra, GGGALLGDR | 0.000 | 0.656 | 0.000 | 0.094 | 0.250 | 0.000 | 0.000 | 0.000 | ||
| 2 spectra, GLTVHLK | 0.000 | 0.789 | 0.000 | 0.067 | 0.000 | 0.144 | 0.000 | 0.000 | ||
| 4 spectra, IAFNLR | 0.000 | 0.702 | 0.000 | 0.031 | 0.123 | 0.143 | 0.000 | 0.000 | ||
| 3 spectra, WILTAAHTIYPK | 0.000 | 0.739 | 0.000 | 0.067 | 0.185 | 0.008 | 0.000 | 0.000 | ||
| 2 spectra, LLNYVDWIK | 0.000 | 0.656 | 0.000 | 0.000 | 0.218 | 0.126 | 0.000 | 0.000 |
| Plot | Mito | Lyso or Perox | ER | Golgi | PM | Cytosol | Nucleus | ||||||
| Expt B |
6 peptides |
11 spectra |
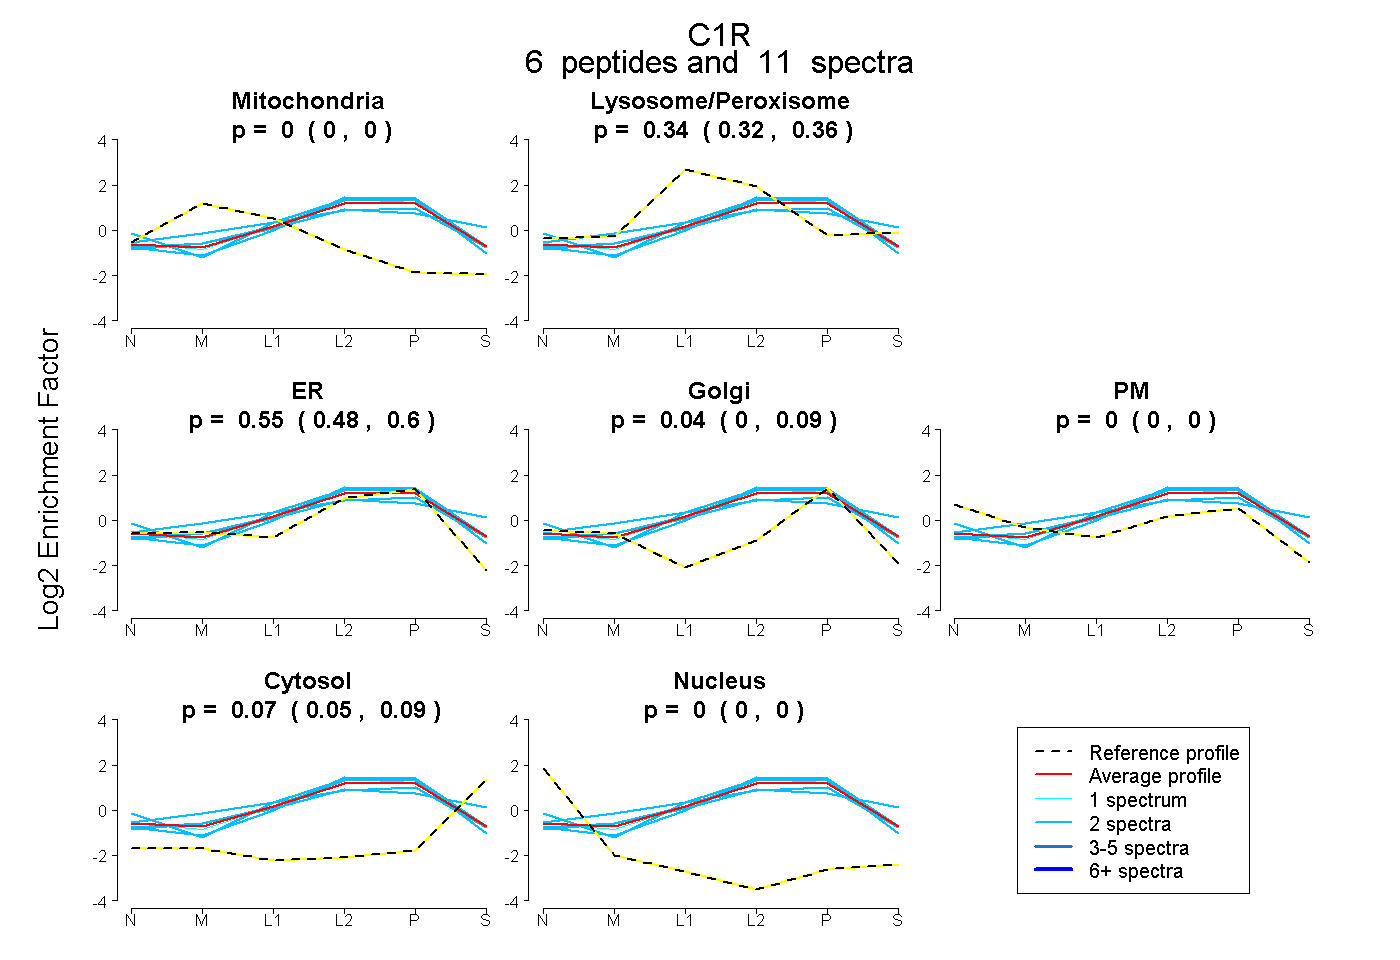 |
0.000 0.000 | 0.000 |
0.341 0.321 | 0.363 |
0.553 0.479 | 0.598 |
0.036 0.000 | 0.090 |
0.000 0.000 | 0.000 |
0.070 0.048 | 0.085 |
0.000 0.000 | 0.000 |
|||
| Plot | Lyso | Other | |||||||||||
| Expt C |
19 peptides |
138 spectra |
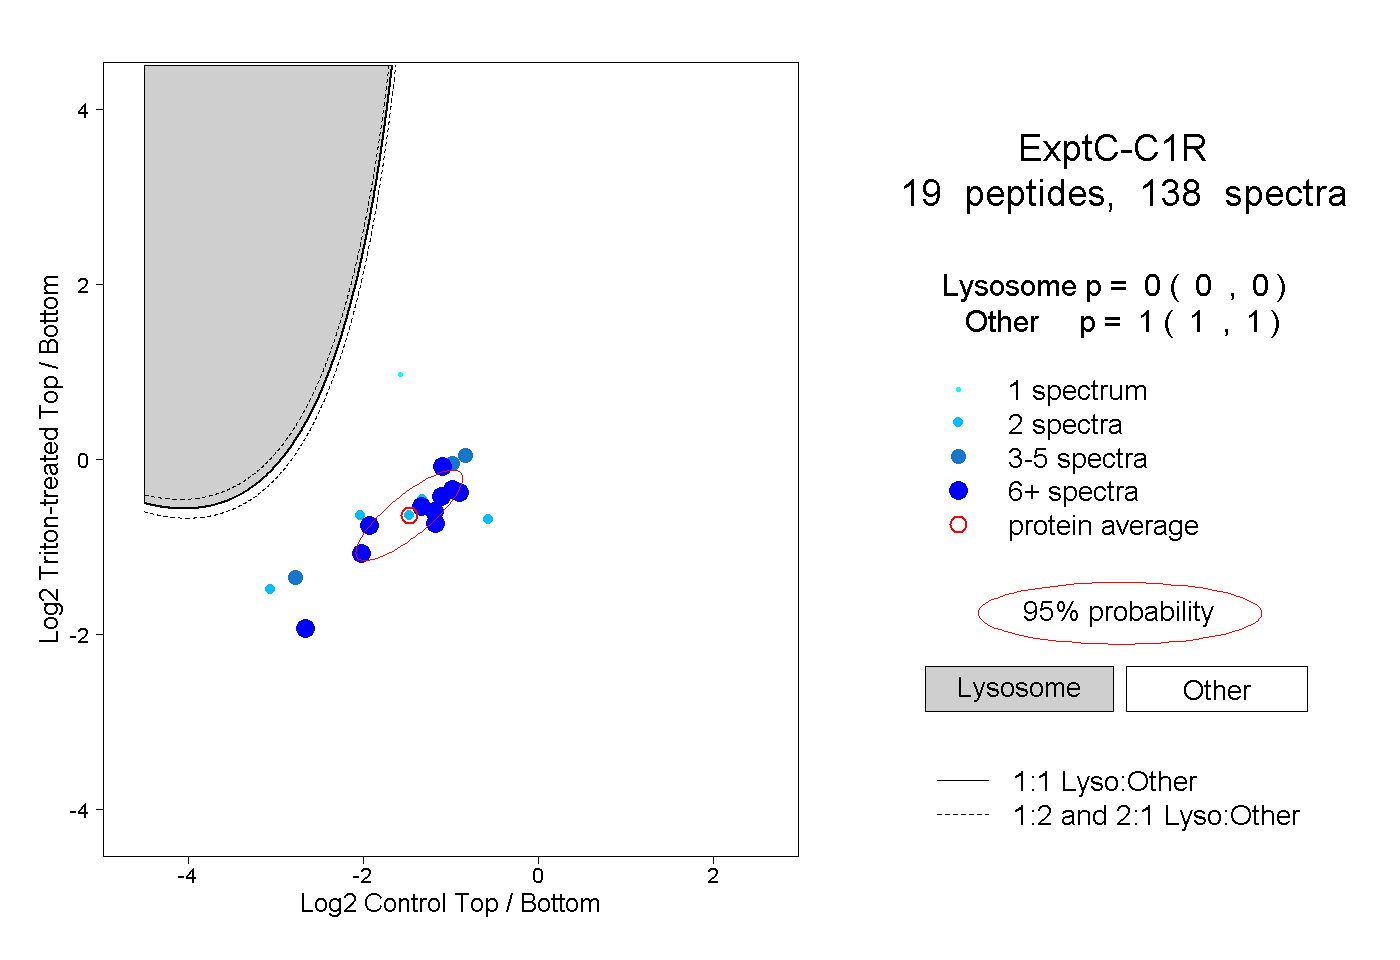 |
0.000 0.000 | 0.000 |
1.000 1.000 | 1.000 |
||||||||
| Plot | Lyso | Other | |||||||||||
| Expt D |
7 peptides |
16 spectra |
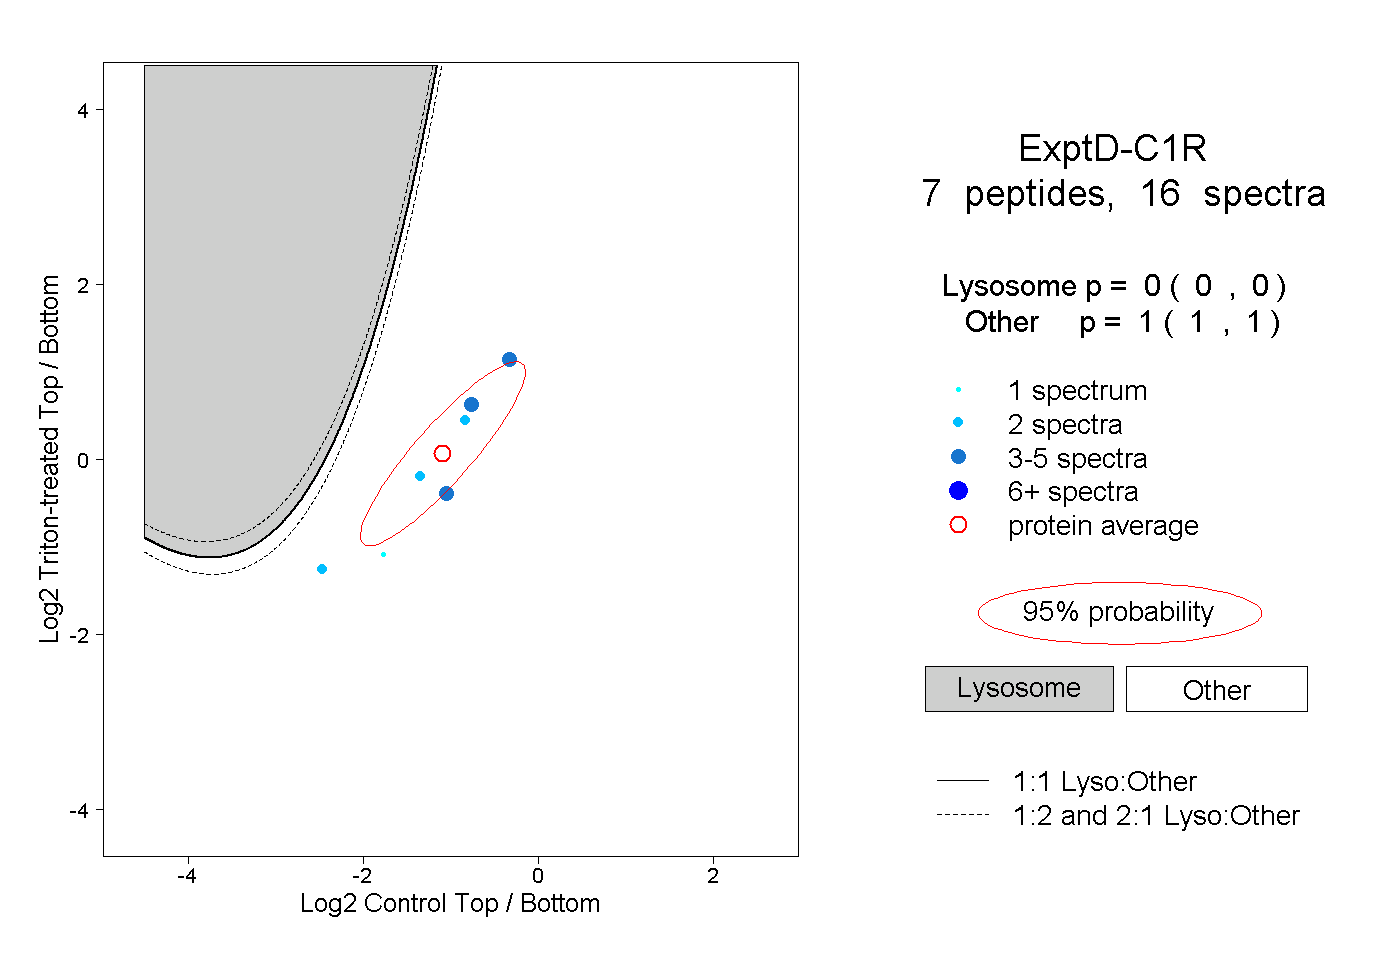 |
0.000 0.000 | 0.000 |
1.000 1.000 | 1.000 |