 12
12peptides
spectra
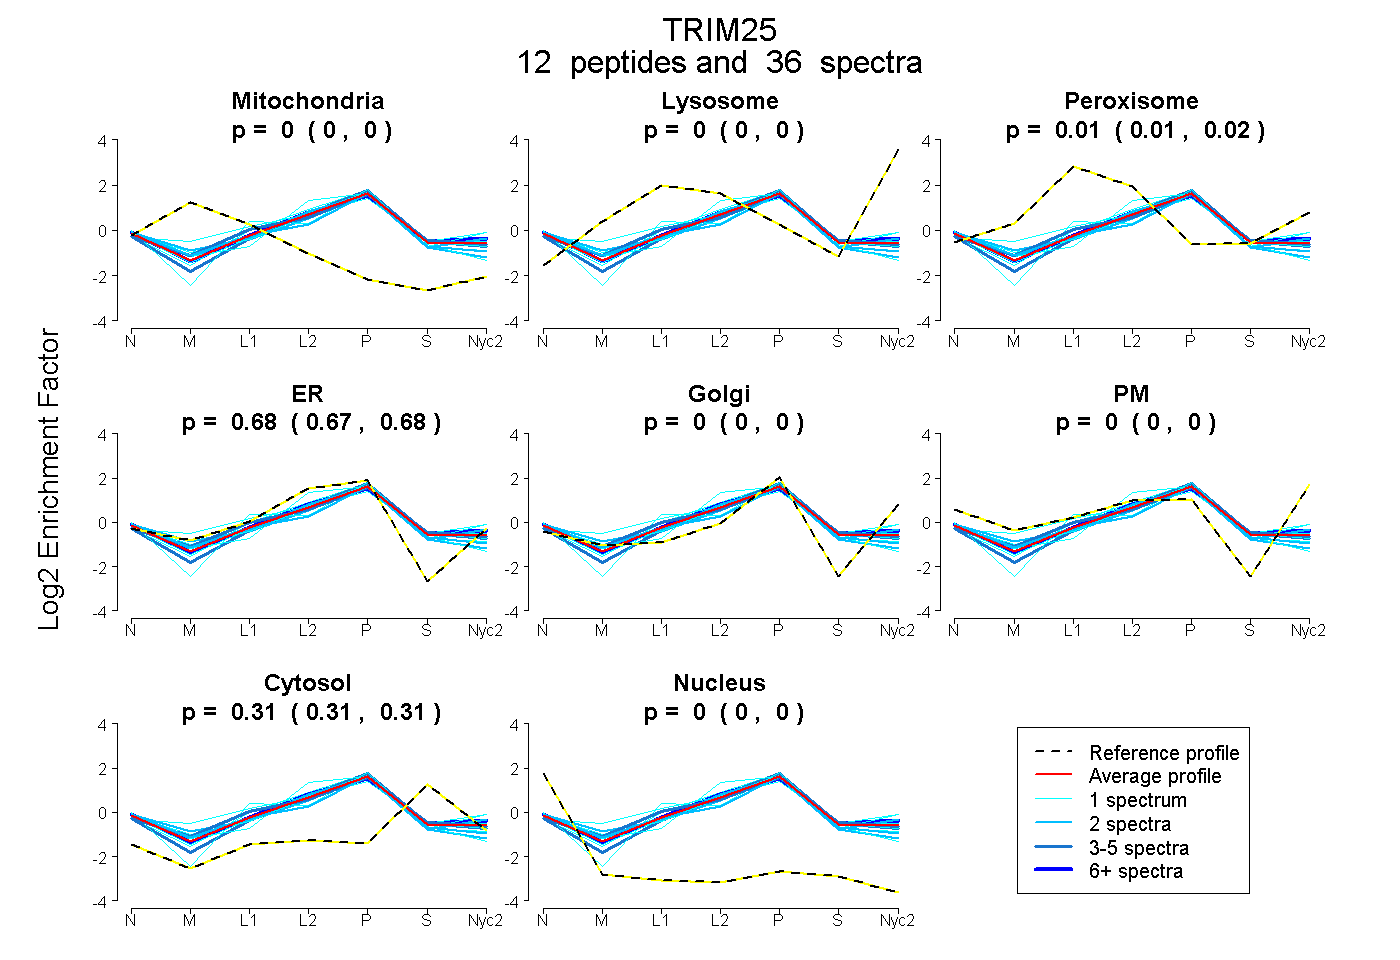
0.000 | 0.000
0.000 | 0.000
0.007 | 0.017
0.672 | 0.679
0.000 | 0.000
0.000 | 0.000
0.308 | 0.315
0.000 | 0.000
5peptides
spectra
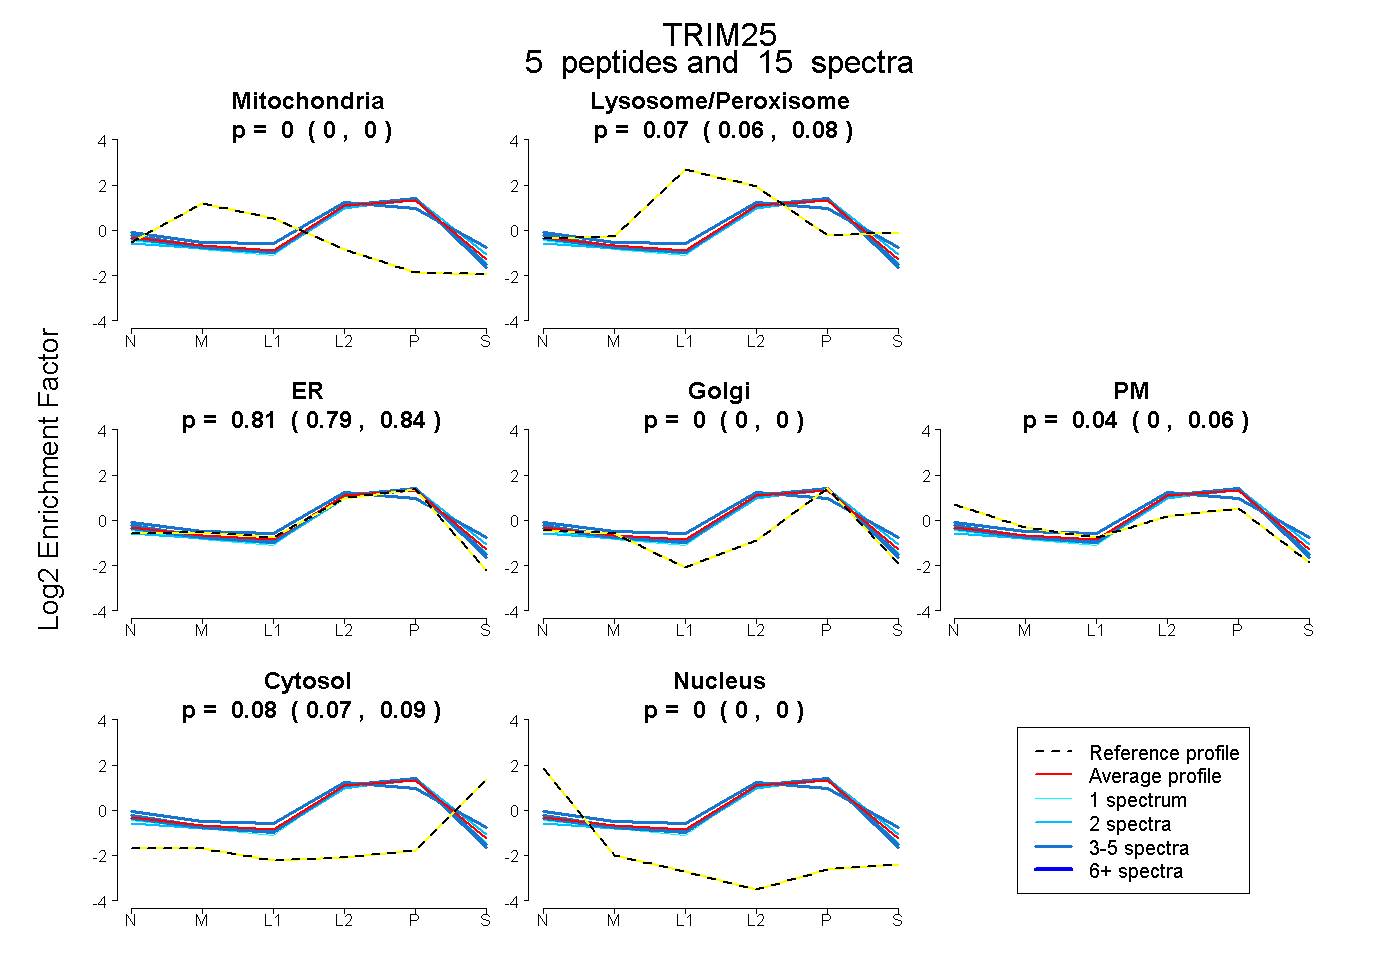
0.000 | 0.000
0.061 | 0.085
0.786 | 0.837
0.000 | 0.001
0.005 | 0.060
0.065 | 0.085
0.000 | 0.000
11peptides
spectra
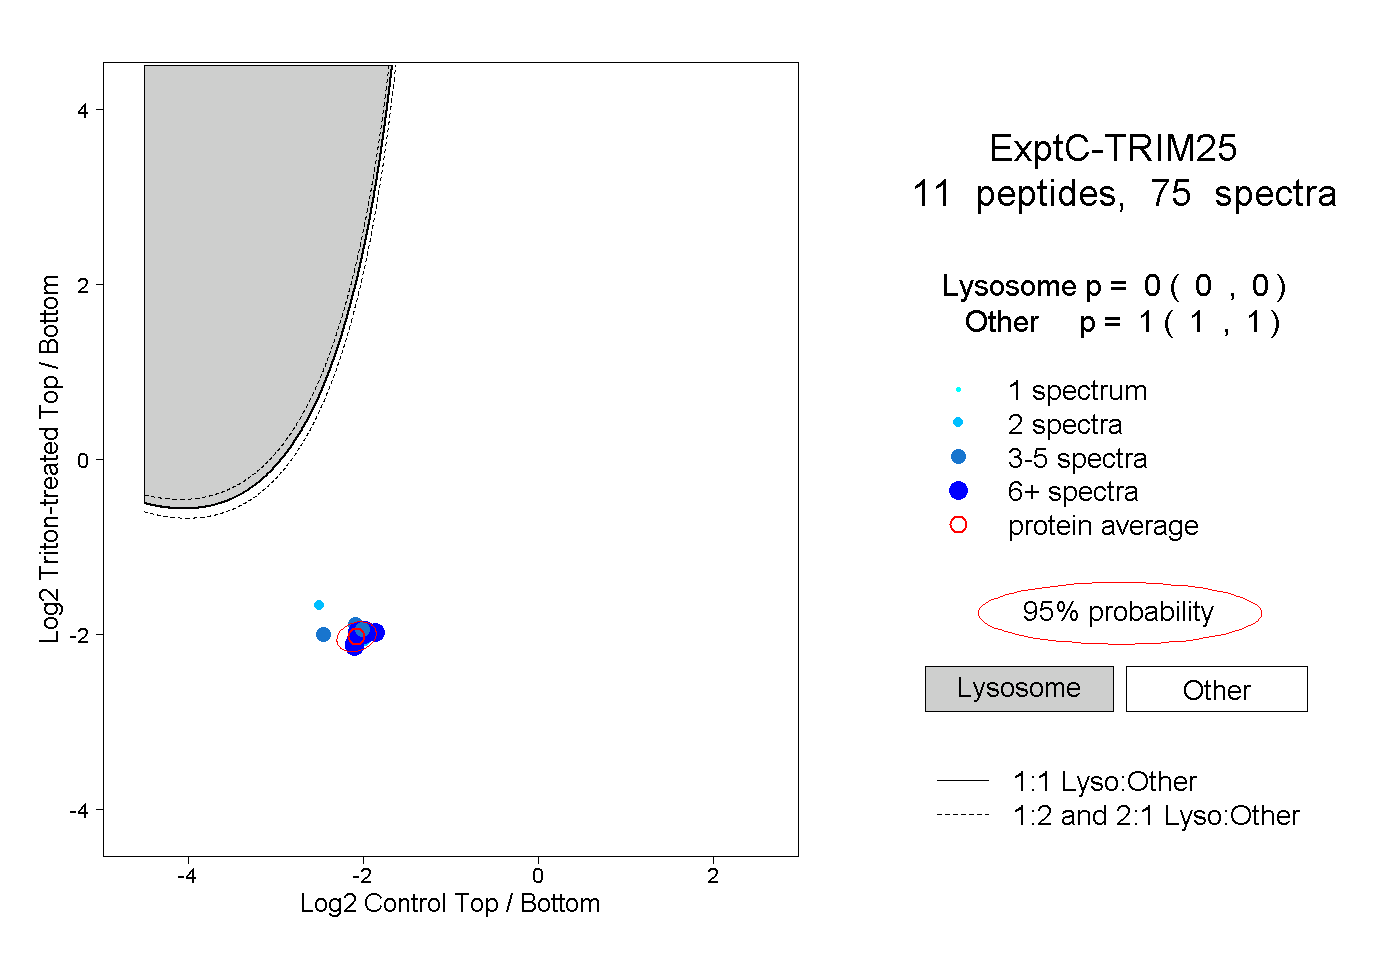
0.000 | 0.000
1.000 | 1.000
5peptides
spectra
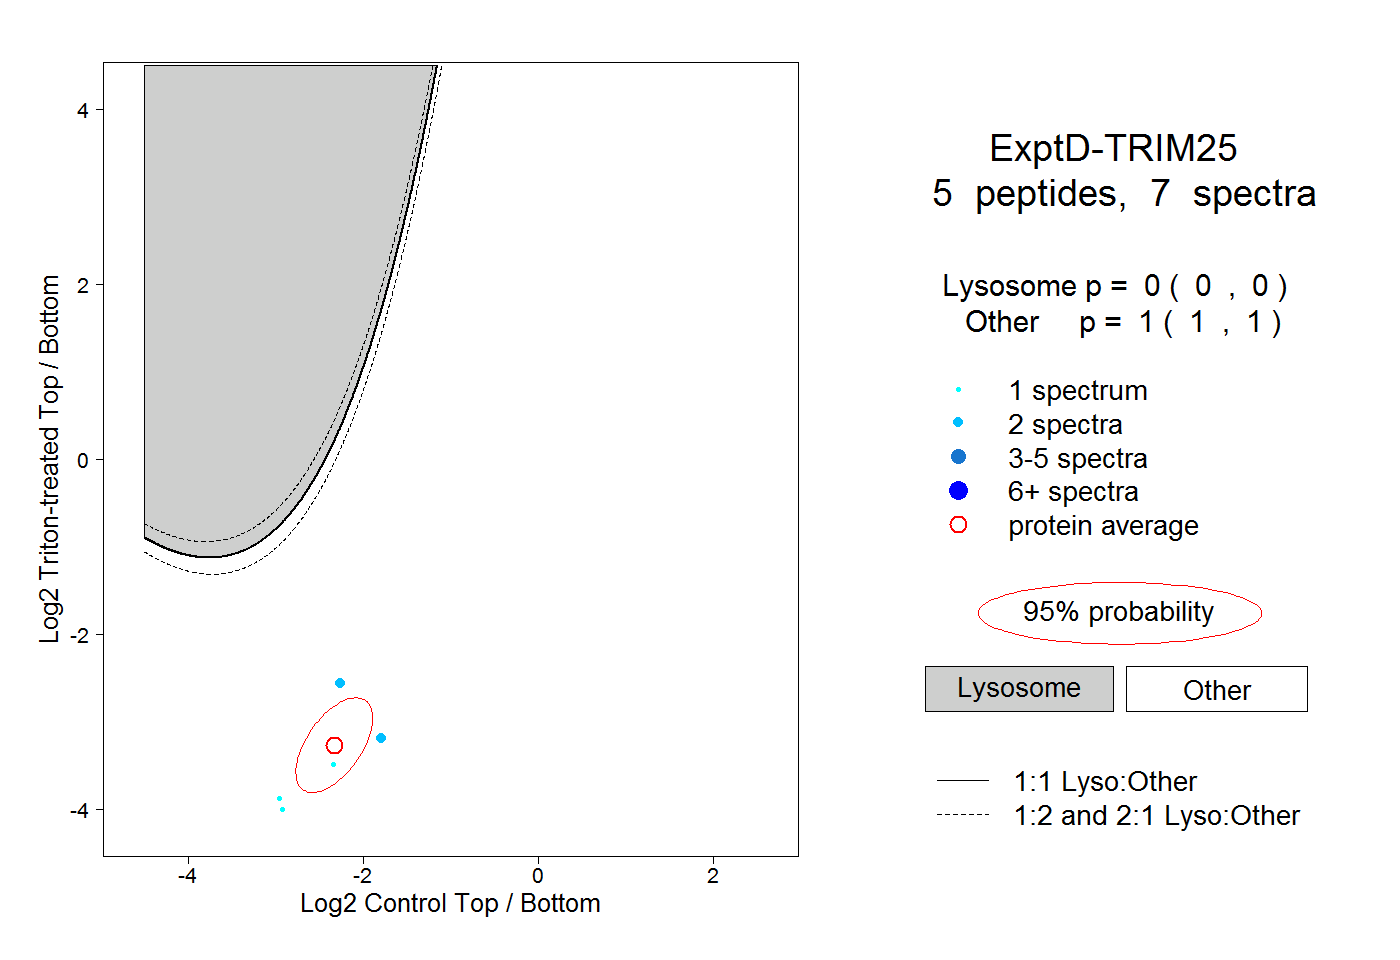
0.000 | 0.000
1.000 | 1.000