 12
12peptides
spectra
0.000 | 0.000
0.000 | 0.000
0.007 | 0.017
0.672 | 0.679
0.000 | 0.000
0.000 | 0.000
0.308 | 0.315
0.000 | 0.000
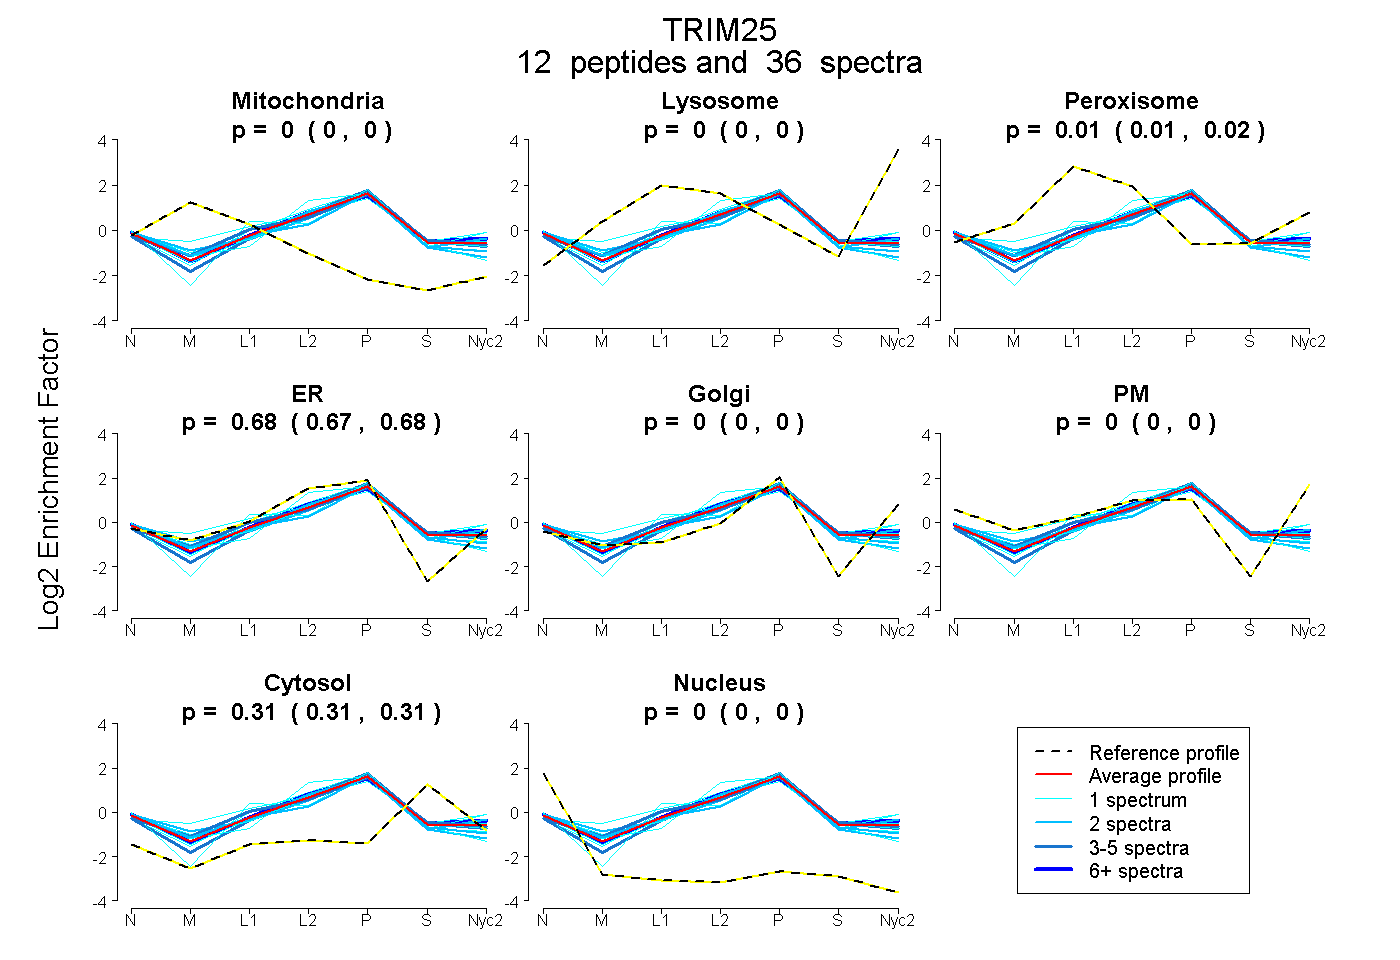
| Plot | Mito | Lyso | Perox | ER | Golgi | PM | Cytosol | Nucleus | |||||
| Expt A |
12 peptides |
36 spectra |
|
0.000 0.000 | 0.000 |
0.000 0.000 | 0.000 |
0.012 0.007 | 0.017 |
0.676 0.672 | 0.679 |
0.000 0.000 | 0.000 |
0.000 0.000 | 0.000 |
0.312 0.308 | 0.315 |
0.000 0.000 | 0.000 |
| 1 spectrum, SAASSSDTQVSCDHCLK | 0.000 | 0.000 | 0.000 | 0.649 | 0.000 | 0.000 | 0.351 | 0.000 | ||
| 5 spectra, IDLDHDLIK | 0.000 | 0.000 | 0.000 | 0.664 | 0.000 | 0.000 | 0.336 | 0.000 | ||
| 2 spectra, TVYQVRPQLHK | 0.000 | 0.000 | 0.000 | 0.668 | 0.008 | 0.000 | 0.324 | 0.000 | ||
| 1 spectrum, QQNVQESMK | 0.000 | 0.000 | 0.000 | 0.707 | 0.000 | 0.000 | 0.293 | 0.000 | ||
| 1 spectrum, LDTIYQVLLK | 0.000 | 0.000 | 0.000 | 0.664 | 0.000 | 0.084 | 0.252 | 0.000 | ||
| 1 spectrum, ALEDVK | 0.000 | 0.000 | 0.030 | 0.684 | 0.000 | 0.000 | 0.286 | 0.000 | ||
| 15 spectra, GDEFEFLEK | 0.000 | 0.000 | 0.043 | 0.632 | 0.018 | 0.000 | 0.307 | 0.000 | ||
| 2 spectra, AEVELILAK | 0.000 | 0.000 | 0.000 | 0.687 | 0.000 | 0.000 | 0.313 | 0.000 | ||
| 1 spectrum, LQEVSTKPVYIPK | 0.000 | 0.000 | 0.000 | 0.680 | 0.000 | 0.000 | 0.320 | 0.000 | ||
| 4 spectra, TPVDDWIPPTR | 0.000 | 0.000 | 0.070 | 0.625 | 0.000 | 0.000 | 0.306 | 0.000 | ||
| 1 spectrum, LTIMYSHINGASK | 0.000 | 0.000 | 0.240 | 0.345 | 0.216 | 0.000 | 0.200 | 0.000 | ||
| 2 spectra, QEYLEMK | 0.000 | 0.000 | 0.054 | 0.614 | 0.090 | 0.000 | 0.243 | 0.000 |
| Plot | Mito | Lyso or Perox | ER | Golgi | PM | Cytosol | Nucleus | ||||||
| Expt B |
5 peptides |
15 spectra |
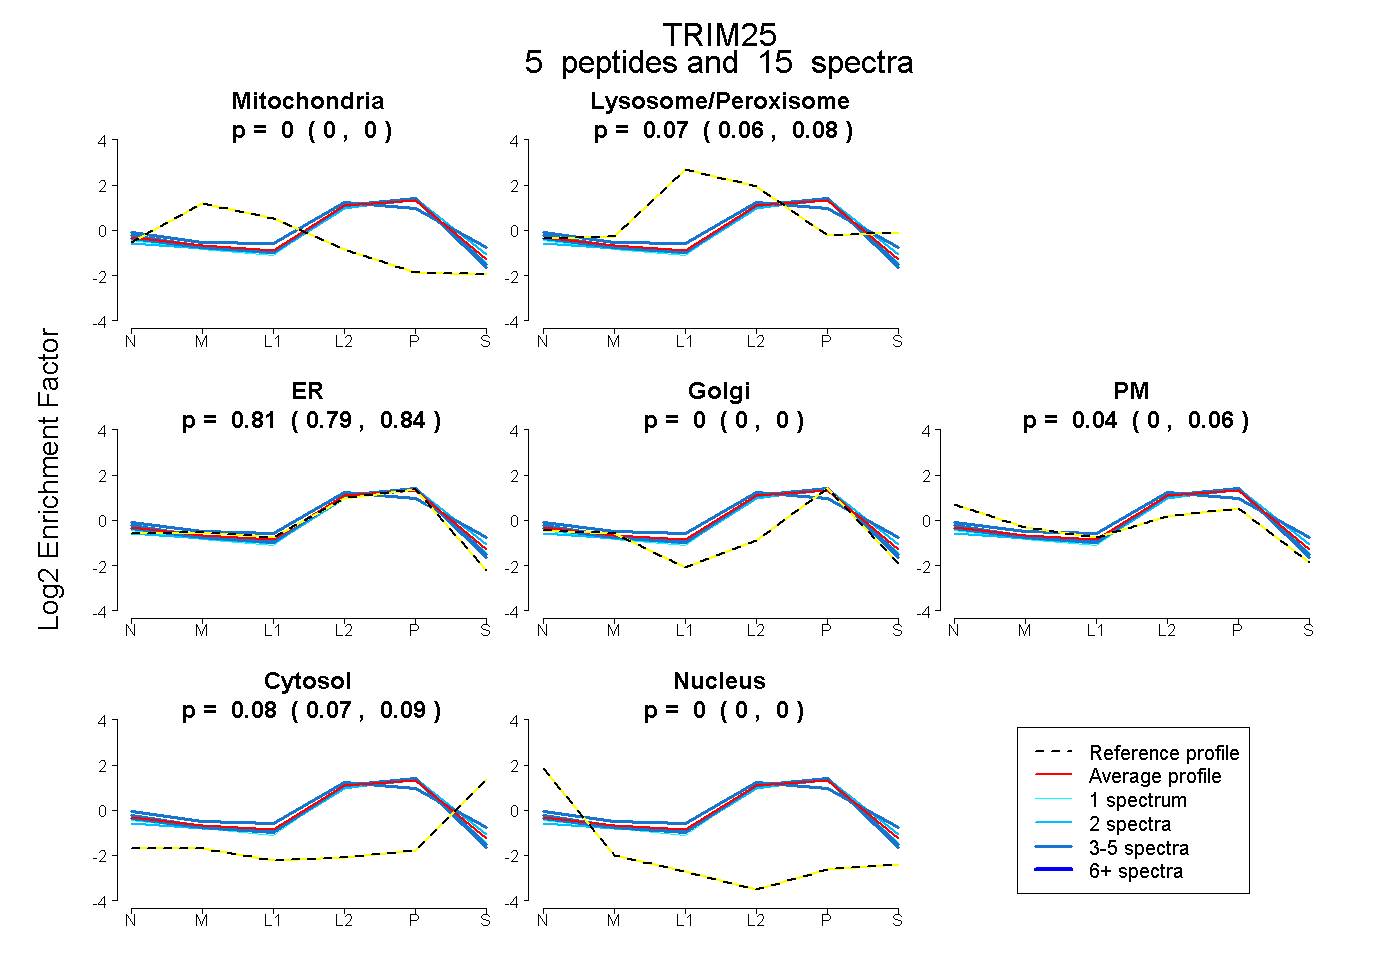 |
0.000 0.000 | 0.000 |
0.074 0.061 | 0.085 |
0.814 0.786 | 0.837 |
0.000 0.000 | 0.001 |
0.035 0.005 | 0.060 |
0.076 0.065 | 0.085 |
0.000 0.000 | 0.000 |
|||
| Plot | Lyso | Other | |||||||||||
| Expt C |
11 peptides |
75 spectra |
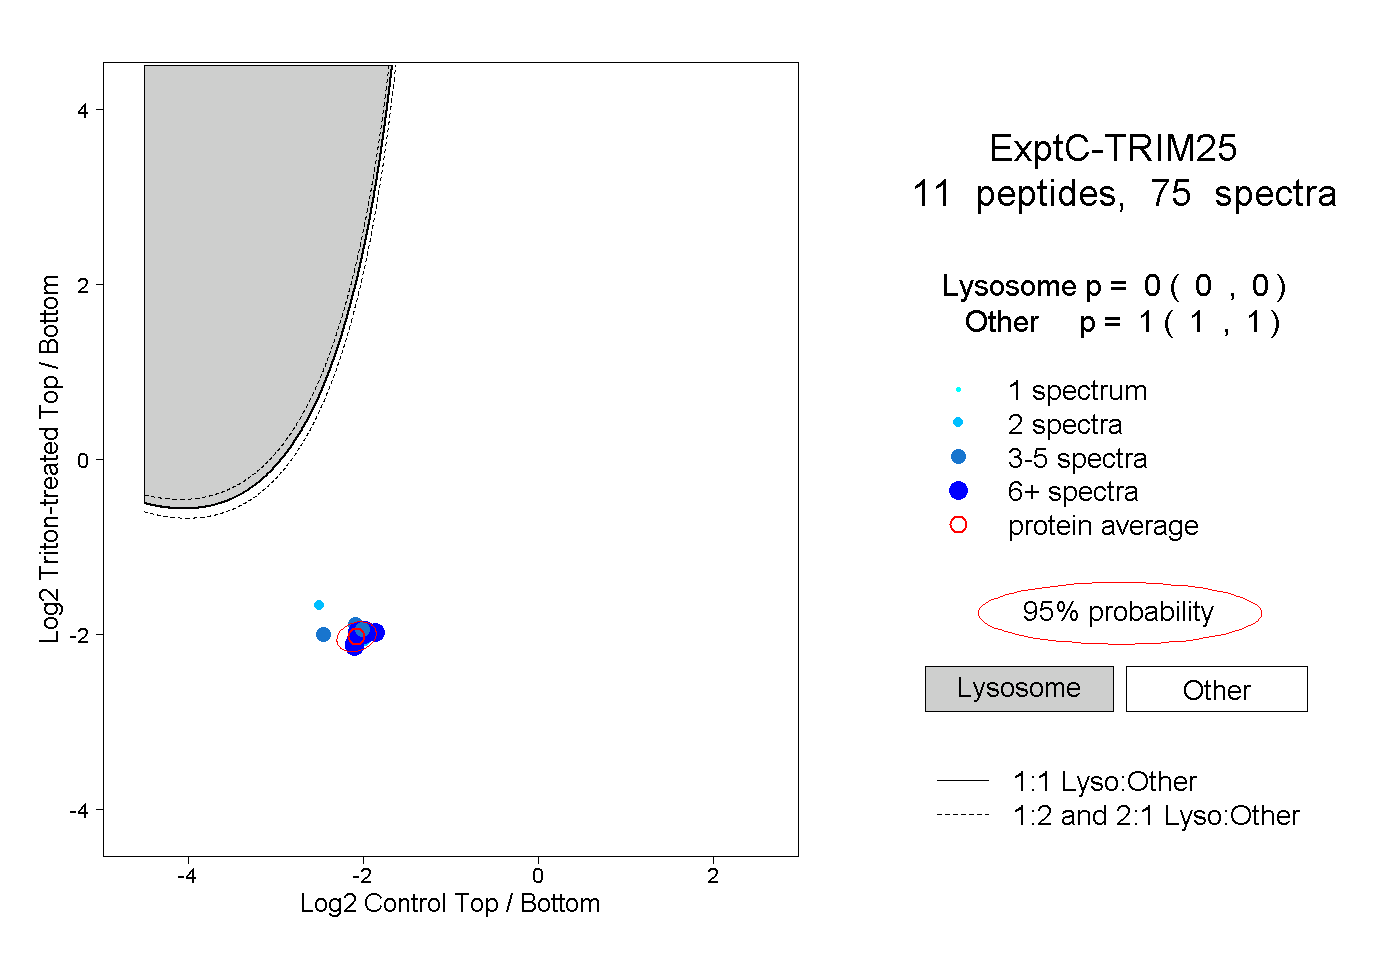 |
0.000 0.000 | 0.000 |
1.000 1.000 | 1.000 |
||||||||
| Plot | Lyso | Other | |||||||||||
| Expt D |
5 peptides |
7 spectra |
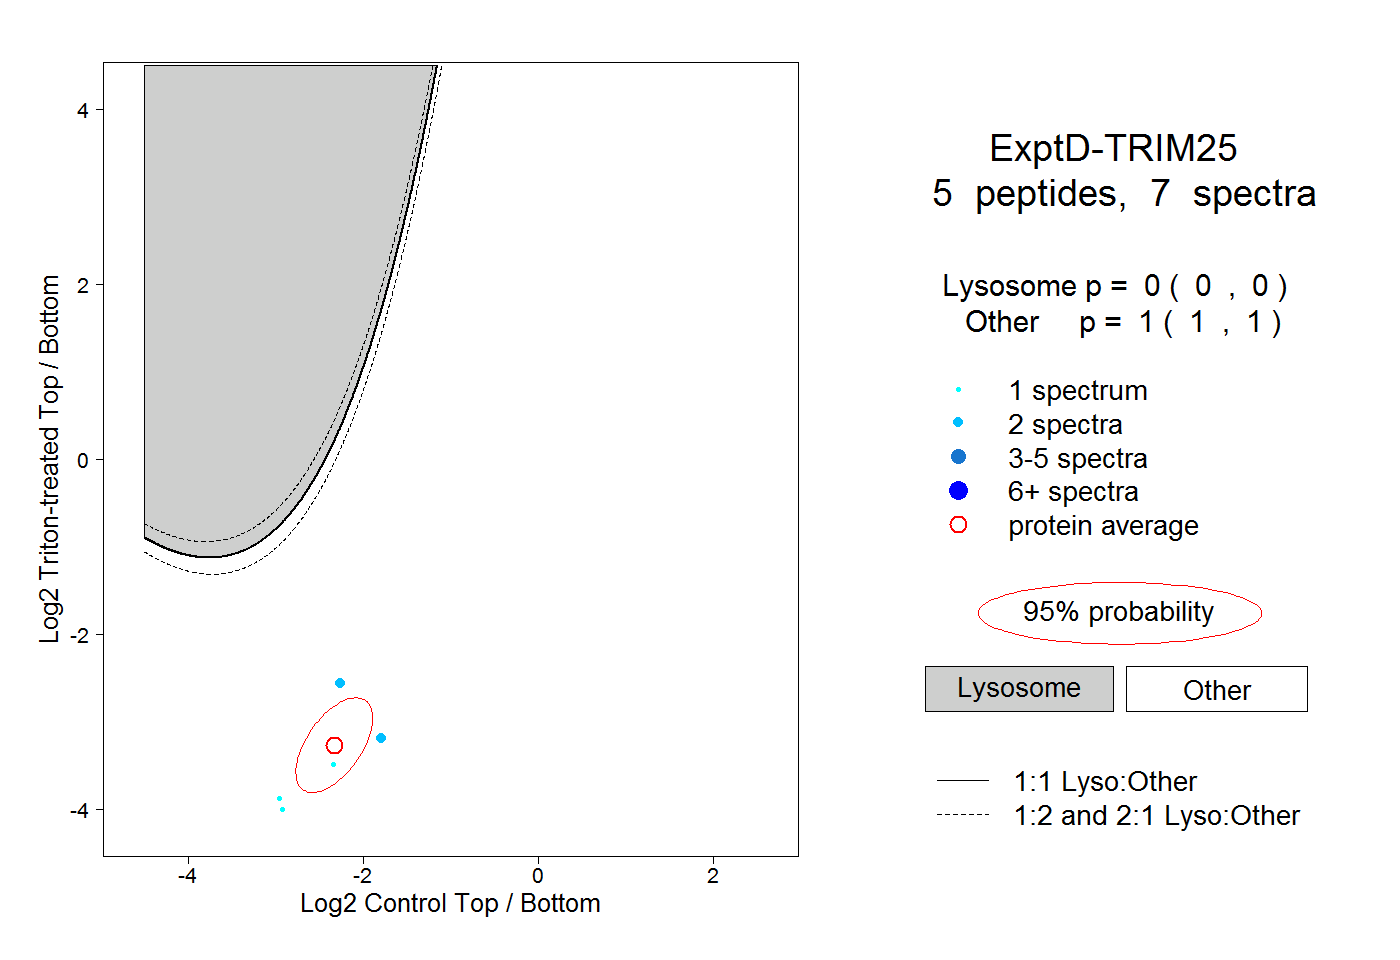 |
0.000 0.000 | 0.000 |
1.000 1.000 | 1.000 |