TRIM25
[ENSRNOP00000052533]
Main page
| | | Plot |
Mito |
Lyso |
|
Perox |
ER |
Golgi |
PM |
Cytosol |
Nucleus |
|
| Expt A |
 12
12
peptides |
36
spectra |
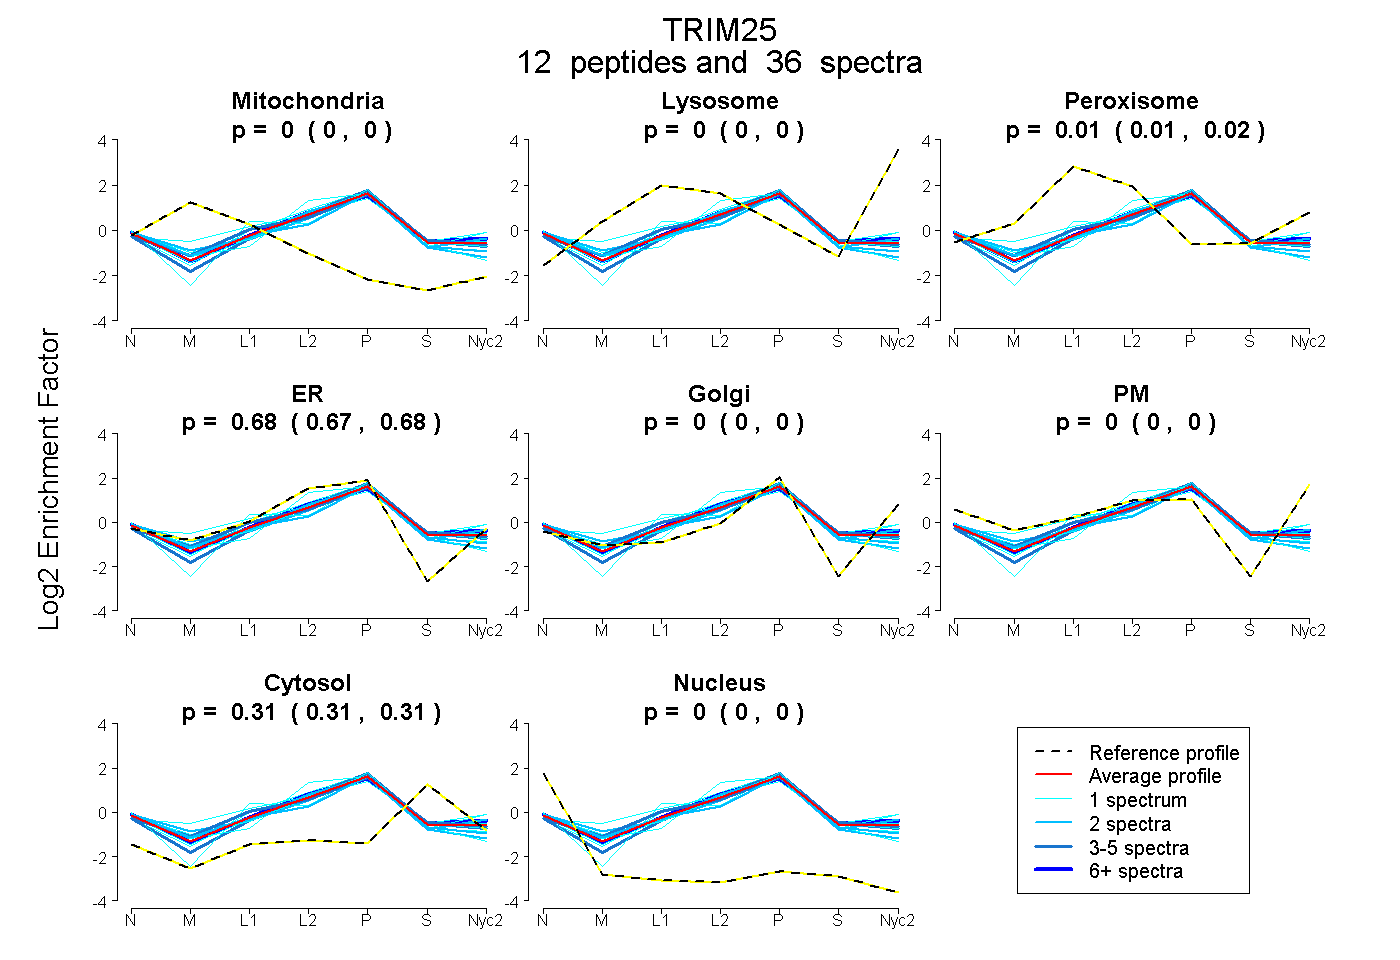 |
0.000
0.000 | 0.000 |
0.000
0.000 | 0.000 |
|
0.012
0.007 | 0.017 |
0.676
0.672 | 0.679 |
0.000
0.000 | 0.000 |
0.000
0.000 | 0.000 |
0.312
0.308 | 0.315 |
0.000
0.000 | 0.000 |
|
| | | Plot |
Mito |
|
Lyso or Perox |
|
ER |
Golgi |
PM |
Cytosol |
Nucleus |
|
| Expt B |
5
peptides |
15
spectra |
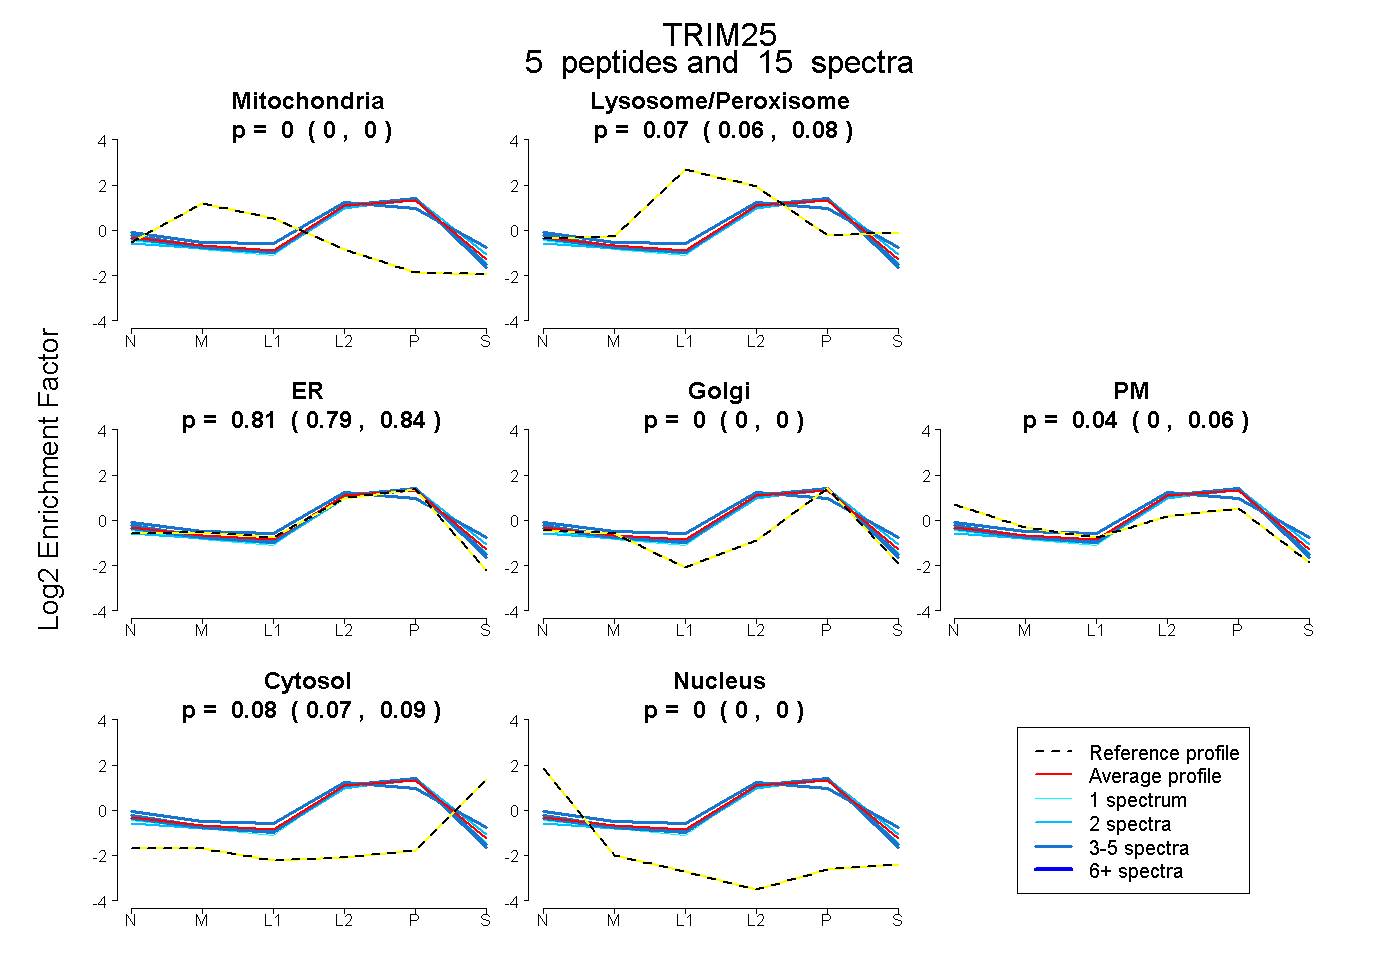 |
0.000
0.000 | 0.000 |
|
0.074
0.061 | 0.085 |
|
0.814
0.786 | 0.837 |
0.000
0.000 | 0.001 |
0.035
0.005 | 0.060 |
0.076
0.065 | 0.085 |
0.000
0.000 | 0.000 |
|
| 4 spectra, GDEFEFLEK |
0.000 |
|
0.017 |
|
0.830 |
0.000 |
0.117 |
0.036 |
0.000 |
|
| 1 spectrum, AEVELILAK |
0.000 |
|
0.002 |
|
0.919 |
0.000 |
0.000 |
0.079 |
0.000 |
|
| 3 spectra, IDLDHDLIK |
0.000 |
|
0.025 |
|
0.914 |
0.000 |
0.000 |
0.061 |
0.000 |
|
| 2 spectra, GVYQGALDLK |
0.000 |
|
0.046 |
|
0.827 |
0.000 |
0.000 |
0.126 |
0.000 |
|
| 5 spectra, LDTIYQVLLK |
0.000 |
|
0.203 |
|
0.535 |
0.000 |
0.171 |
0.092 |
0.000 |
|
| | | Plot |
|
Lyso |
|
|
|
|
|
|
|
Other |
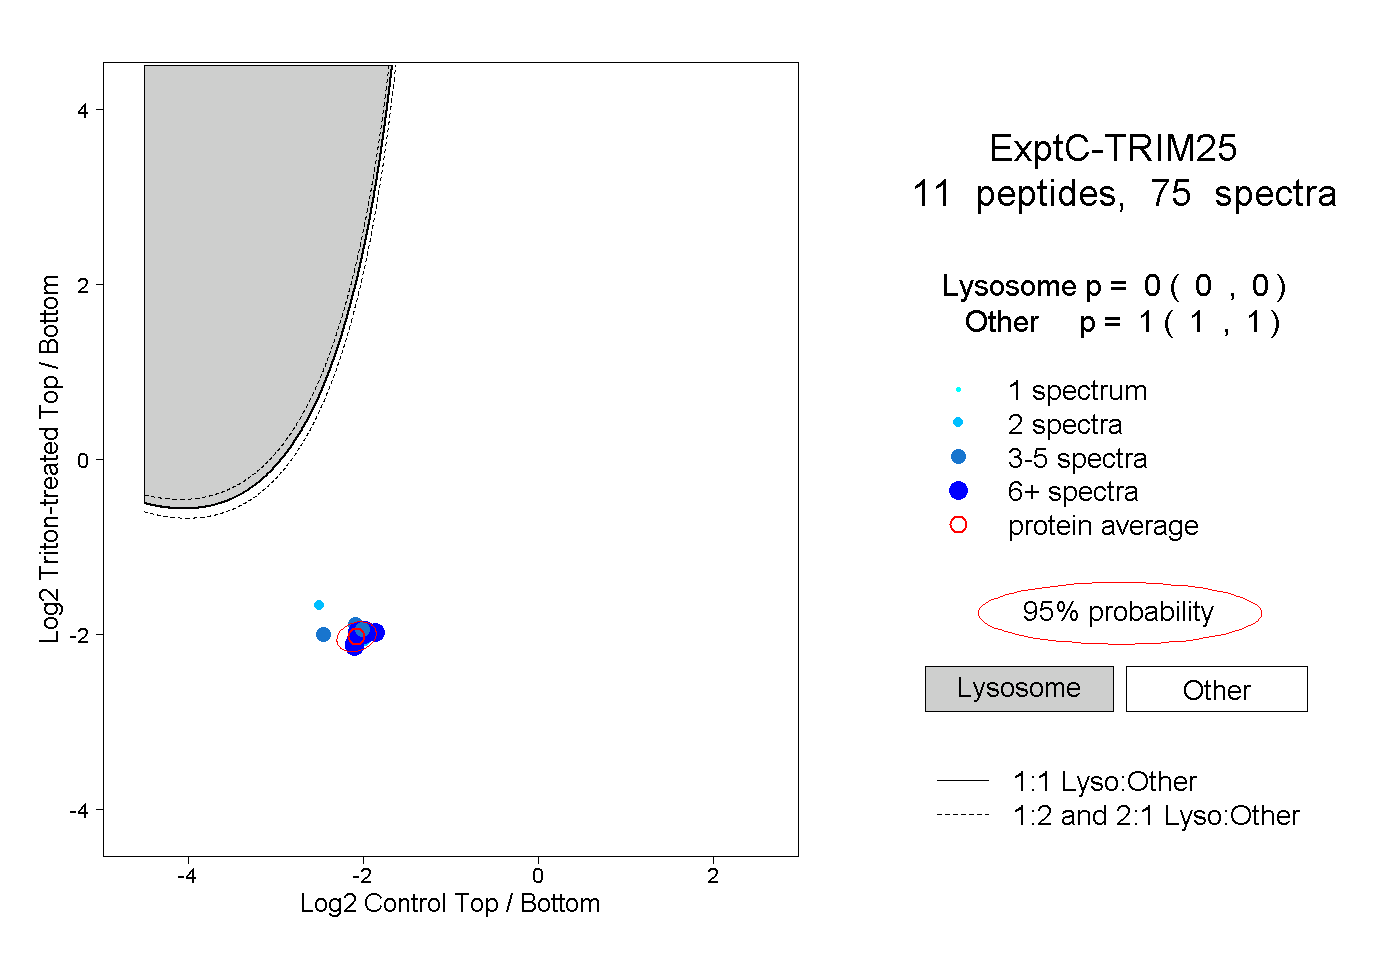
| Expt C |
11
peptides |
75
spectra |
 |
|
0.000
0.000 | 0.000 |
|
|
|
|
|
|
|
1.000
1.000 | 1.000 |
| | | Plot |
|
Lyso |
|
|
|
|
|
|
|
Other |
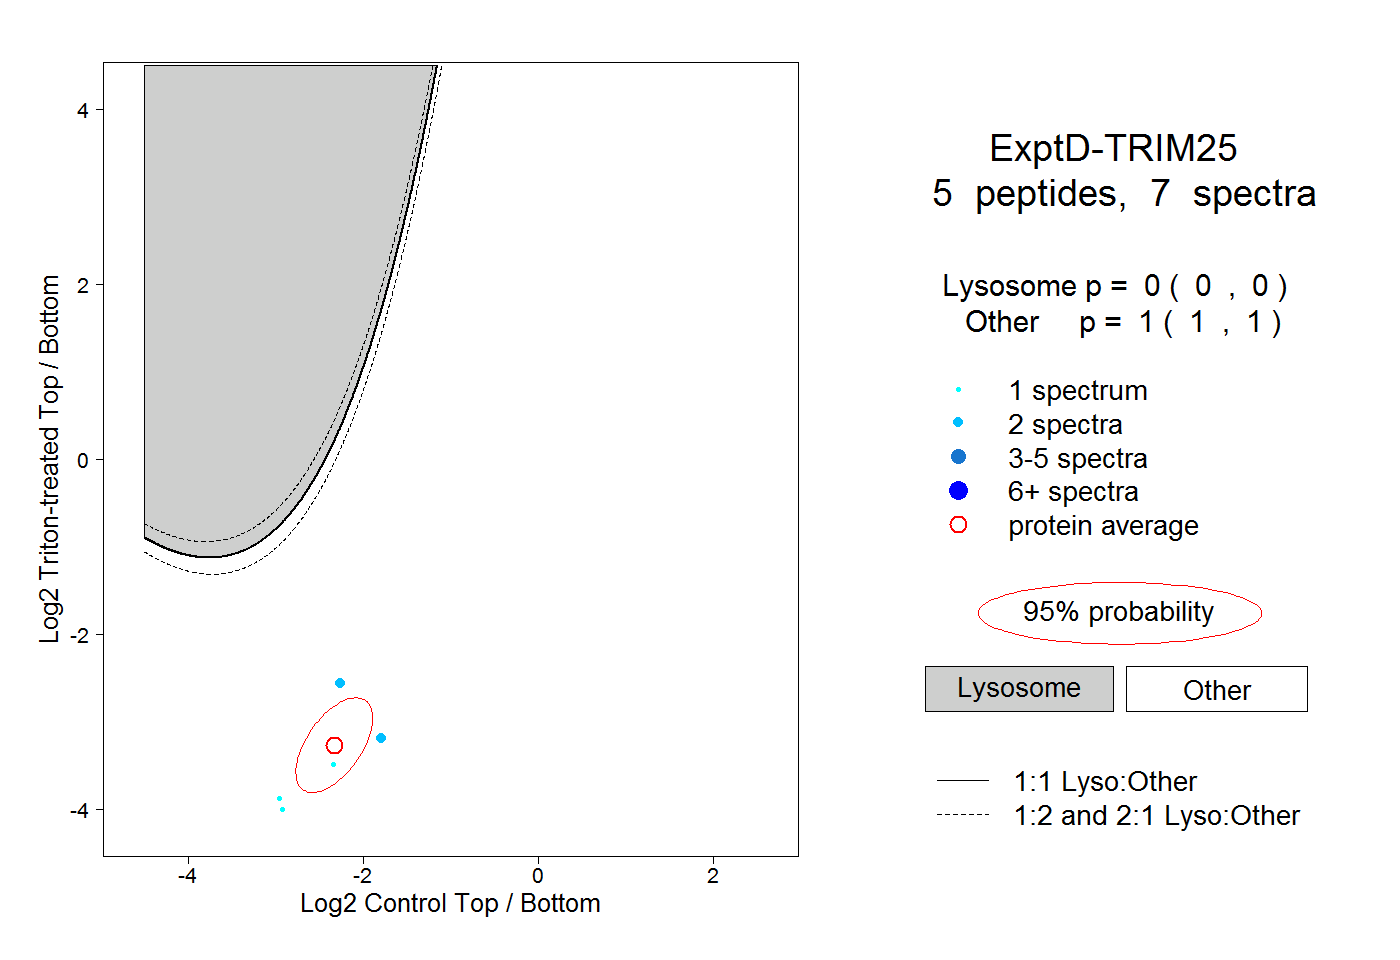
| Expt D |
5
peptides |
7
spectra |
 |
|
0.000
0.000 | 0.000 |
|
|
|
|
|
|
|
1.000
1.000 | 1.000 |