 16
16peptides
spectra
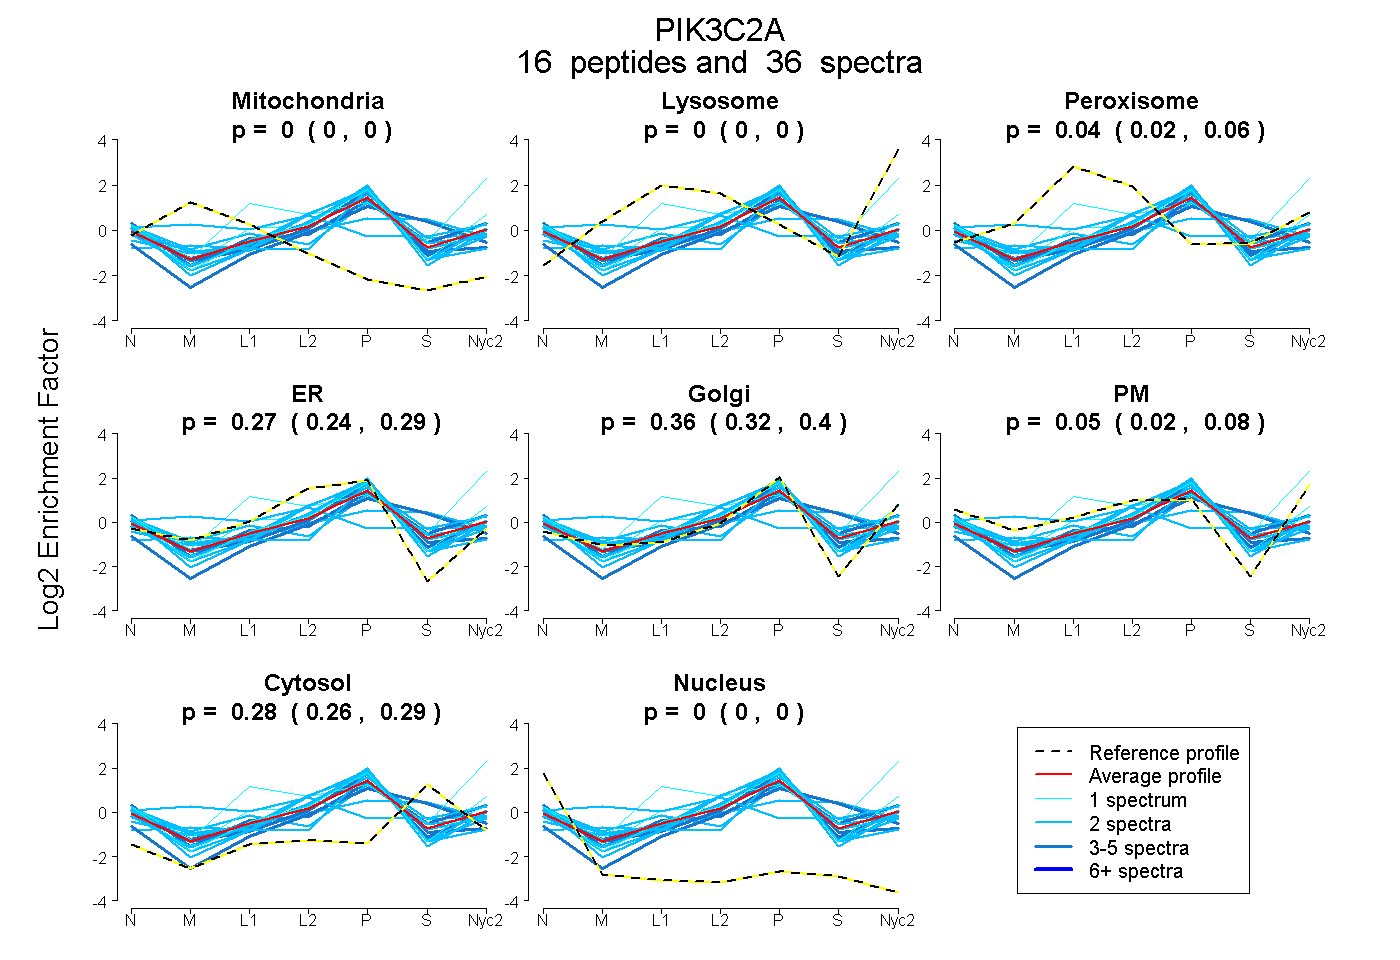
0.000 | 0.000
0.000 | 0.000
0.024 | 0.058
0.236 | 0.291
0.322 | 0.399
0.022 | 0.078
0.264 | 0.287
0.000 | 0.000
3peptides
spectra
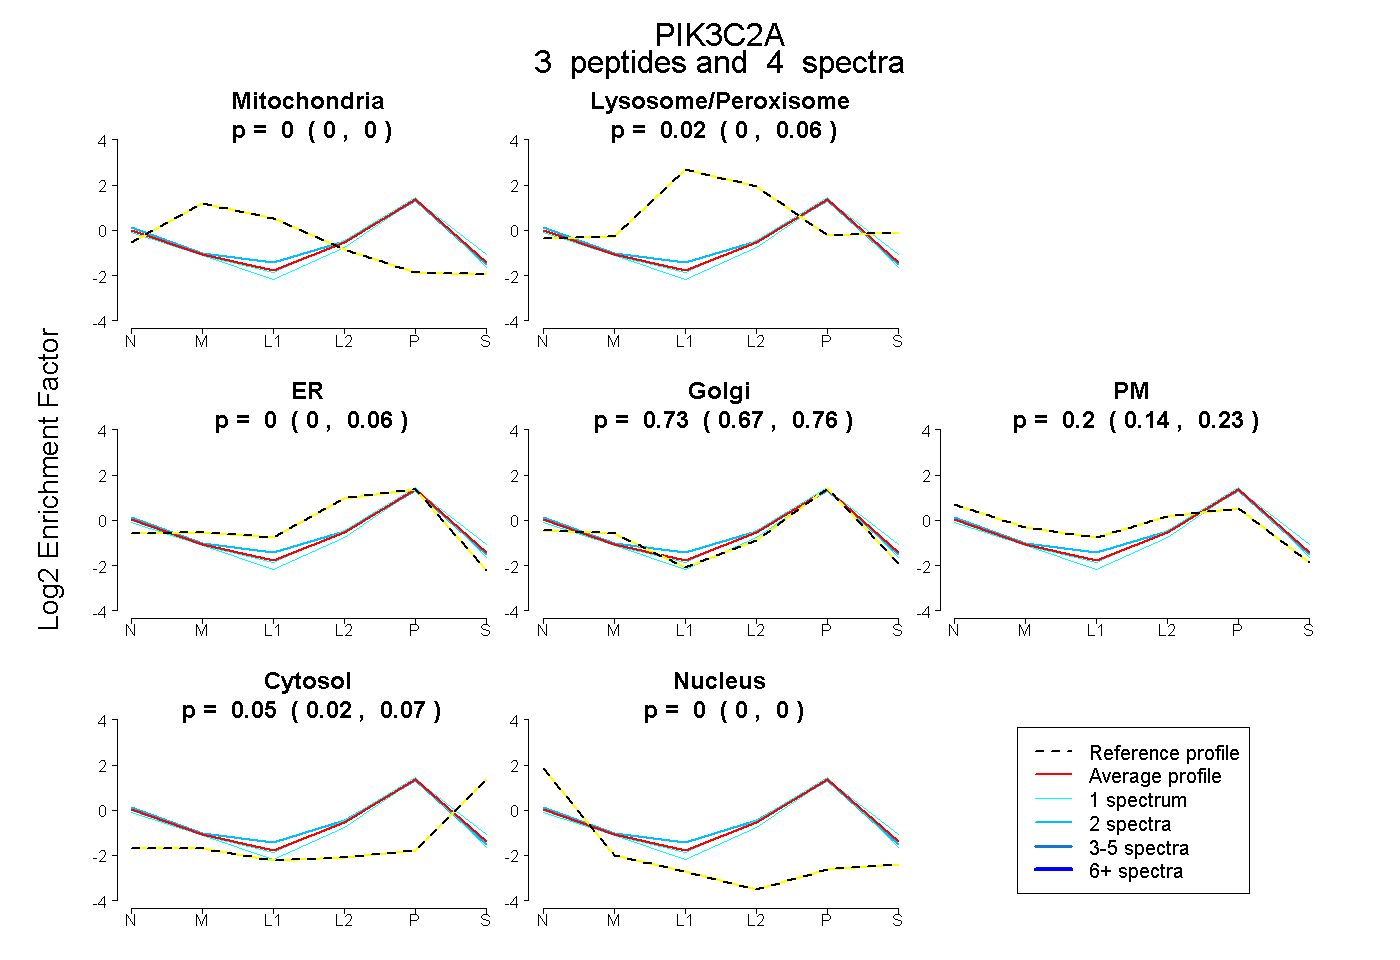
0.000 | 0.000
0.000 | 0.060
0.000 | 0.060
0.669 | 0.762
0.136 | 0.233
0.023 | 0.066
0.000 | 0.000
11peptides
spectra
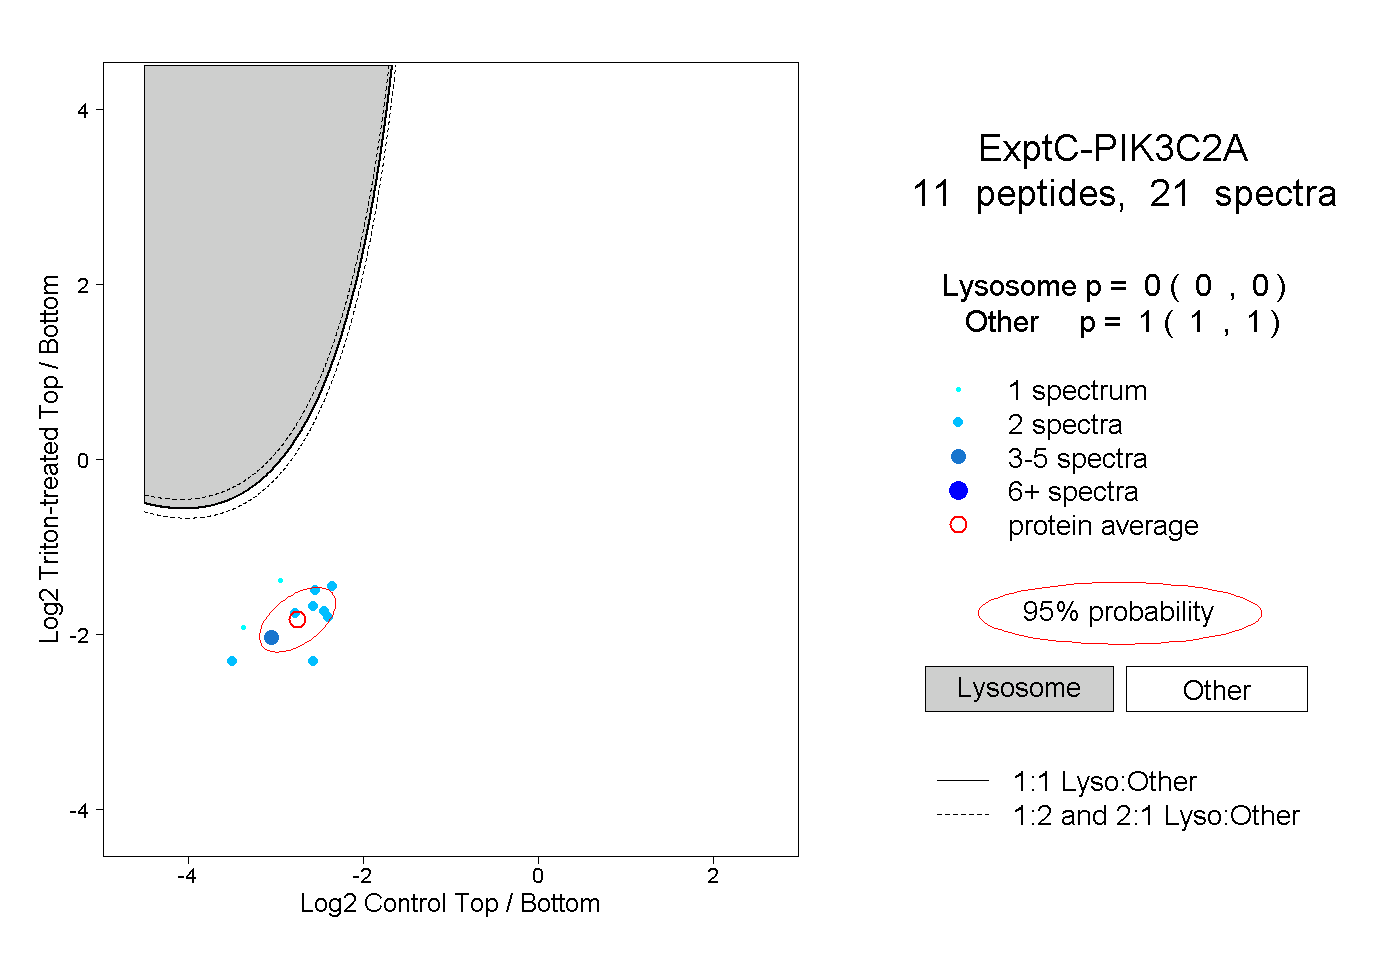
0.000 | 0.000
1.000 | 1.000
1peptide
spectrum
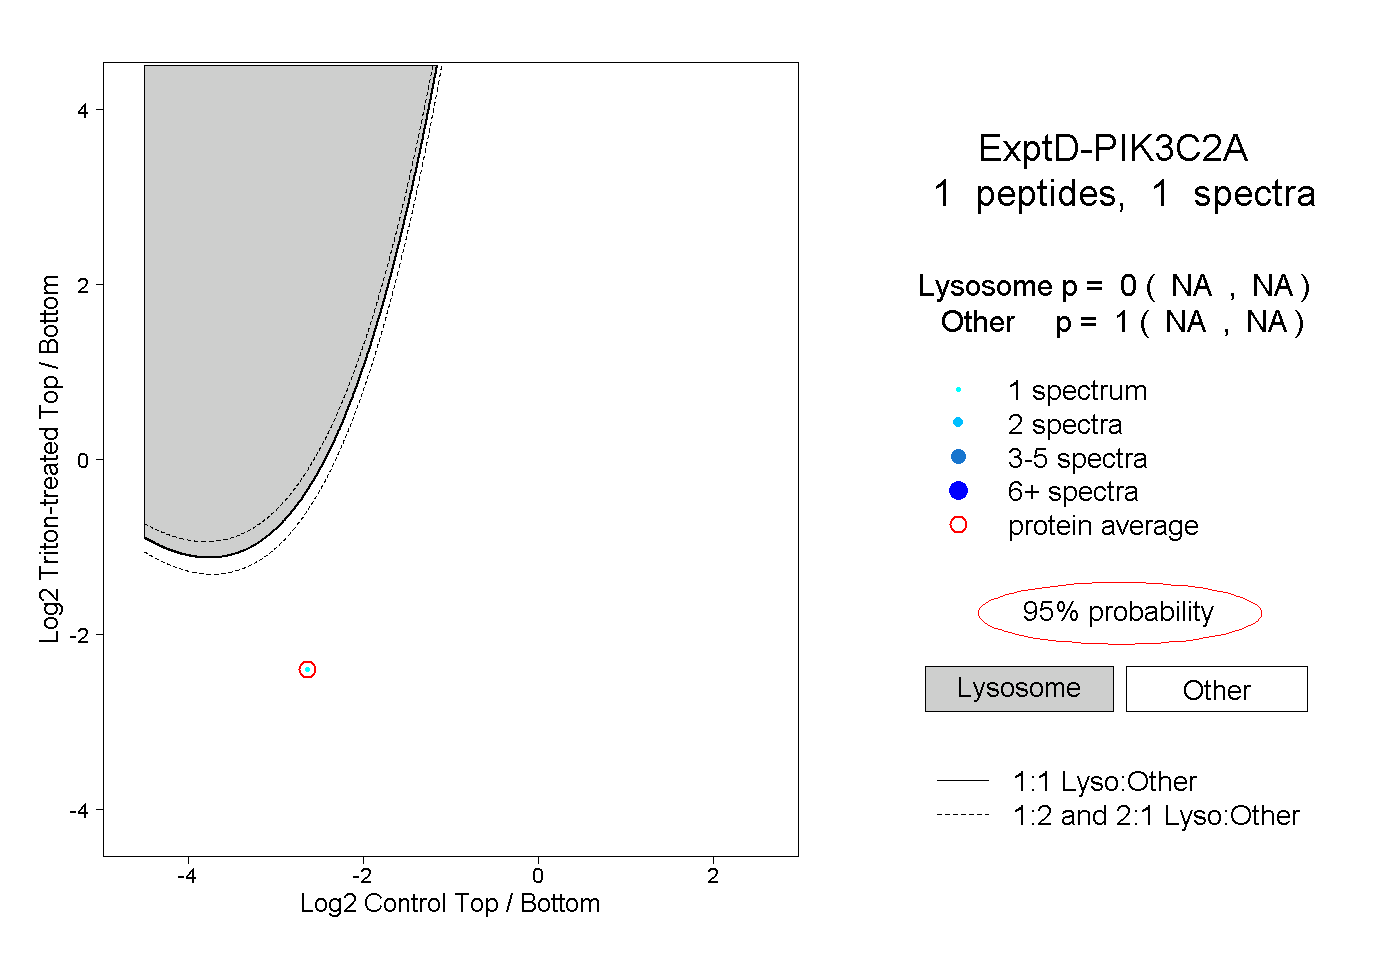
NA | NA
NA | NA