 16
16peptides
spectra
0.000 | 0.000
0.000 | 0.000
0.024 | 0.058
0.236 | 0.291
0.322 | 0.399
0.022 | 0.078
0.264 | 0.287
0.000 | 0.000
| Plot | Mito | Lyso | Perox | ER | Golgi | PM | Cytosol | Nucleus | |||||
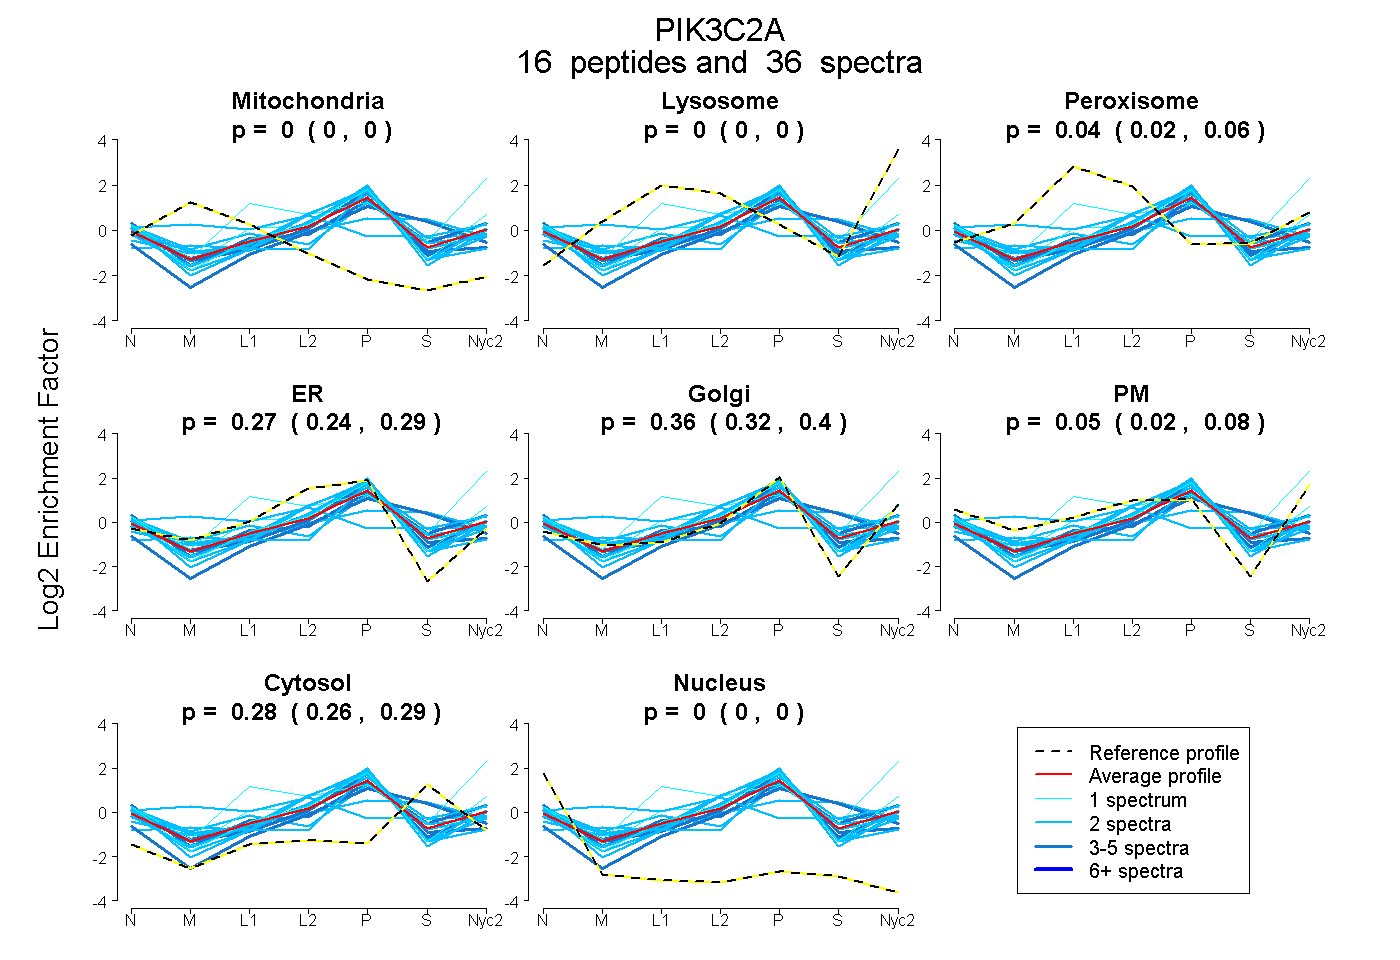
| Expt A |
16 peptides |
36 spectra |
|
0.000 0.000 | 0.000 |
0.000 0.000 | 0.000 |
0.042 0.024 | 0.058 |
0.265 0.236 | 0.291 |
0.364 0.322 | 0.399 |
0.052 0.022 | 0.078 |
0.277 0.264 | 0.287 |
0.000 0.000 | 0.000 |
| 1 spectrum, AVNLPR | 0.000 | 0.000 | 0.115 | 0.194 | 0.552 | 0.000 | 0.139 | 0.000 | ||
| 1 spectrum, SADVTSLSGGDTSK | 0.000 | 0.337 | 0.016 | 0.000 | 0.000 | 0.490 | 0.157 | 0.000 | ||
| 2 spectra, FADQEVR | 0.000 | 0.000 | 0.167 | 0.105 | 0.246 | 0.000 | 0.483 | 0.000 | ||
| 2 spectra, WADIAK | 0.122 | 0.000 | 0.289 | 0.000 | 0.000 | 0.332 | 0.258 | 0.000 | ||
| 2 spectra, LVQLLGGVAEK | 0.000 | 0.000 | 0.000 | 0.465 | 0.242 | 0.119 | 0.173 | 0.000 | ||
| 2 spectra, AQSQVSQK | 0.000 | 0.000 | 0.178 | 0.000 | 0.543 | 0.000 | 0.230 | 0.049 | ||
| 1 spectrum, YNPSEEEYEK | 0.000 | 0.000 | 0.000 | 0.107 | 0.491 | 0.235 | 0.168 | 0.000 | ||
| 2 spectra, SQSLIVR | 0.000 | 0.000 | 0.000 | 0.000 | 0.688 | 0.000 | 0.285 | 0.028 | ||
| 3 spectra, DKPLAEWLR | 0.000 | 0.000 | 0.000 | 0.548 | 0.175 | 0.000 | 0.277 | 0.000 | ||
| 2 spectra, VQSFFLR | 0.000 | 0.000 | 0.000 | 0.486 | 0.378 | 0.000 | 0.136 | 0.000 | ||
| 2 spectra, AFLWEK | 0.000 | 0.000 | 0.017 | 0.274 | 0.379 | 0.000 | 0.329 | 0.000 | ||
| 4 spectra, LEALENEIK | 0.000 | 0.000 | 0.000 | 0.250 | 0.533 | 0.000 | 0.218 | 0.000 | ||
| 2 spectra, SSTVCPQGSR | 0.000 | 0.000 | 0.000 | 0.537 | 0.195 | 0.000 | 0.200 | 0.068 | ||
| 2 spectra, TFDEFQELHNK | 0.000 | 0.000 | 0.000 | 0.417 | 0.384 | 0.000 | 0.199 | 0.000 | ||
| 3 spectra, LLDIVHR | 0.000 | 0.000 | 0.000 | 0.255 | 0.173 | 0.000 | 0.572 | 0.000 | ||
| 5 spectra, ALDIDVEK | 0.000 | 0.000 | 0.010 | 0.070 | 0.336 | 0.261 | 0.324 | 0.000 |
| Plot | Mito | Lyso or Perox | ER | Golgi | PM | Cytosol | Nucleus | ||||||
| Expt B |
3 peptides |
4 spectra |
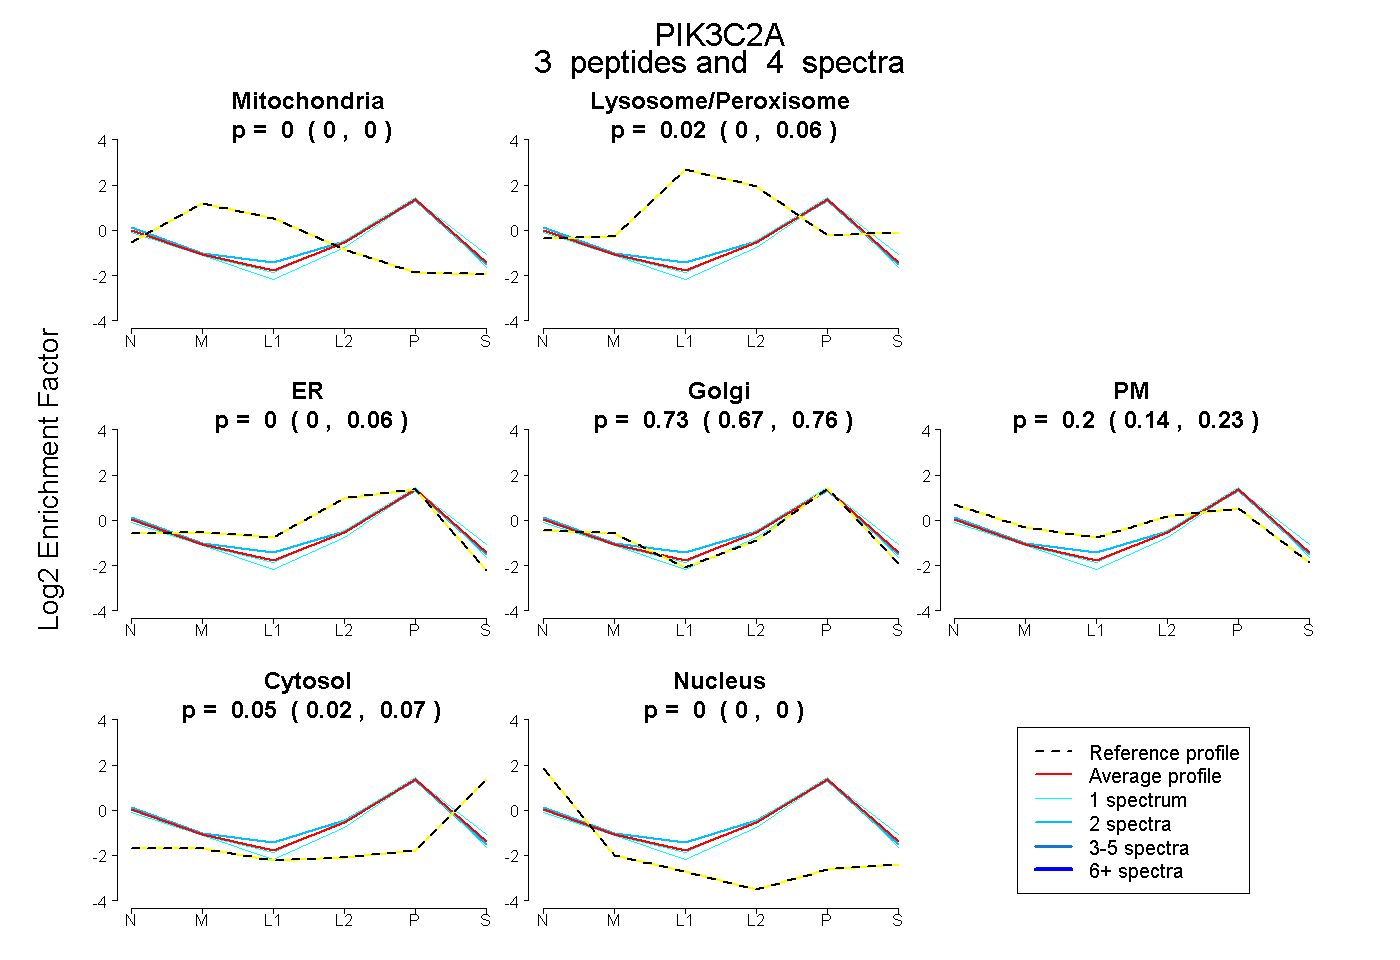 |
0.000 0.000 | 0.000 |
0.025 0.000 | 0.060 |
0.000 0.000 | 0.060 |
0.734 0.669 | 0.762 |
0.195 0.136 | 0.233 |
0.046 0.023 | 0.066 |
0.000 0.000 | 0.000 |
|||
| Plot | Lyso | Other | |||||||||||
| Expt C |
11 peptides |
21 spectra |
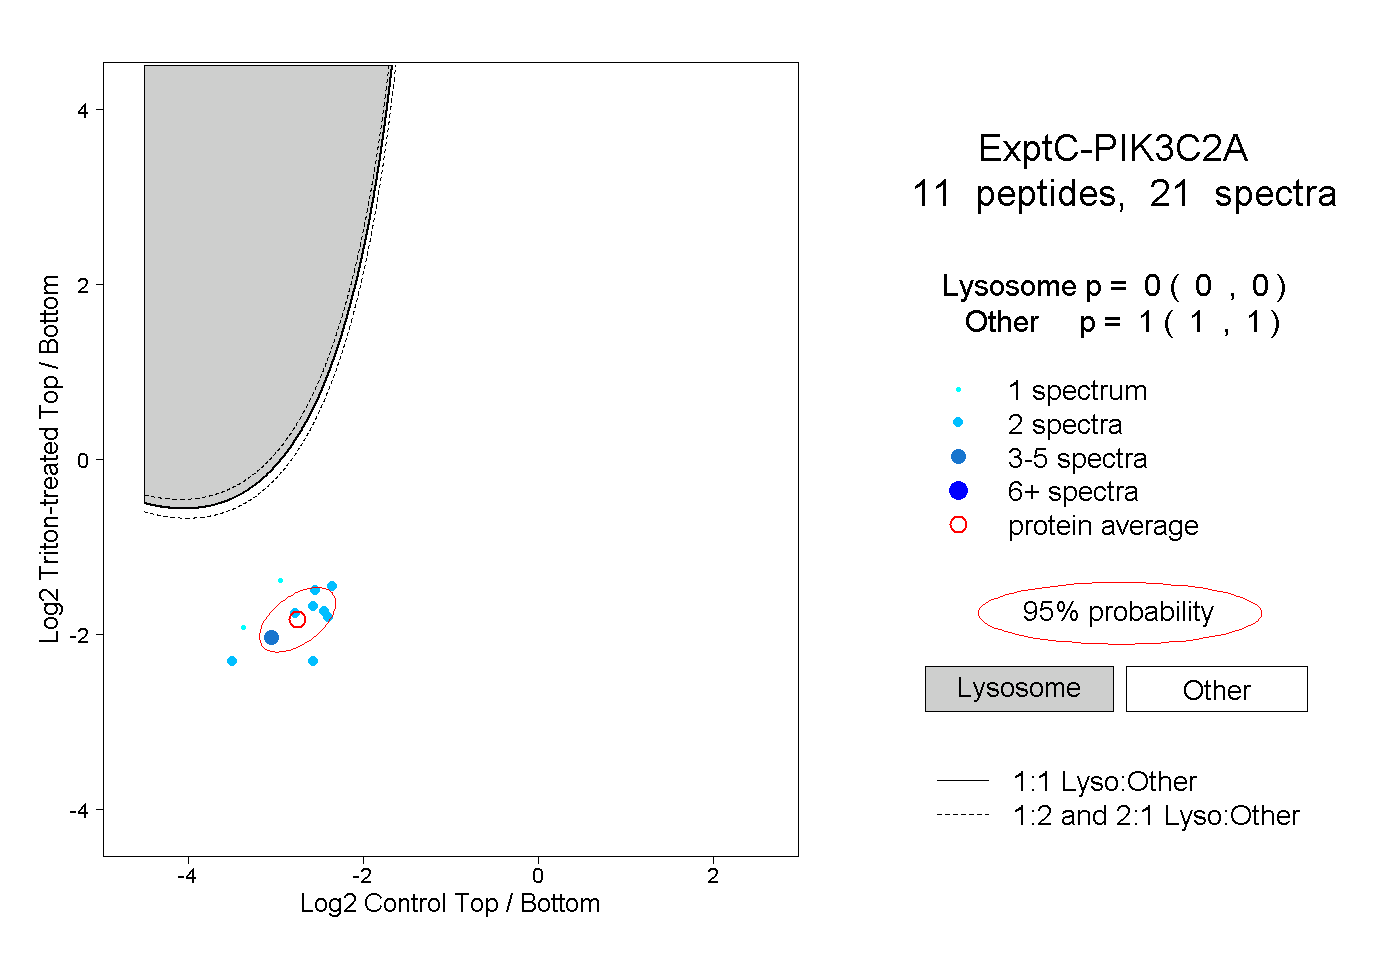 |
0.000 0.000 | 0.000 |
1.000 1.000 | 1.000 |
||||||||
| Plot | Lyso | Other | |||||||||||
| Expt D |
1 peptide |
1 spectrum |
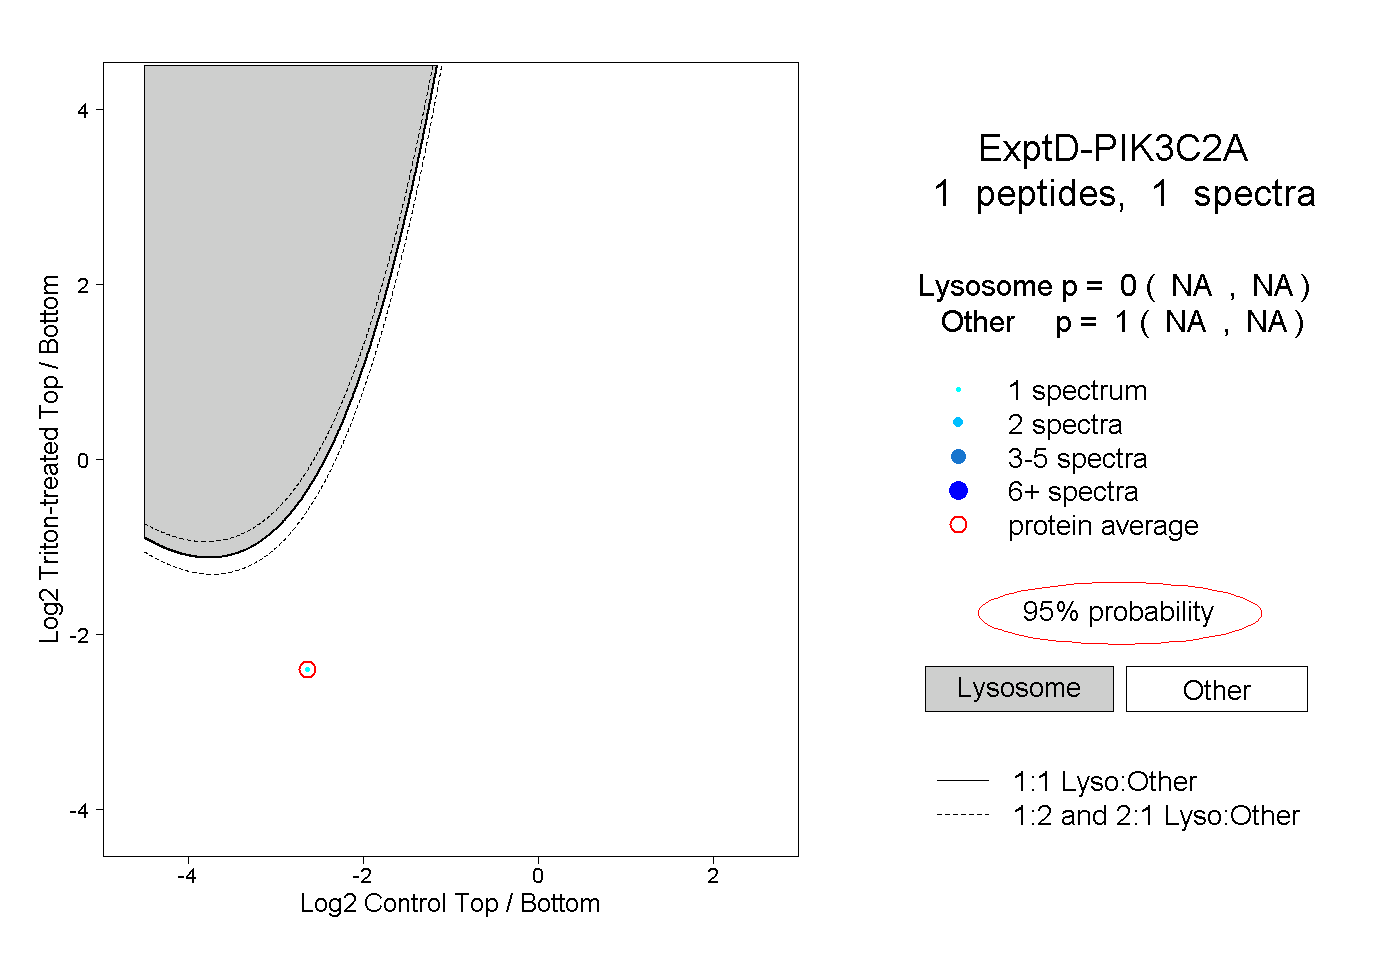 |
0.000 NA | NA |
1.000 NA | NA |