PIK3C2A
[ENSRNOP00000051993]
Main page
| | | Plot |
Mito |
Lyso |
|
Perox |
ER |
Golgi |
PM |
Cytosol |
Nucleus |
|
| Expt A |
 16
16
peptides |
36
spectra |
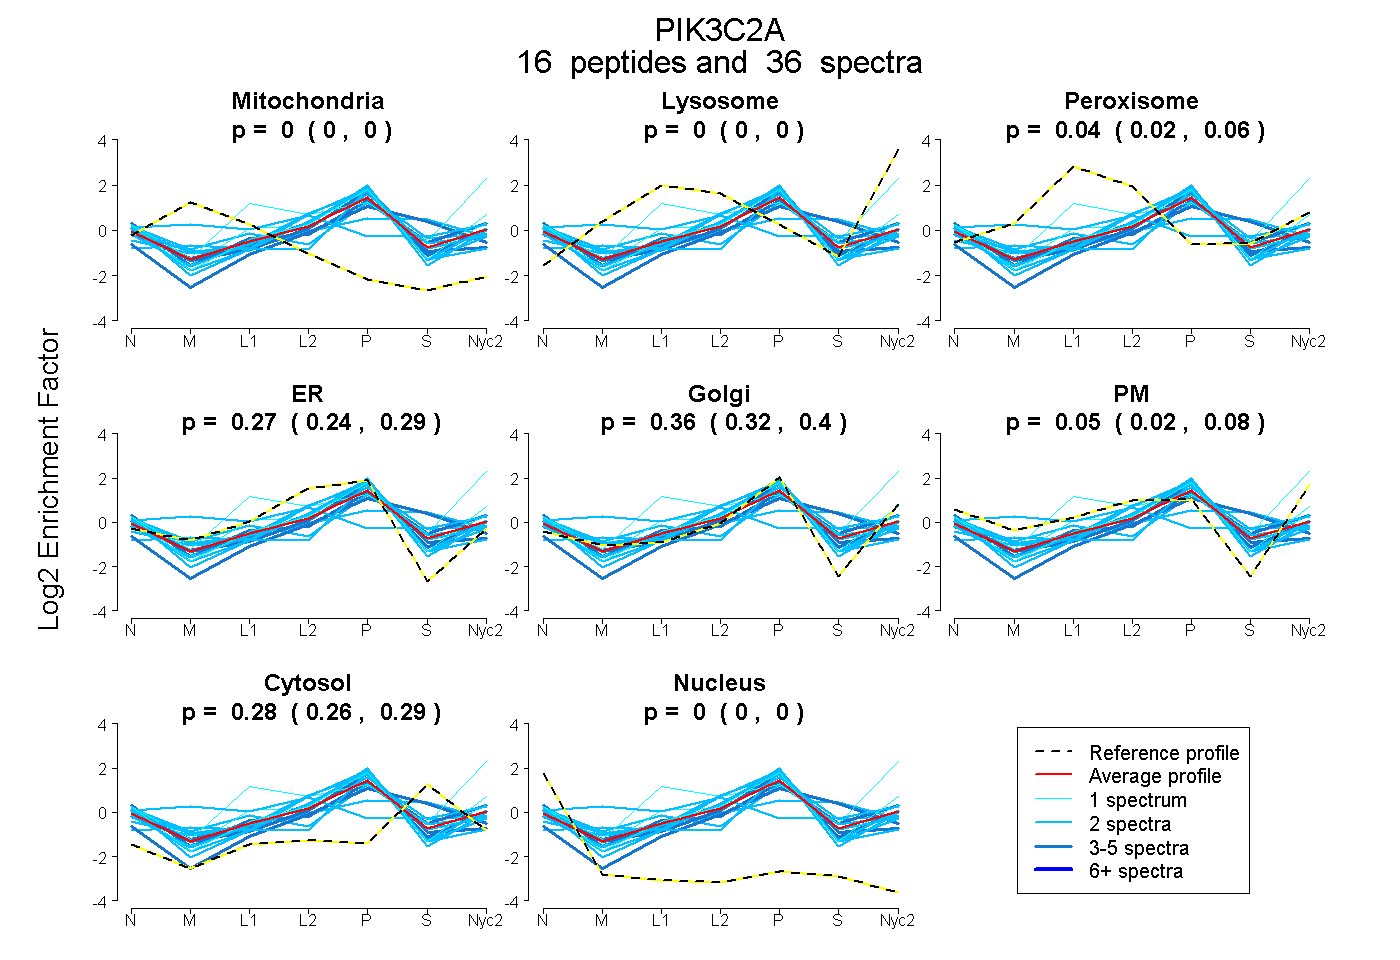 |
0.000
0.000 | 0.000 |
0.000
0.000 | 0.000 |
|
0.042
0.024 | 0.058 |
0.265
0.236 | 0.291 |
0.364
0.322 | 0.399 |
0.052
0.022 | 0.078 |
0.277
0.264 | 0.287 |
0.000
0.000 | 0.000 |
|
| | | Plot |
Mito |
|
Lyso or Perox |
|
ER |
Golgi |
PM |
Cytosol |
Nucleus |
|
| Expt B |
3
peptides |
4
spectra |
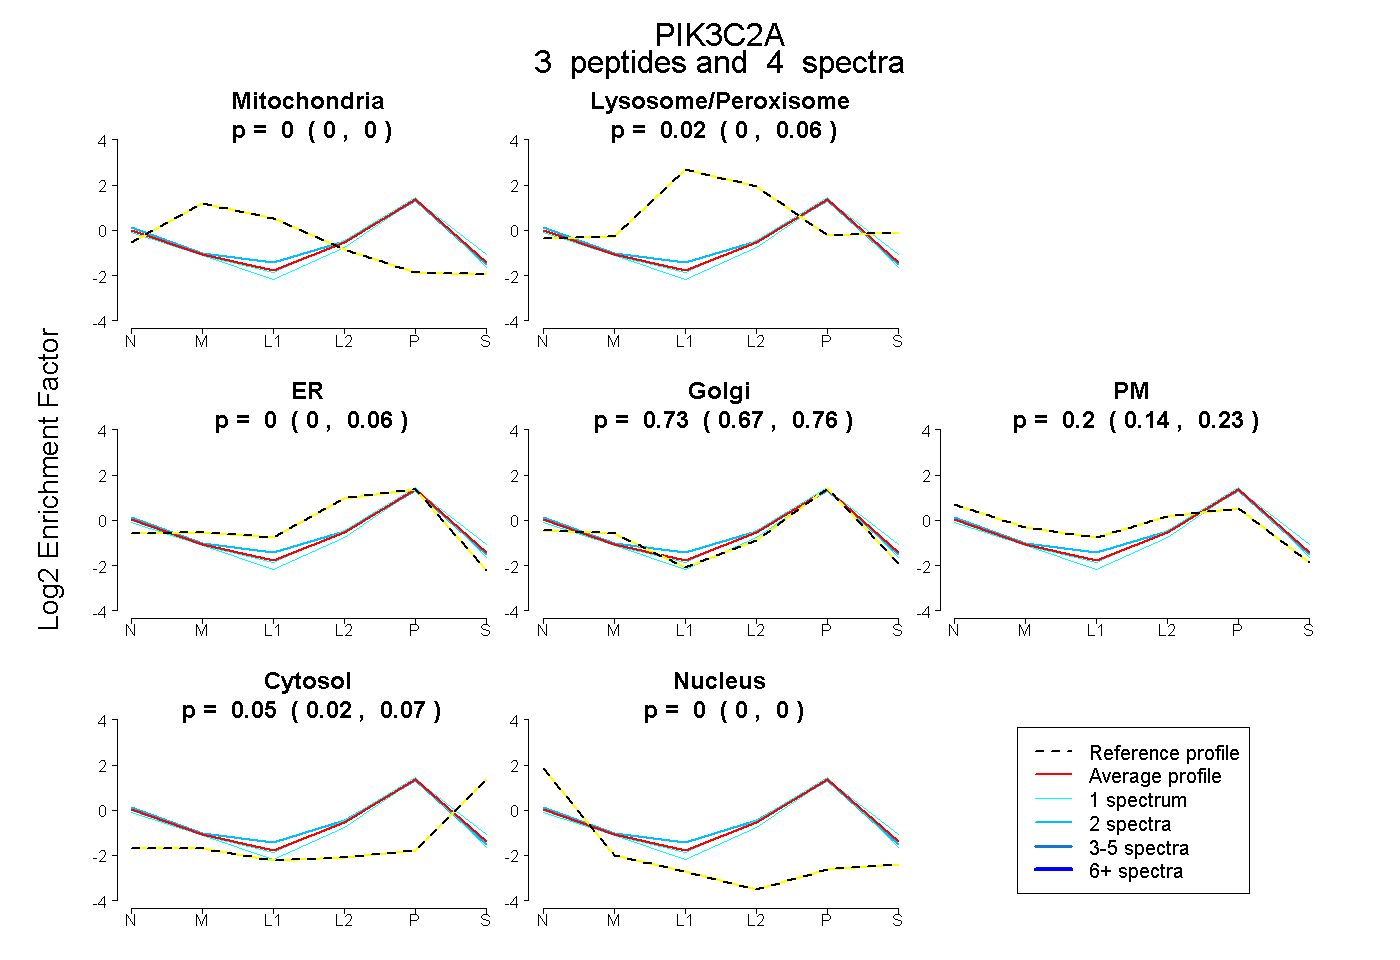 |
0.000
0.000 | 0.000 |
|
0.025
0.000 | 0.060 |
|
0.000
0.000 | 0.060 |
0.734
0.669 | 0.762 |
0.195
0.136 | 0.233 |
0.046
0.023 | 0.066 |
0.000
0.000 | 0.000 |
|
| 1 spectrum, LLDIVHR |
0.000 |
|
0.000 |
|
0.000 |
0.791 |
0.090 |
0.119 |
0.000 |
|
| 1 spectrum, VQSFFLR |
0.000 |
|
0.000 |
|
0.082 |
0.723 |
0.172 |
0.022 |
0.000 |
|
| 2 spectra, LVQLLGGVAEK |
0.000 |
|
0.074 |
|
0.000 |
0.689 |
0.222 |
0.004 |
0.011 |
|
| | | Plot |
|
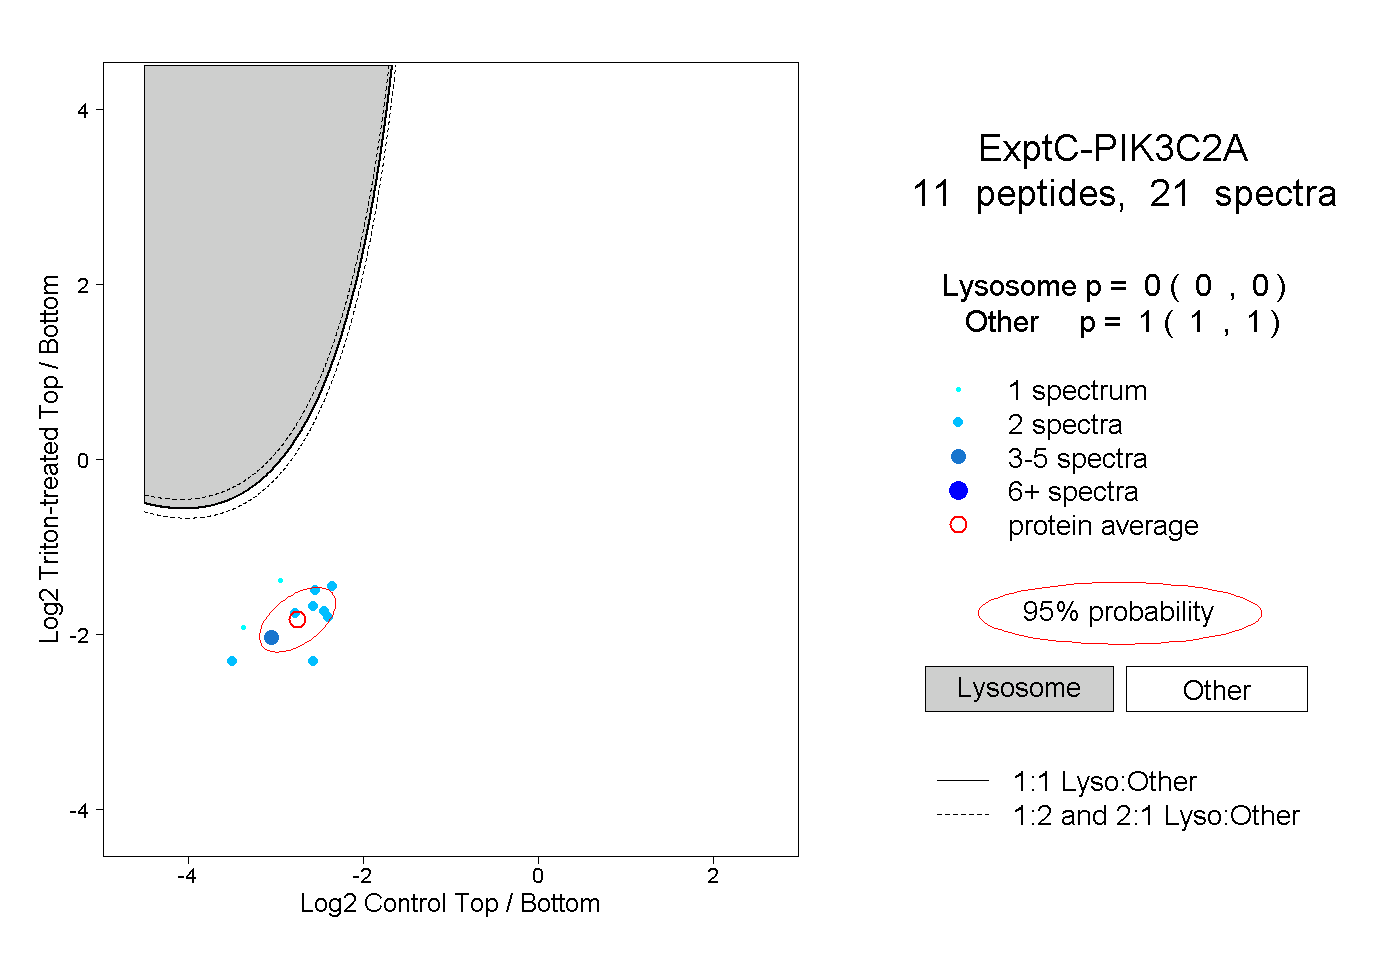
Lyso |
|
|
|
|
|
|
|
Other |
| Expt C |
11
peptides |
21
spectra |
 |
|
0.000
0.000 | 0.000 |
|
|
|
|
|
|
|
1.000
1.000 | 1.000 |
| | | Plot |
|
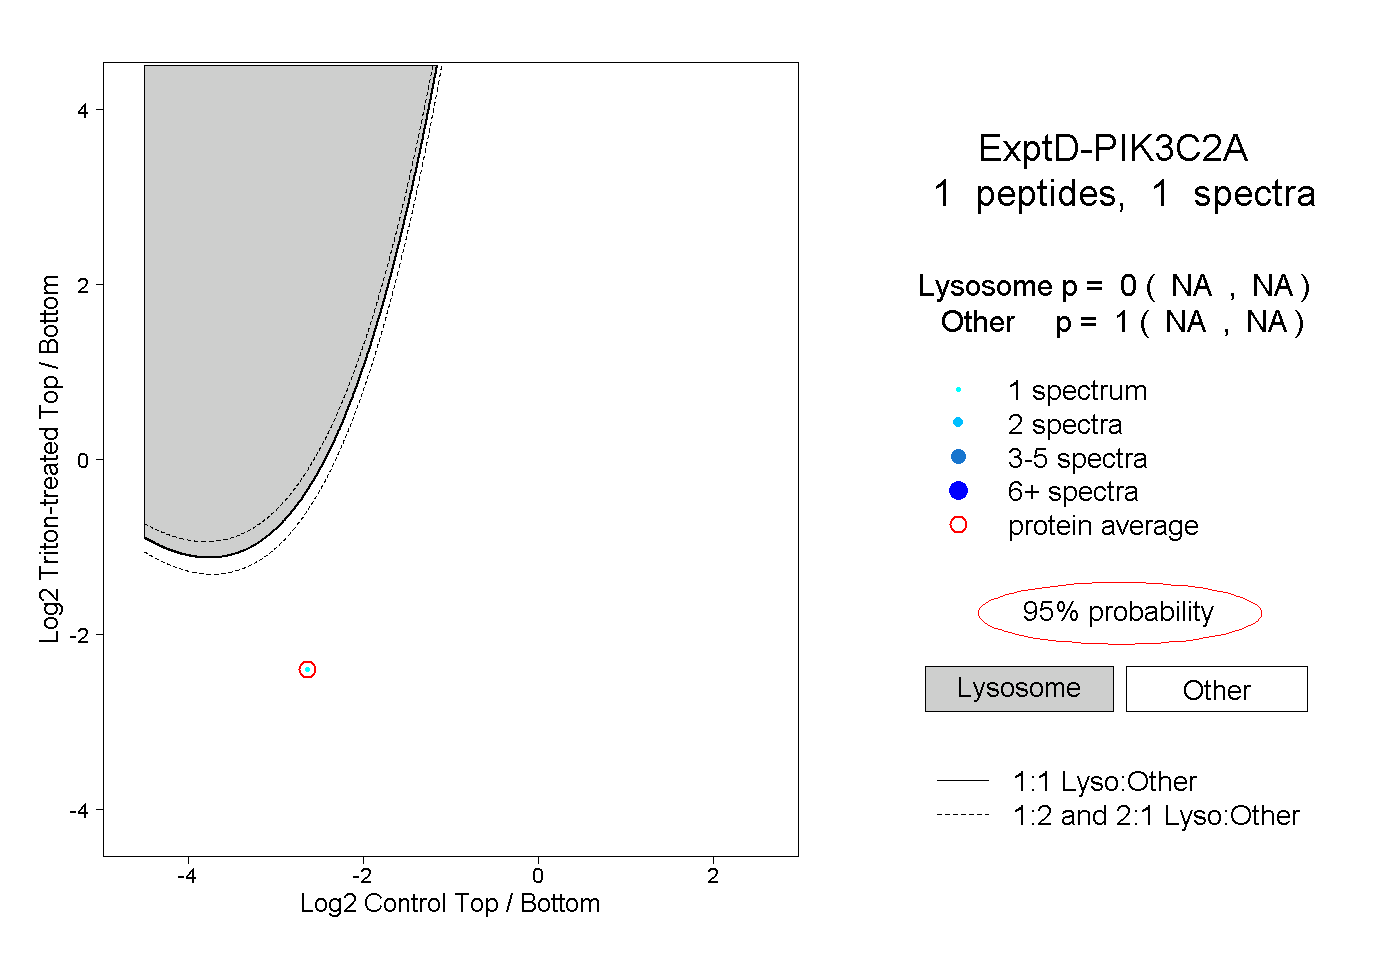
Lyso |
|
|
|
|
|
|
|
Other |
| Expt D |
1
peptide |
1
spectrum |
 |
|
0.000
NA | NA |
|
|
|
|
|
|
|
1.000
NA | NA |