 8
8peptides
spectra
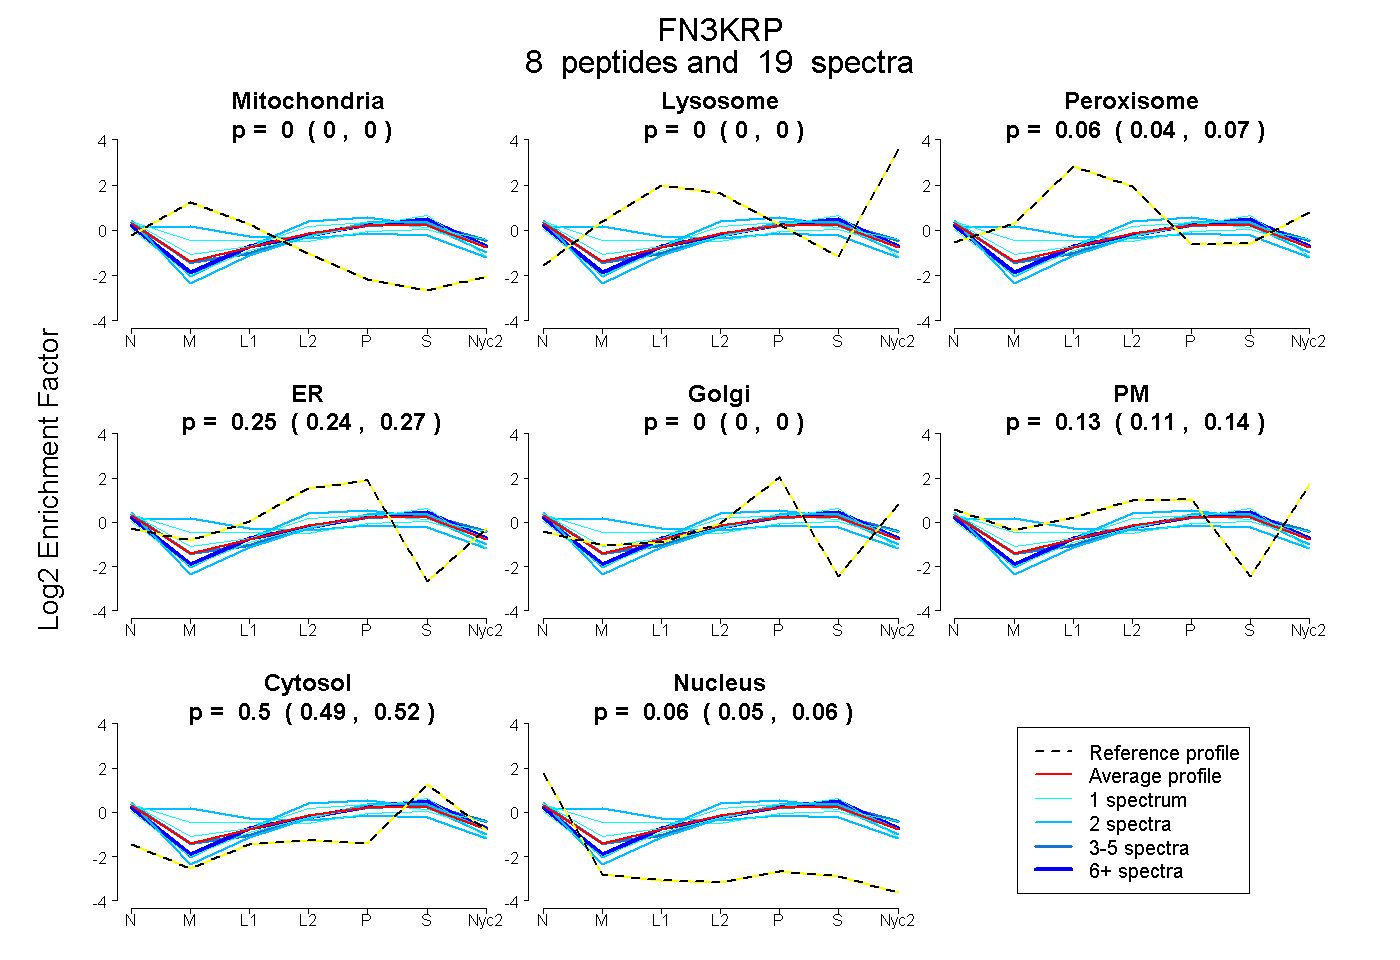
0.000 | 0.000
0.000 | 0.000
0.041 | 0.073
0.236 | 0.268
0.000 | 0.000
0.106 | 0.144
0.490 | 0.516
0.051 | 0.064
5peptides
spectra
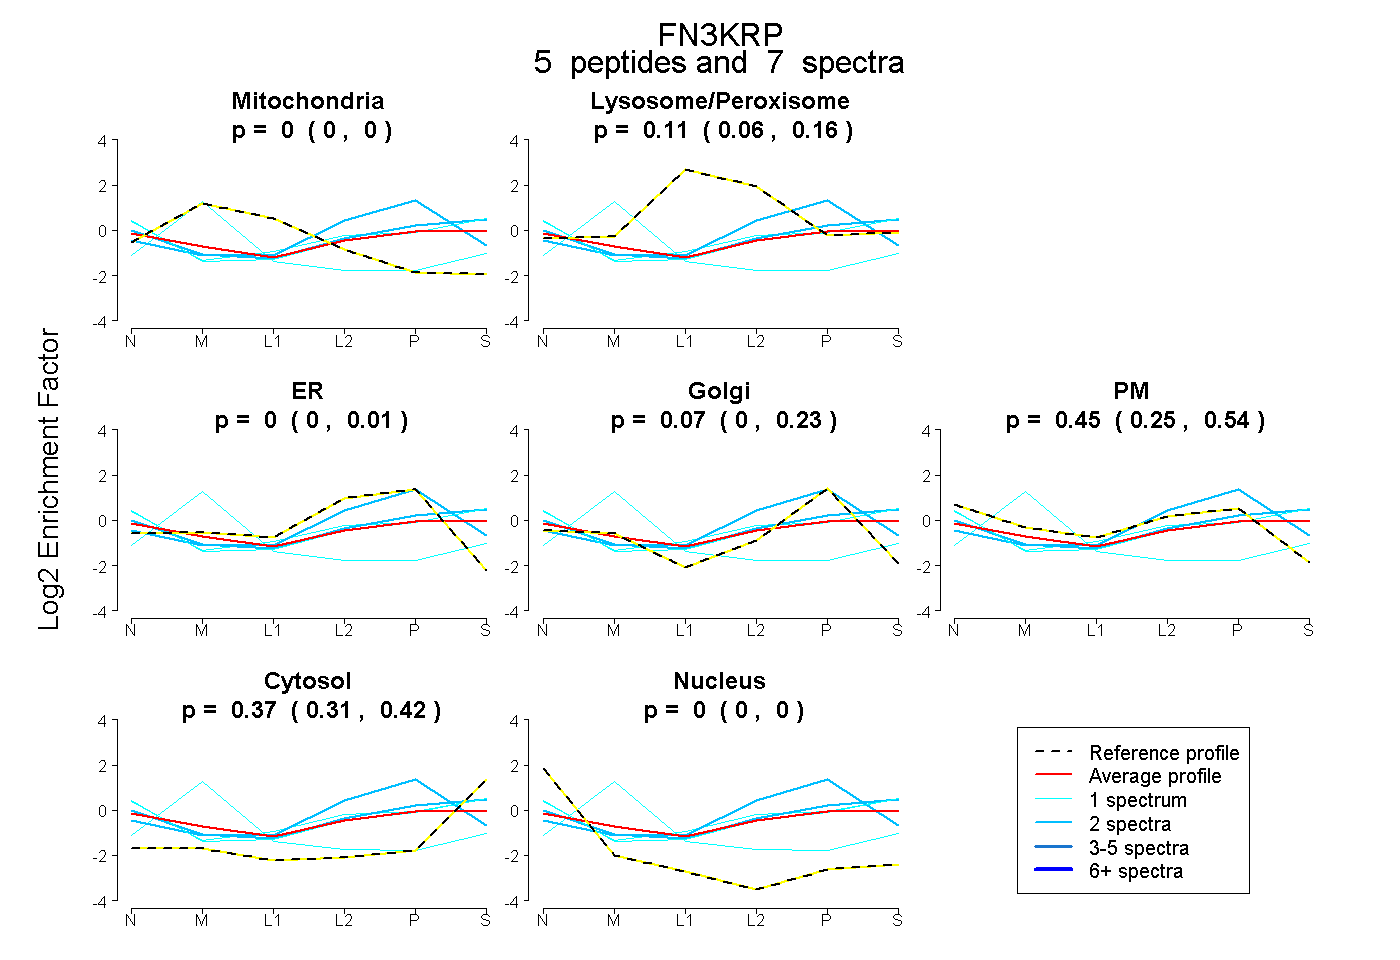
0.000 | 0.000
0.065 | 0.157
0.000 | 0.015
0.000 | 0.228
0.248 | 0.542
0.308 | 0.422
0.000 | 0.000
10peptides
spectra
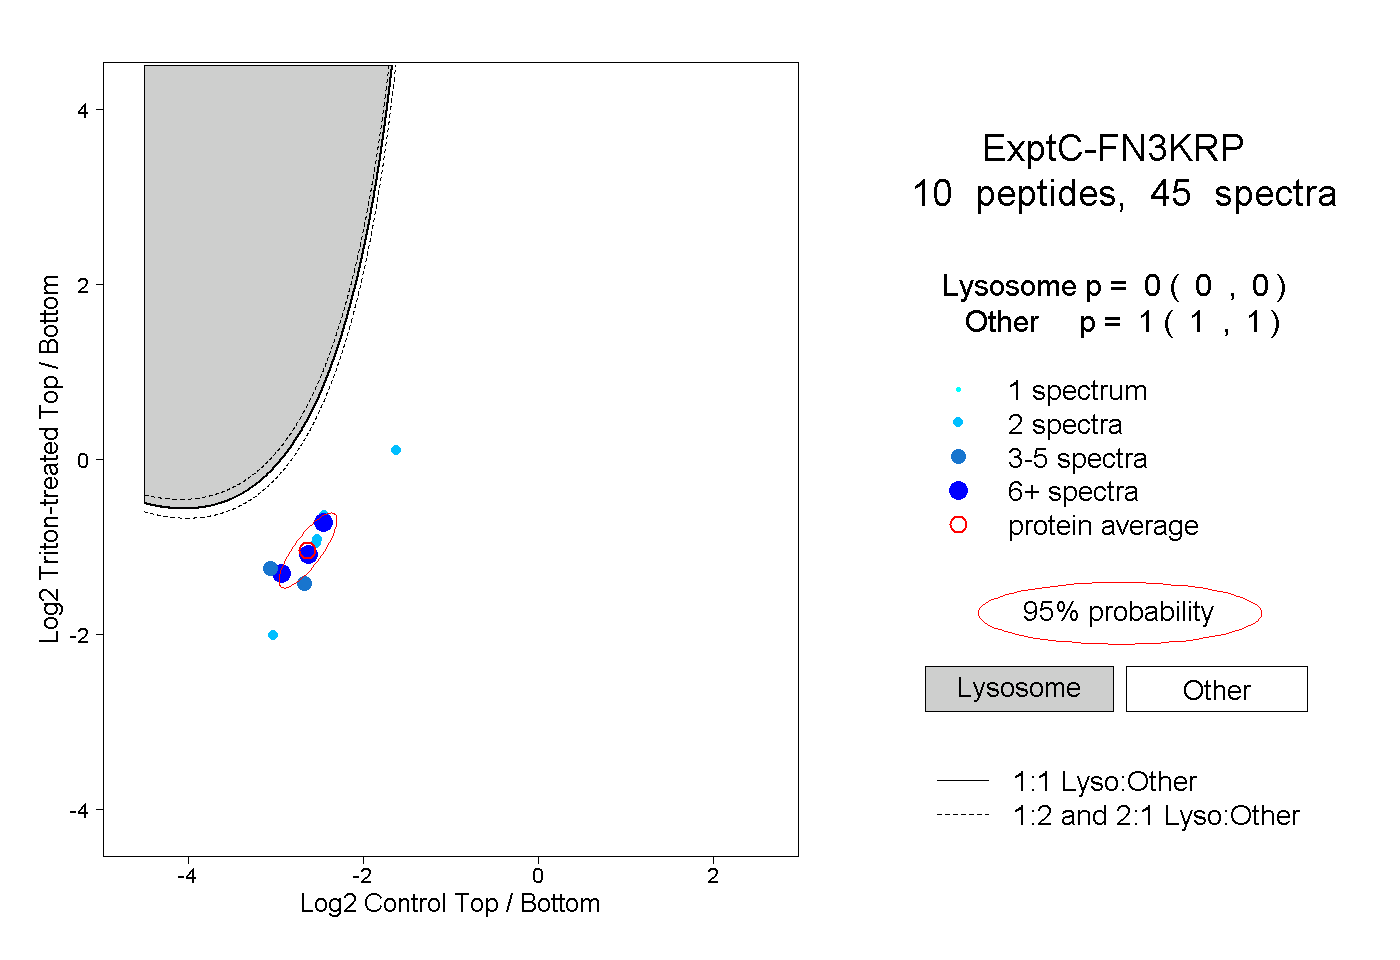
0.000 | 0.000
1.000 | 1.000
2peptides
spectra
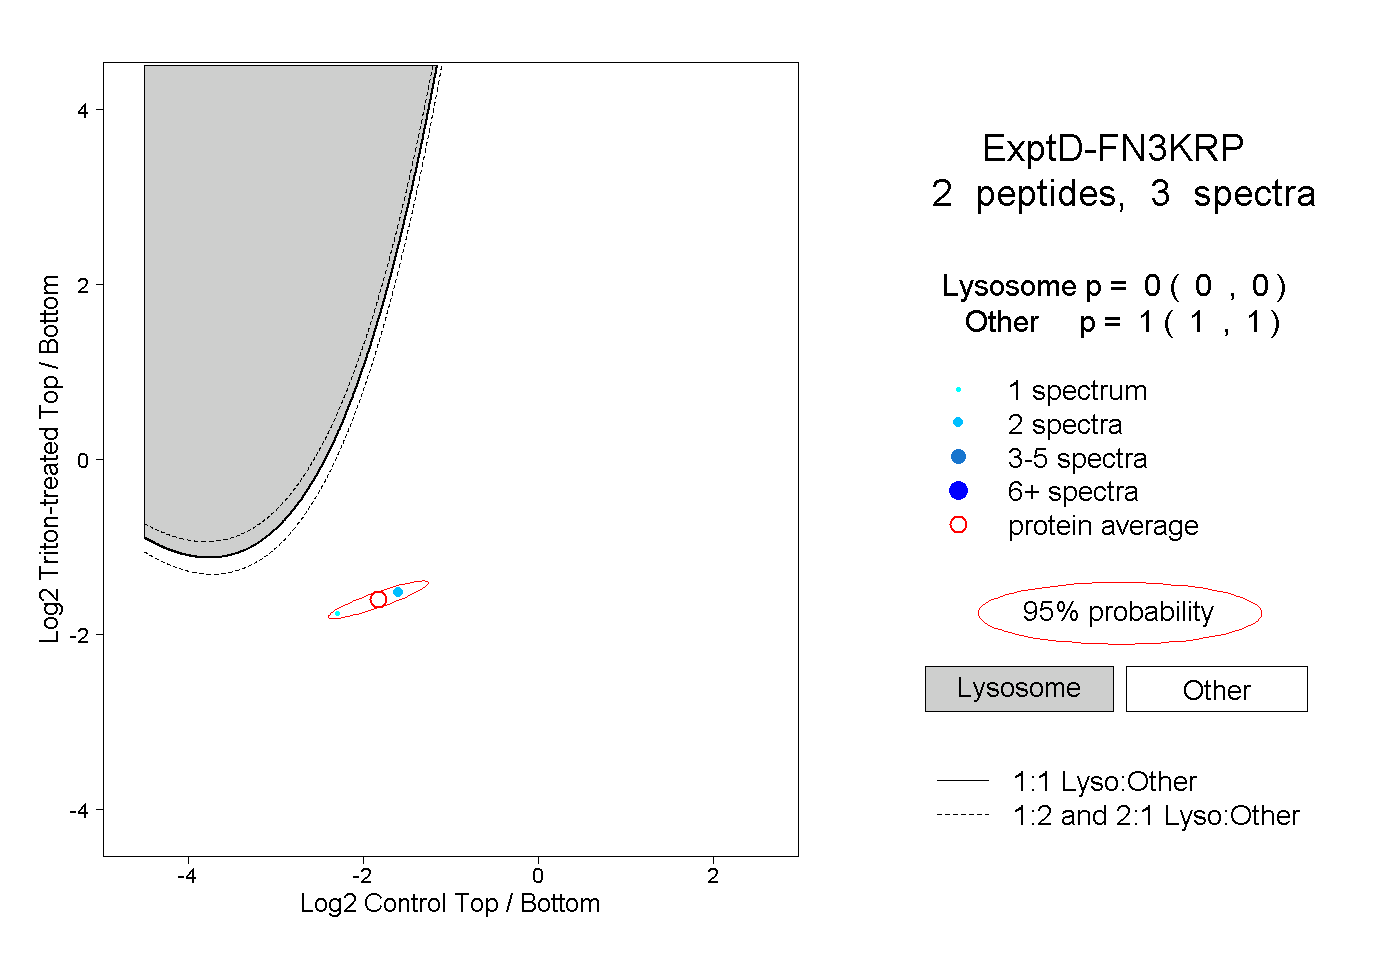
0.000 | 0.000
1.000 | 1.000