FN3KRP
[ENSRNOP00000051799]
Main page
| | | Plot |
Mito |
Lyso |
|
Perox |
ER |
Golgi |
PM |
Cytosol |
Nucleus |
|
| Expt A |
 8
8
peptides |
19
spectra |
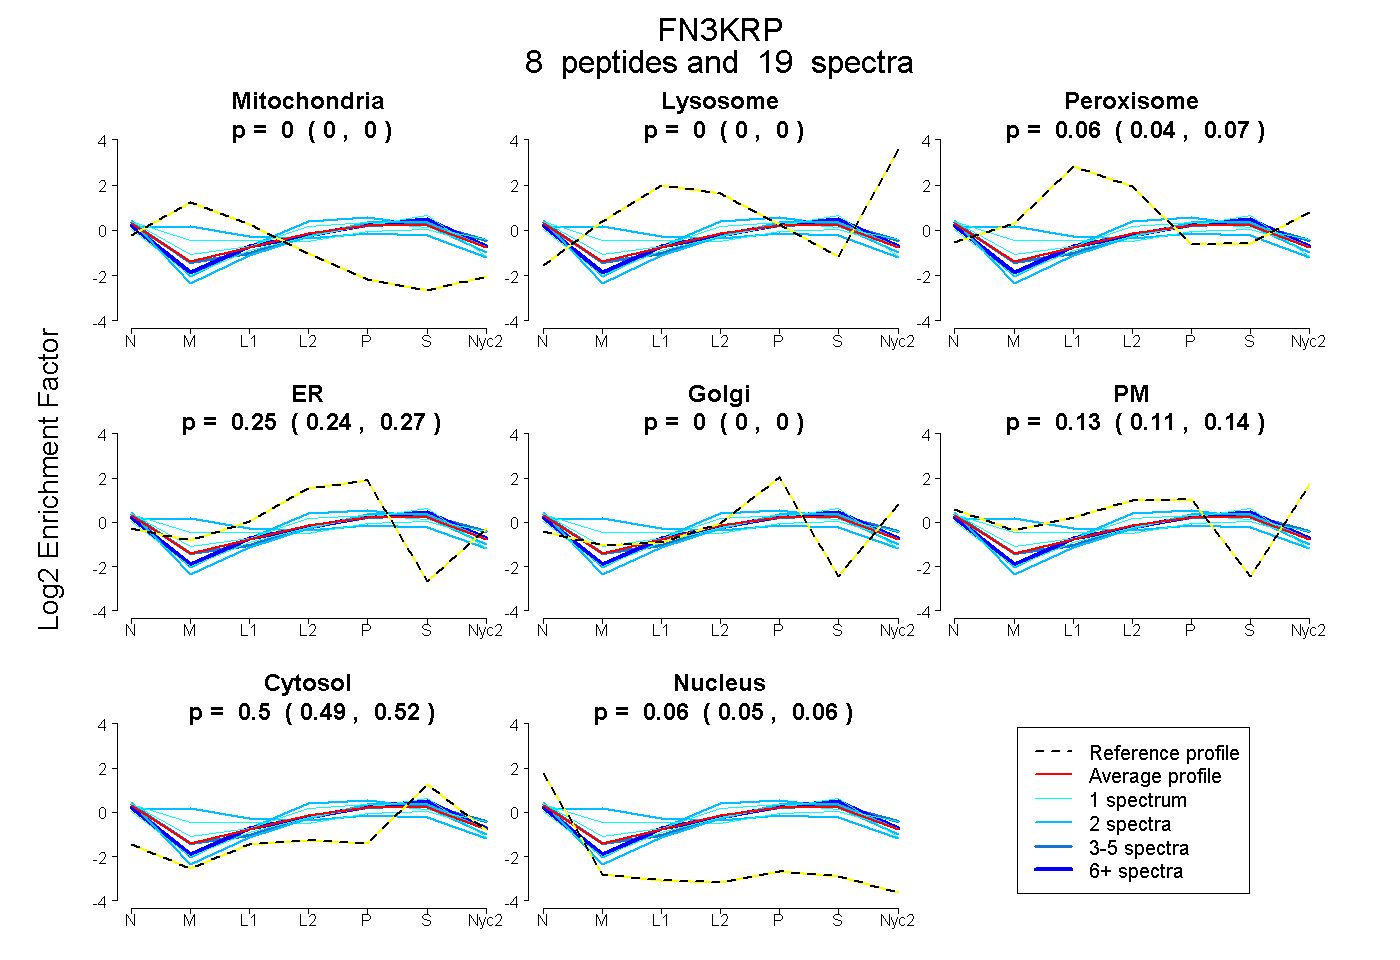 |
0.000
0.000 | 0.000 |
0.000
0.000 | 0.000 |
|
0.058
0.041 | 0.073 |
0.253
0.236 | 0.268 |
0.000
0.000 | 0.000 |
0.127
0.106 | 0.144 |
0.504
0.490 | 0.516 |
0.058
0.051 | 0.064 |
|
| | | Plot |
Mito |
|
Lyso or Perox |
|
ER |
Golgi |
PM |
Cytosol |
Nucleus |
|
| Expt B |
5
peptides |
7
spectra |
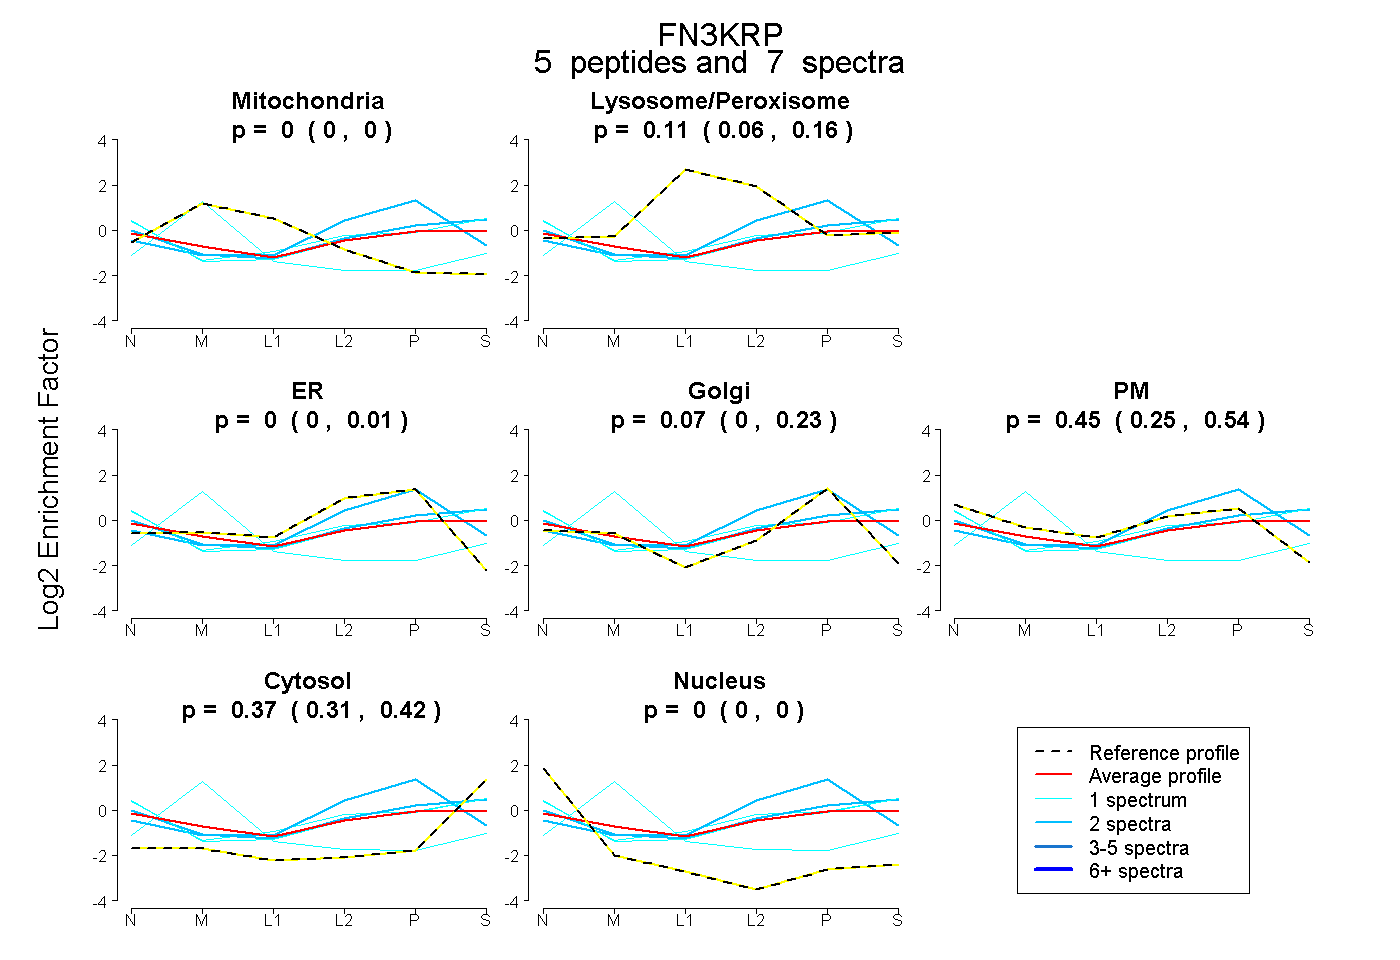 |
0.000
0.000 | 0.000 |
|
0.108
0.065 | 0.157 |
|
0.000
0.000 | 0.015 |
0.068
0.000 | 0.228 |
0.449
0.248 | 0.542 |
0.374
0.308 | 0.422 |
0.000
0.000 | 0.000 |
|
| 2 spectra, ETLLK |
0.000 |
|
0.107 |
|
0.505 |
0.227 |
0.000 |
0.161 |
0.000 |
|
| 1 spectrum, DWVTFYAR |
0.000 |
|
0.172 |
|
0.000 |
0.000 |
0.432 |
0.397 |
0.000 |
|
| 1 spectrum, IPDLFR |
0.000 |
|
0.086 |
|
0.000 |
0.000 |
0.478 |
0.435 |
0.000 |
|
| 2 spectra, GSSLNIMR |
0.000 |
|
0.148 |
|
0.000 |
0.117 |
0.335 |
0.400 |
0.000 |
|
| 1 spectrum, EALGLWSALQLK |
0.625 |
|
0.000 |
|
0.000 |
0.059 |
0.000 |
0.294 |
0.022 |
|
| | | Plot |
|
Lyso |
|
|
|
|
|
|
|
Other |
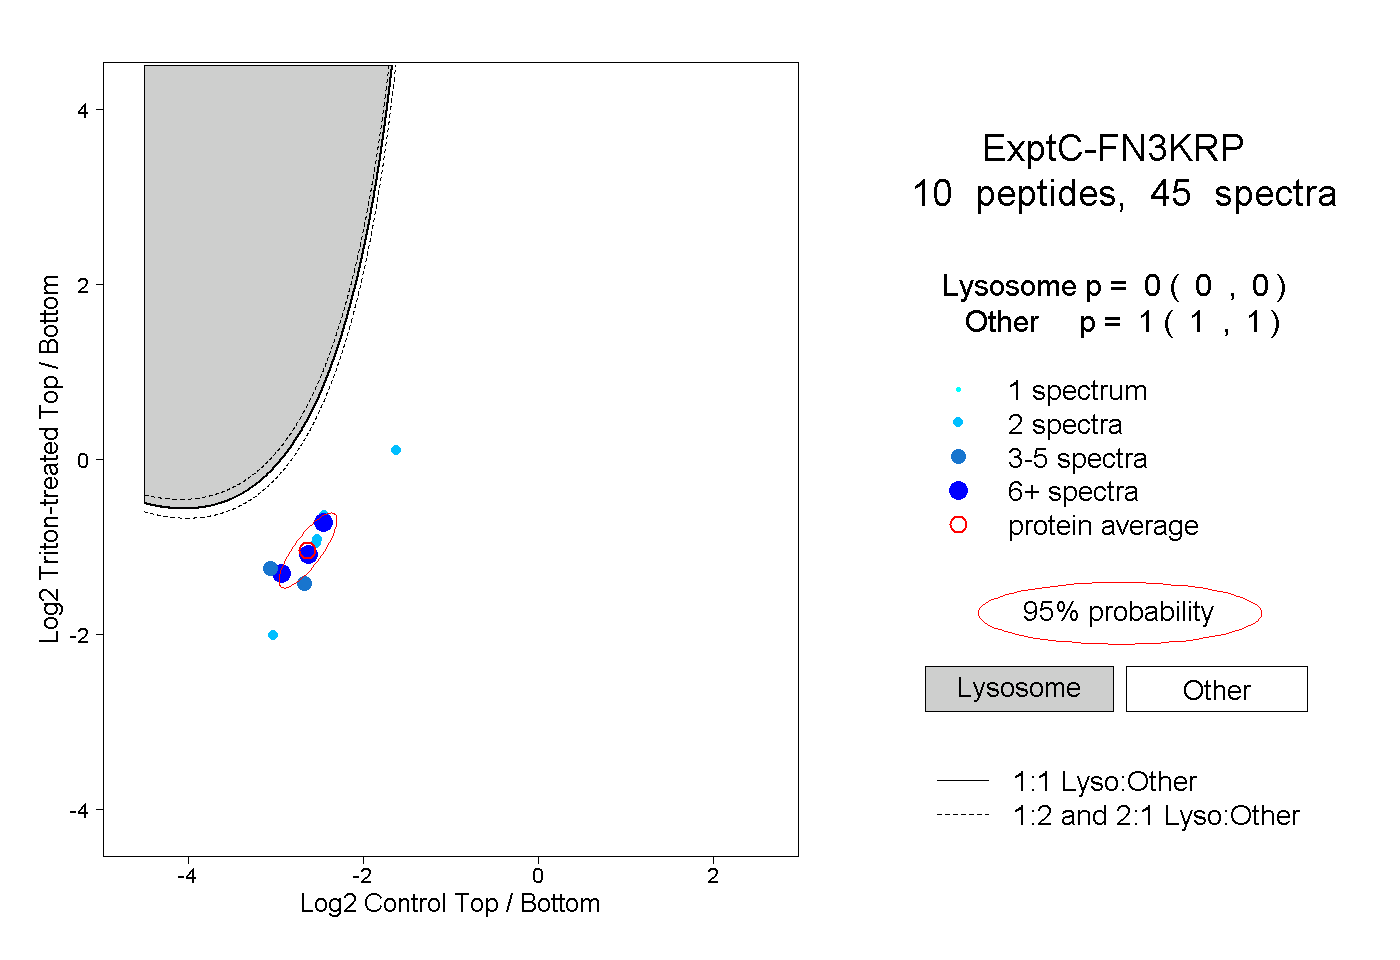
| Expt C |
10
peptides |
45
spectra |
 |
|
0.000
0.000 | 0.000 |
|
|
|
|
|
|
|
1.000
1.000 | 1.000 |
| | | Plot |
|
Lyso |
|
|
|
|
|
|
|
Other |
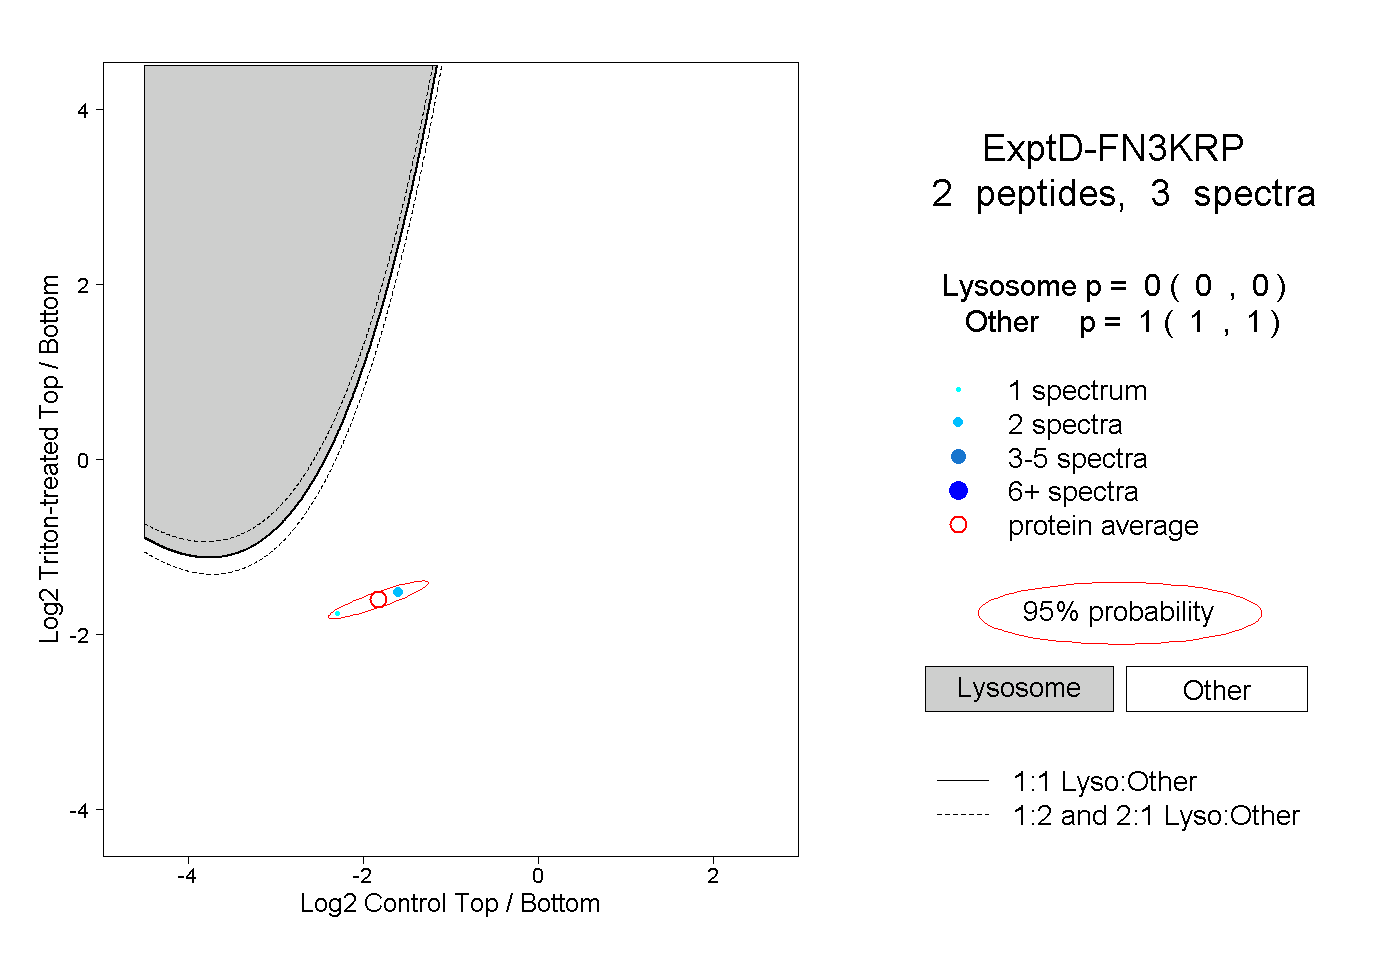
| Expt D |
2
peptides |
3
spectra |
 |
|
0.000
0.000 | 0.000 |
|
|
|
|
|
|
|
1.000
1.000 | 1.000 |