 8
8peptides
spectra
0.000 | 0.000
0.000 | 0.000
0.041 | 0.073
0.236 | 0.268
0.000 | 0.000
0.106 | 0.144
0.490 | 0.516
0.051 | 0.064
| Plot | Mito | Lyso | Perox | ER | Golgi | PM | Cytosol | Nucleus | |||||
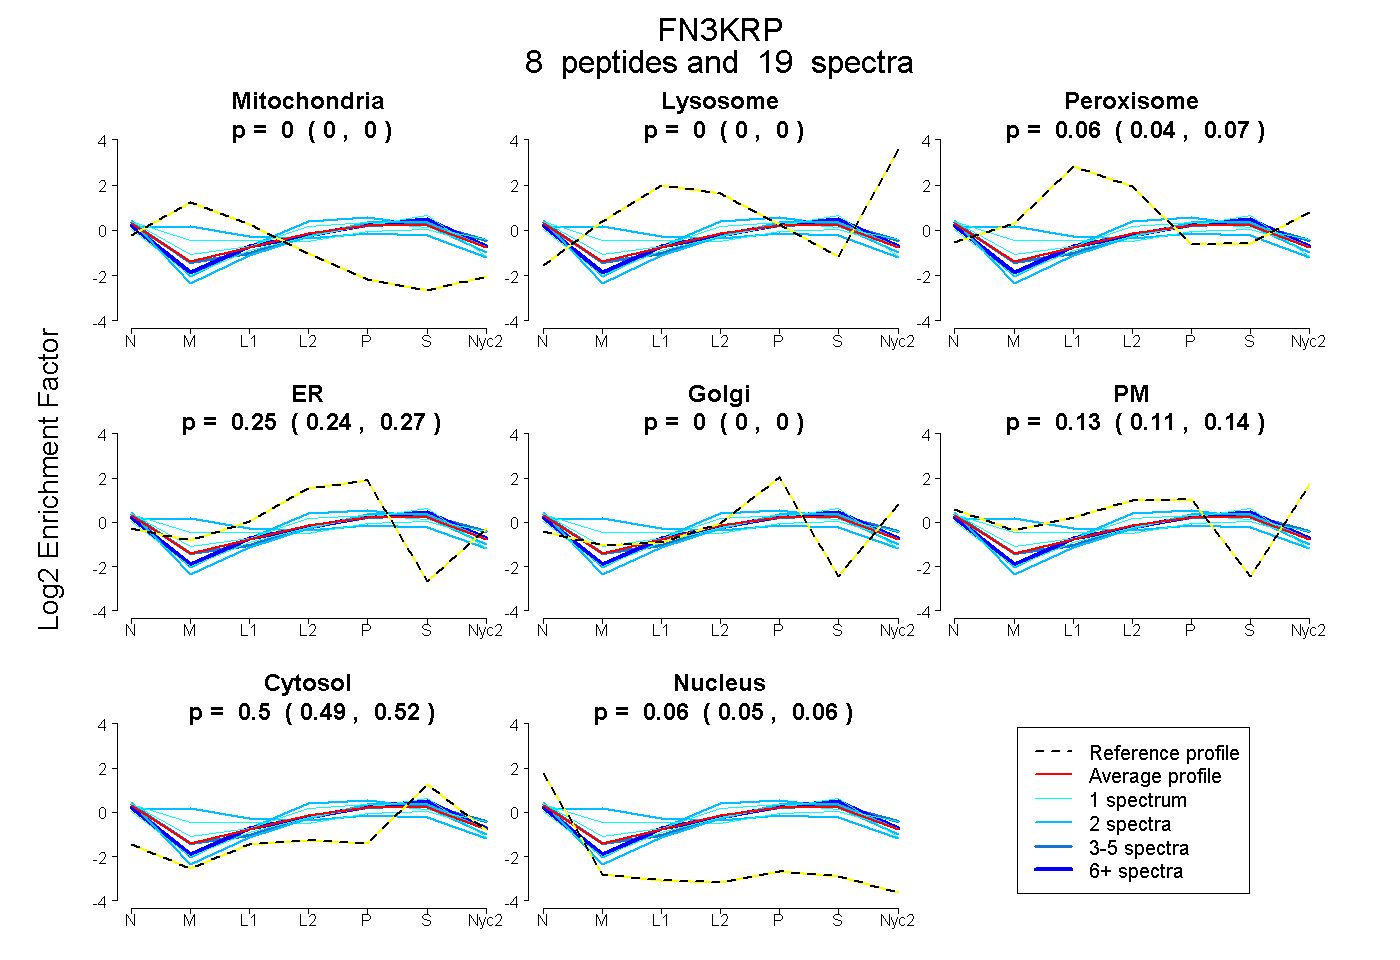
| Expt A |
8 peptides |
19 spectra |
|
0.000 0.000 | 0.000 |
0.000 0.000 | 0.000 |
0.058 0.041 | 0.073 |
0.253 0.236 | 0.268 |
0.000 0.000 | 0.000 |
0.127 0.106 | 0.144 |
0.504 0.490 | 0.516 |
0.058 0.051 | 0.064 |
| 1 spectrum, GGGLAER | 0.169 | 0.000 | 0.066 | 0.064 | 0.000 | 0.250 | 0.427 | 0.024 | ||
| 2 spectra, EAGTVGK | 0.000 | 0.000 | 0.003 | 0.462 | 0.000 | 0.000 | 0.508 | 0.027 | ||
| 2 spectra, IPDLFR | 0.000 | 0.000 | 0.000 | 0.271 | 0.000 | 0.090 | 0.572 | 0.067 | ||
| 1 spectrum, LGSQLADLHLENK | 0.000 | 0.000 | 0.058 | 0.205 | 0.000 | 0.251 | 0.459 | 0.026 | ||
| 6 spectra, GSSLNIMR | 0.000 | 0.000 | 0.008 | 0.268 | 0.000 | 0.113 | 0.592 | 0.020 | ||
| 4 spectra, EALGLWSALQLK | 0.000 | 0.000 | 0.000 | 0.139 | 0.000 | 0.284 | 0.541 | 0.036 | ||
| 2 spectra, ELGCNSVK | 0.320 | 0.000 | 0.108 | 0.187 | 0.039 | 0.017 | 0.329 | 0.000 | ||
| 1 spectrum, MFDGEMASLTAILK | 0.000 | 0.000 | 0.000 | 0.335 | 0.000 | 0.000 | 0.637 | 0.028 |
| Plot | Mito | Lyso or Perox | ER | Golgi | PM | Cytosol | Nucleus | ||||||
| Expt B |
5 peptides |
7 spectra |
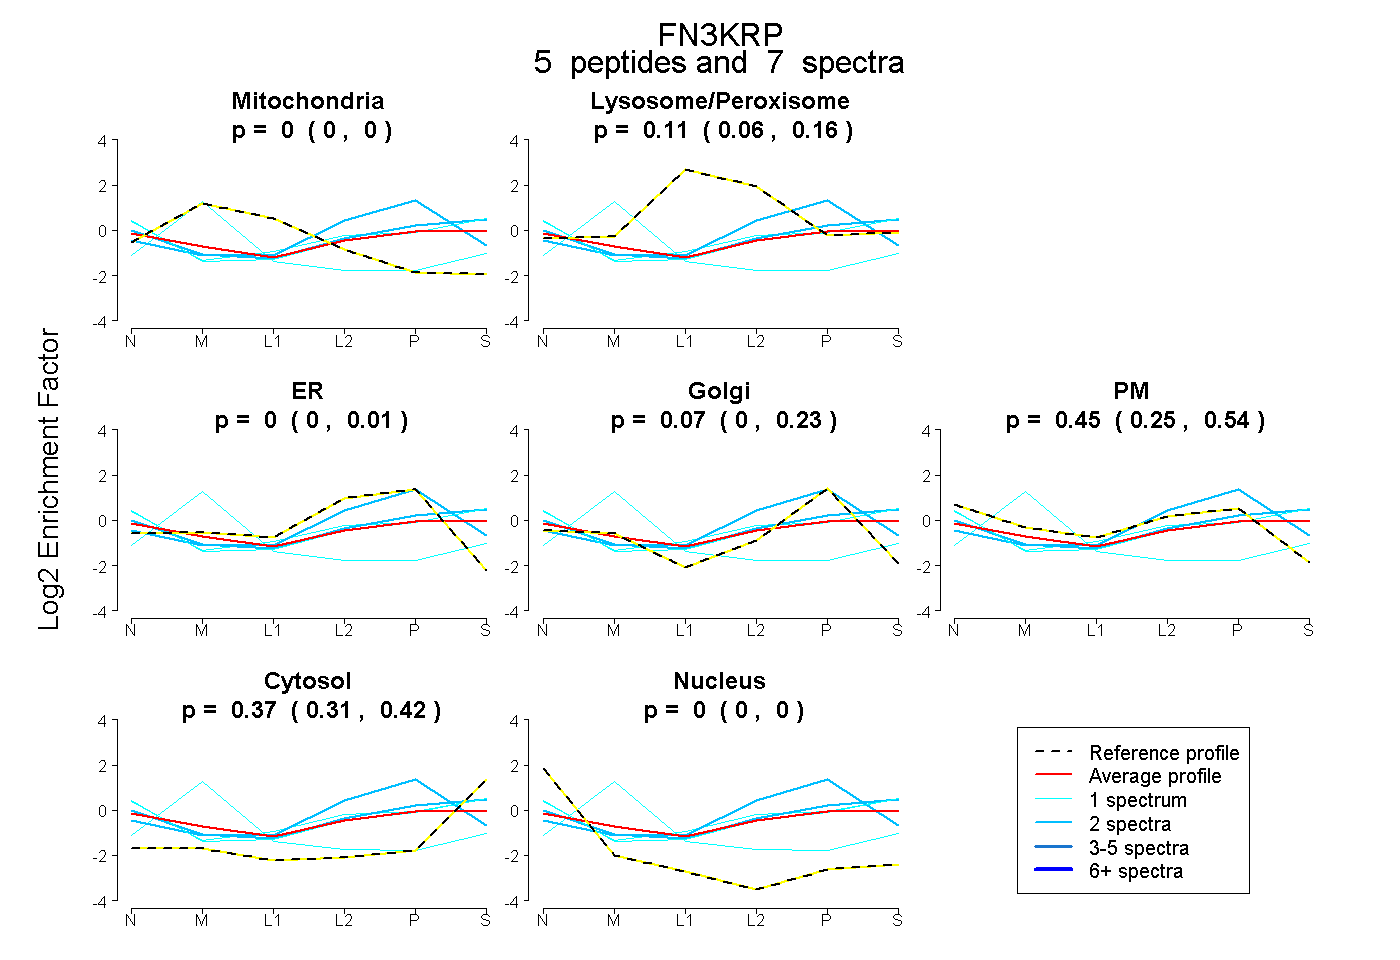 |
0.000 0.000 | 0.000 |
0.108 0.065 | 0.157 |
0.000 0.000 | 0.015 |
0.068 0.000 | 0.228 |
0.449 0.248 | 0.542 |
0.374 0.308 | 0.422 |
0.000 0.000 | 0.000 |
|||
| Plot | Lyso | Other | |||||||||||
| Expt C |
10 peptides |
45 spectra |
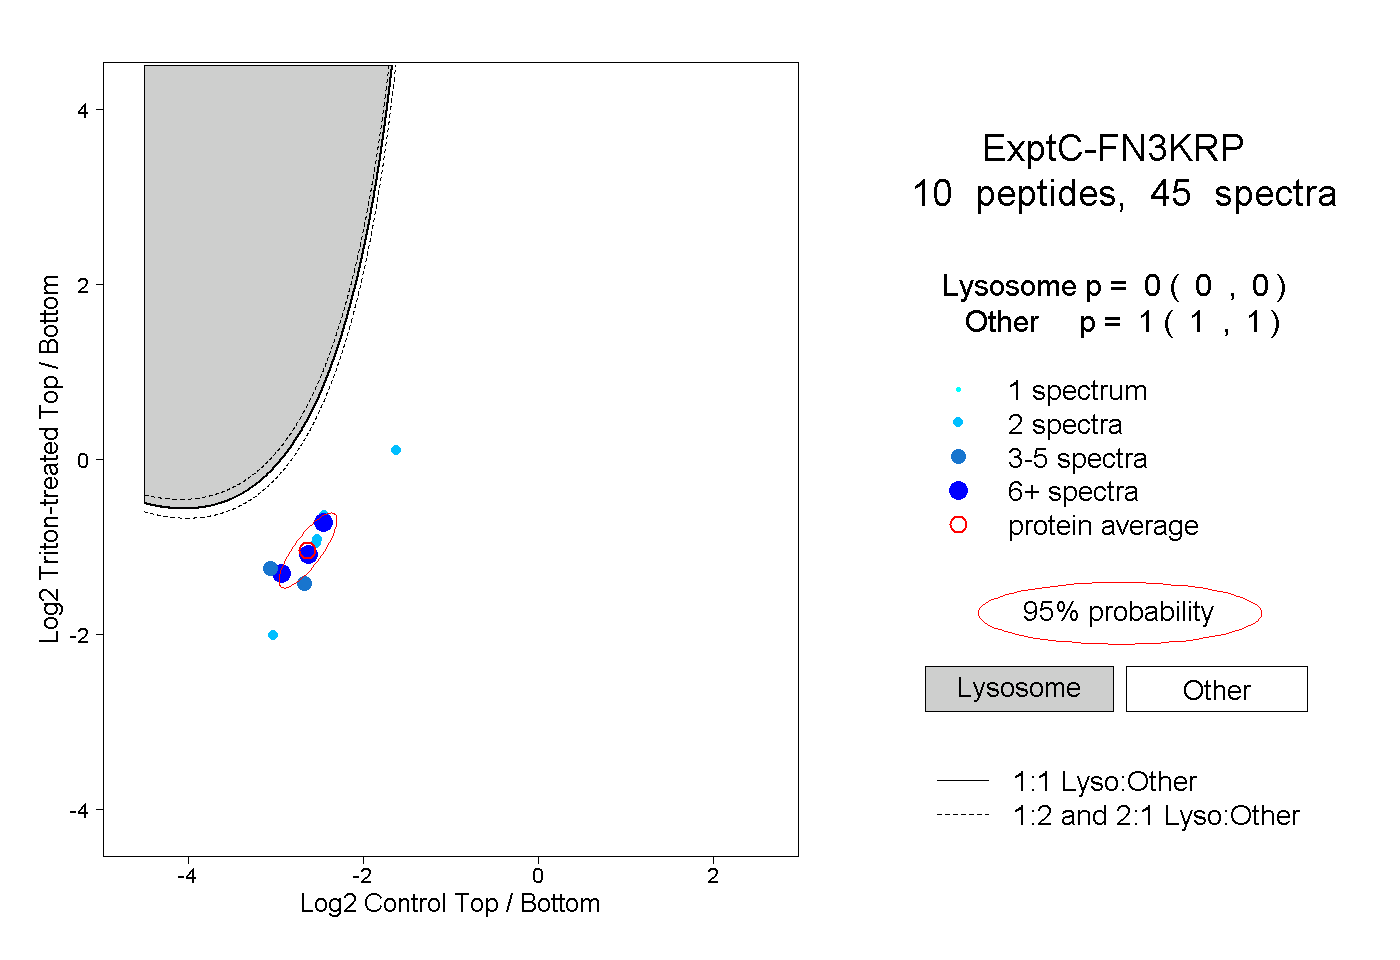 |
0.000 0.000 | 0.000 |
1.000 1.000 | 1.000 |
||||||||
| Plot | Lyso | Other | |||||||||||
| Expt D |
2 peptides |
3 spectra |
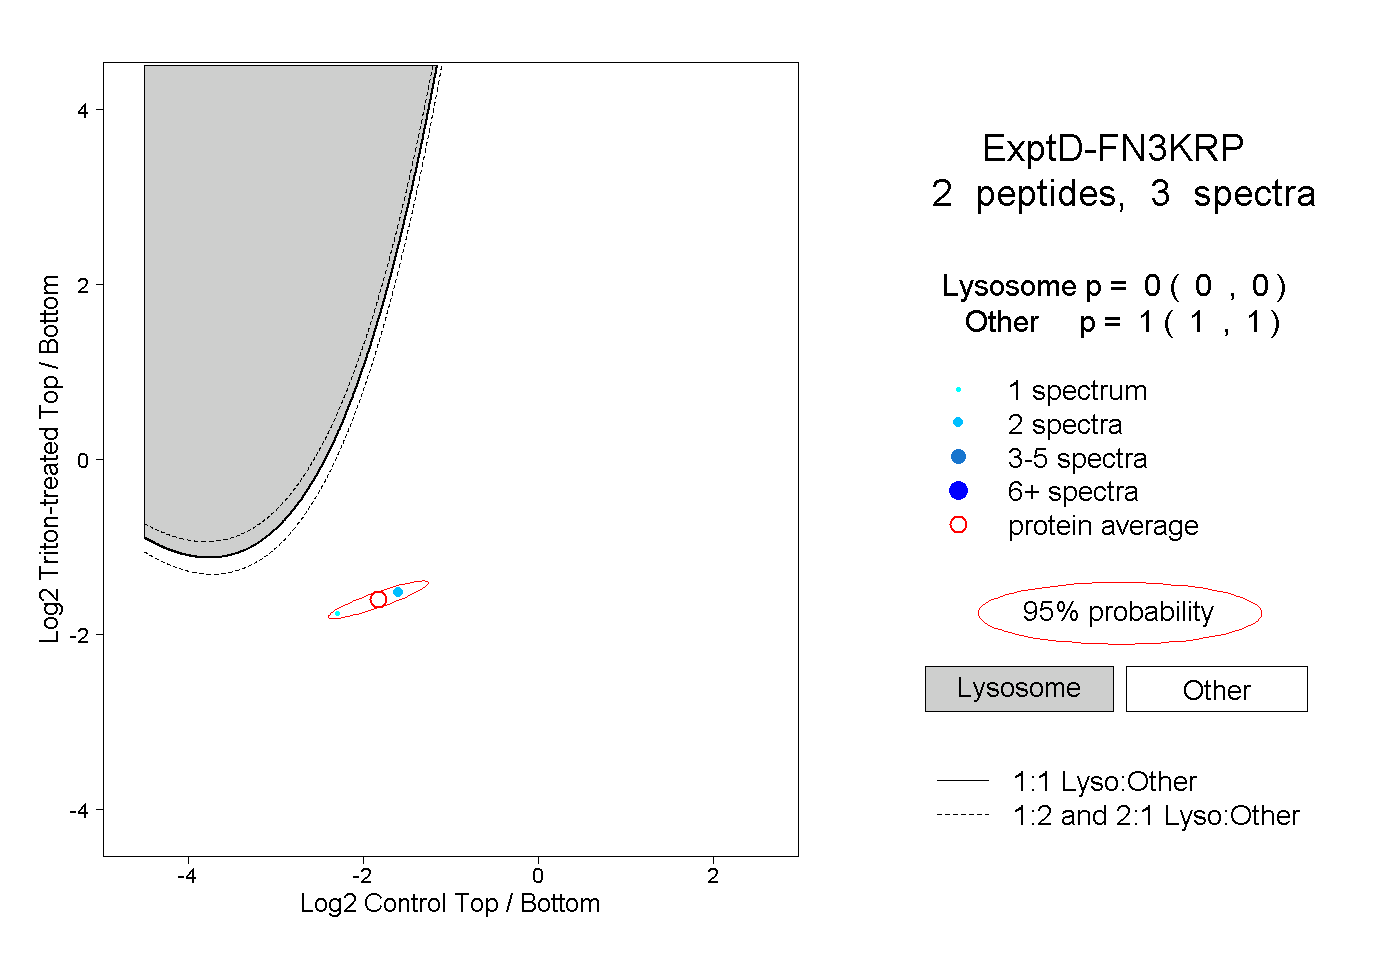 |
0.000 0.000 | 0.000 |
1.000 1.000 | 1.000 |