 9
9peptides
spectra
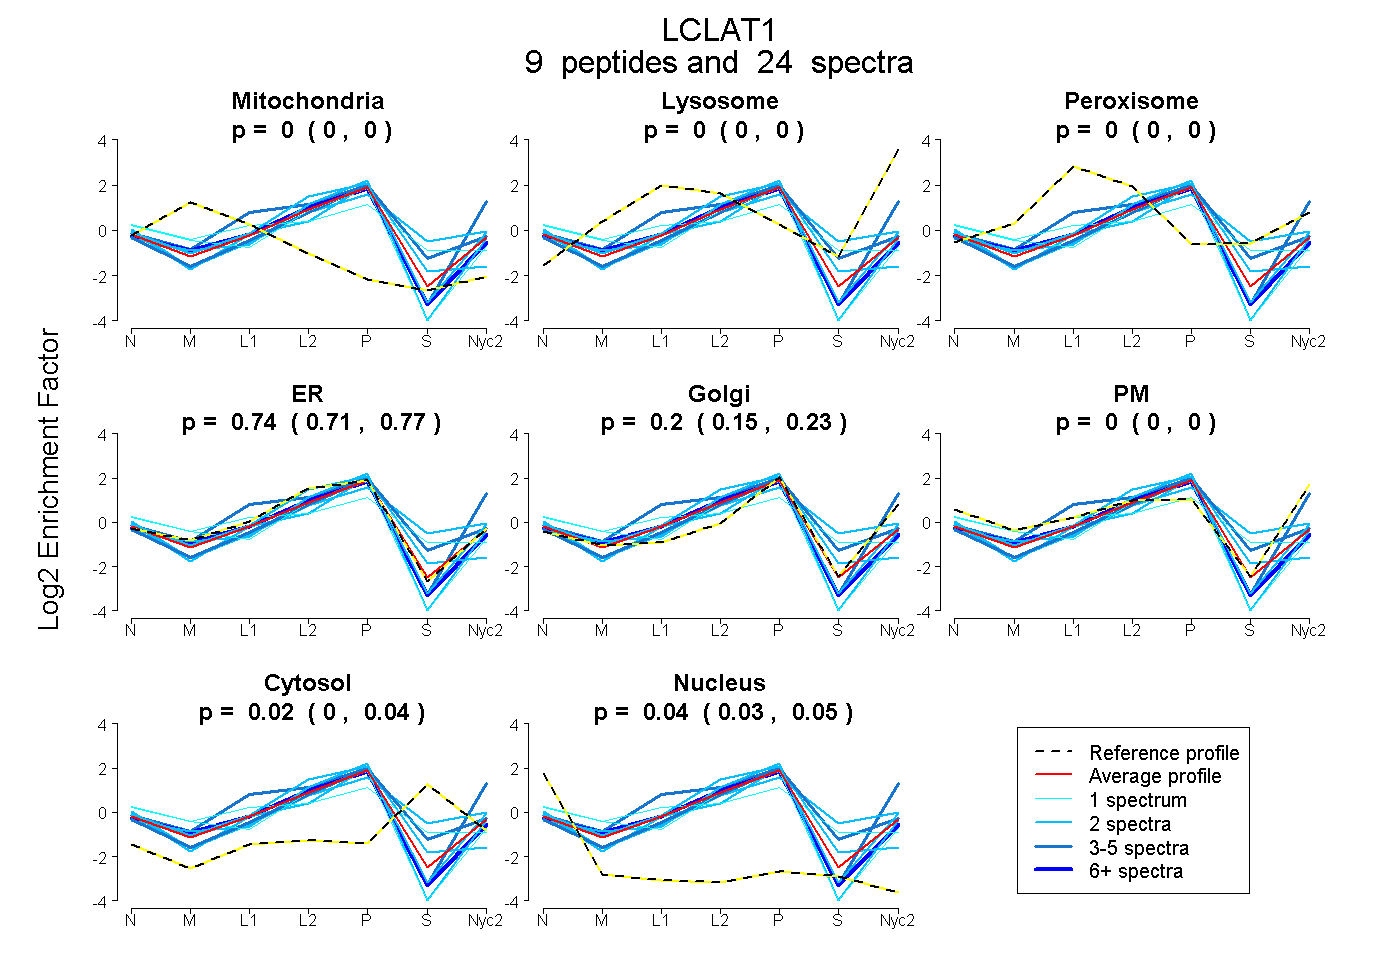
0.000 | 0.000
0.000 | 0.000
0.000 | 0.000
0.710 | 0.772
0.155 | 0.231
0.000 | 0.000
0.000 | 0.042
0.025 | 0.054
6peptides
spectra
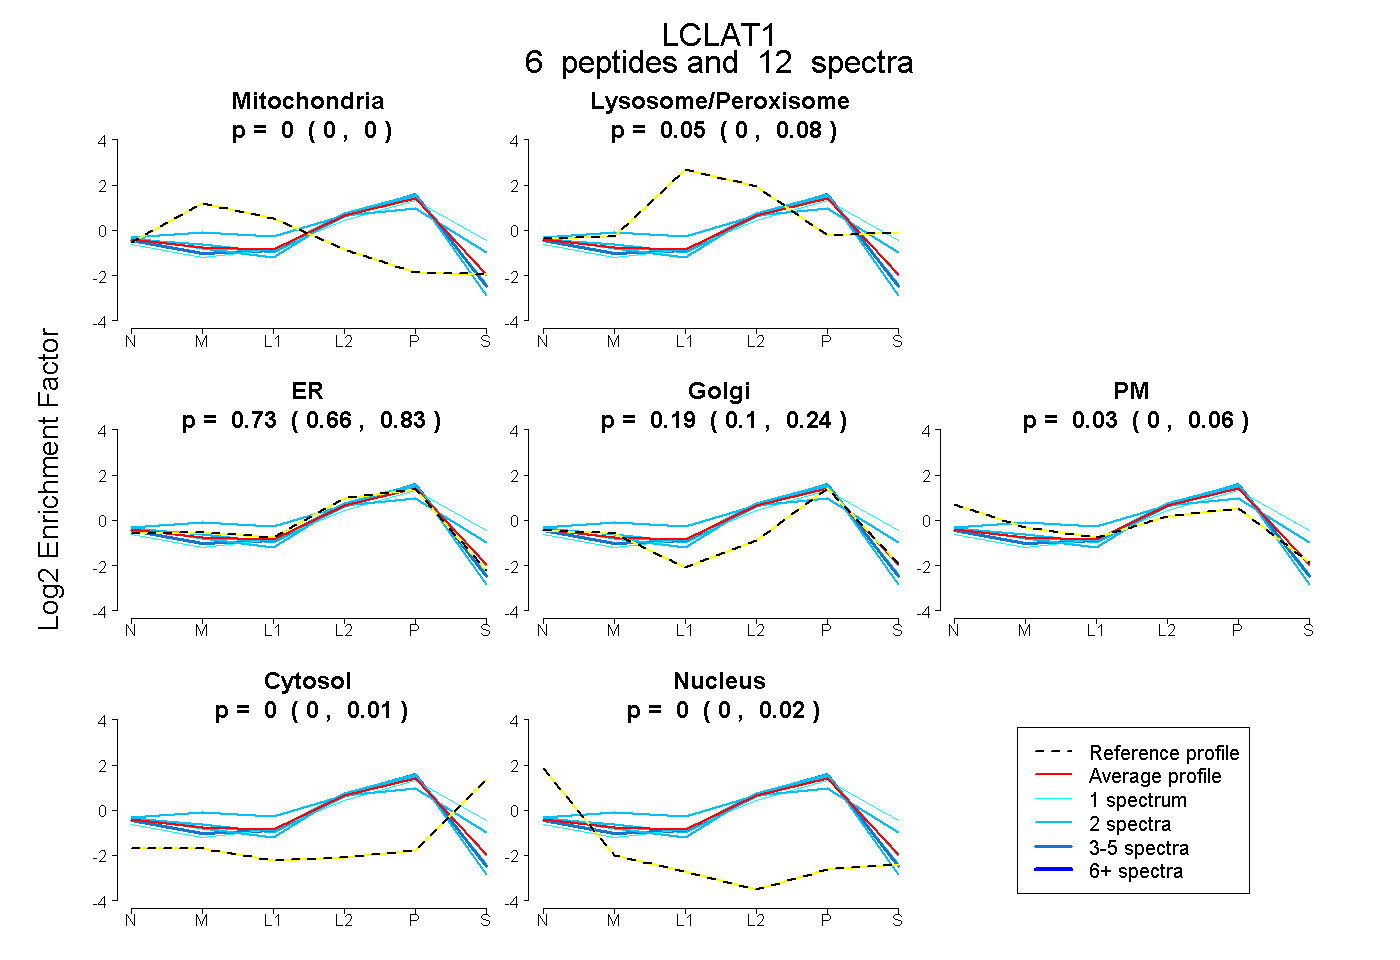
0.000 | 0.000
0.001 | 0.080
0.661 | 0.832
0.099 | 0.242
0.000 | 0.059
0.000 | 0.011
0.000 | 0.018
9peptides
spectra
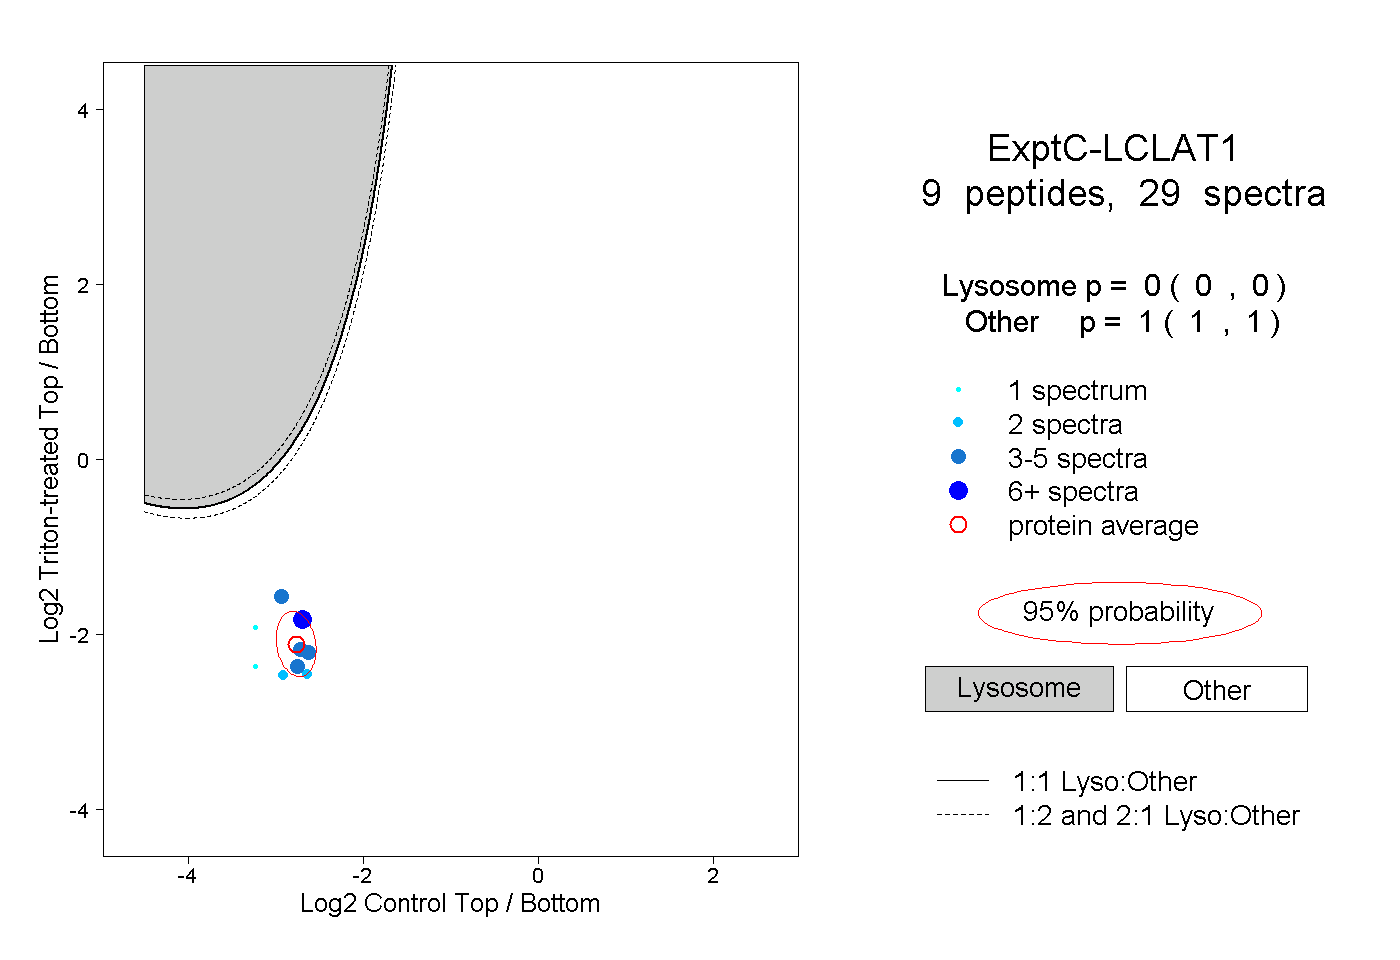
0.000 | 0.000
1.000 | 1.000
1peptide
spectrum
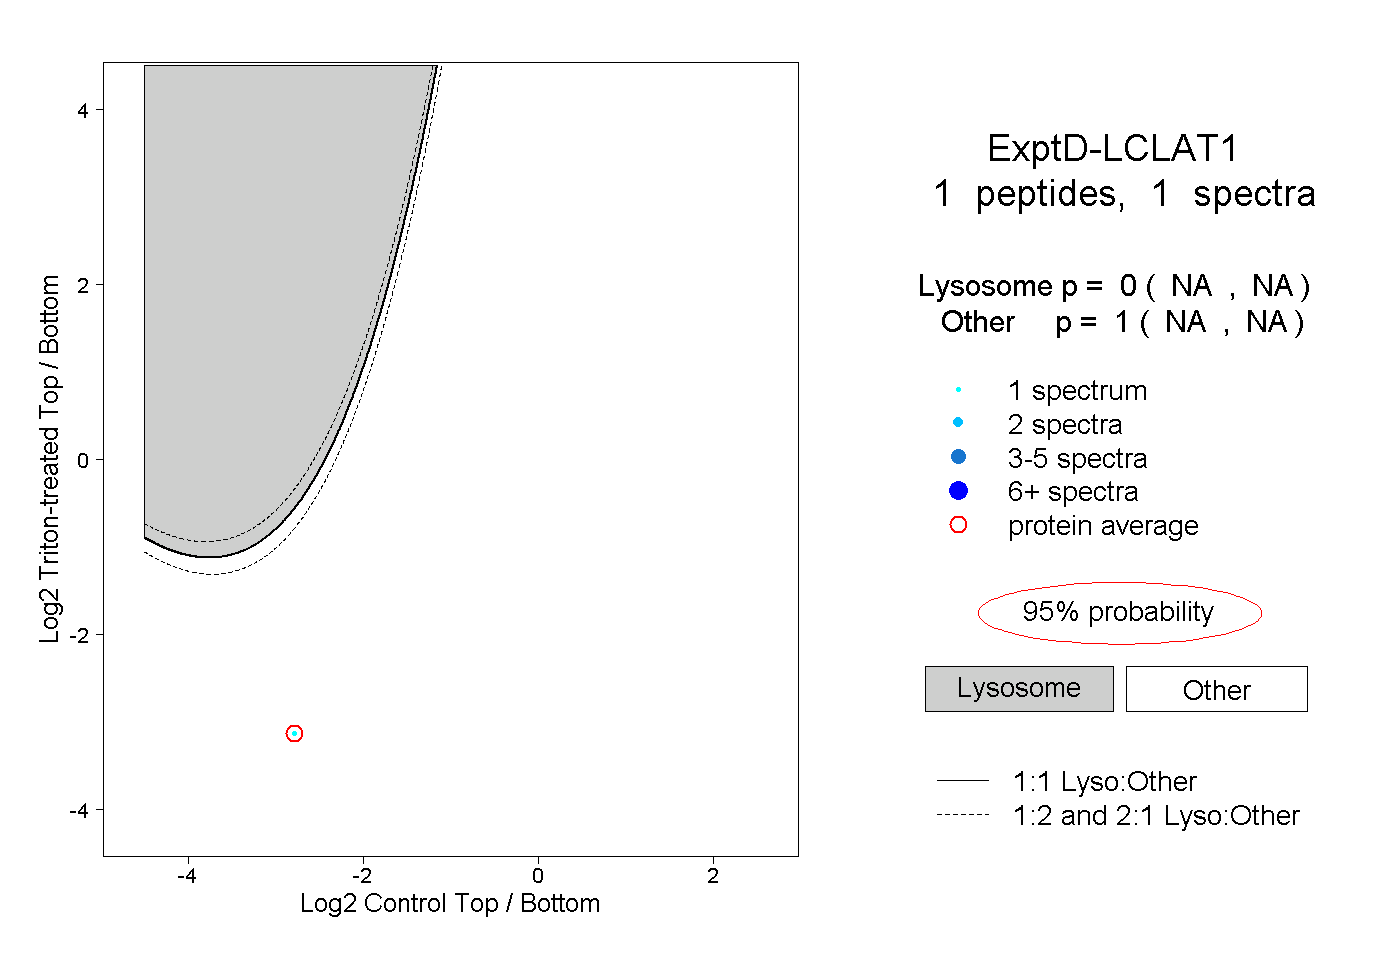
NA | NA
NA | NA