 9
9peptides
spectra
0.000 | 0.000
0.000 | 0.000
0.000 | 0.000
0.710 | 0.772
0.155 | 0.231
0.000 | 0.000
0.000 | 0.042
0.025 | 0.054
| Plot | Mito | Lyso | Perox | ER | Golgi | PM | Cytosol | Nucleus | |||||
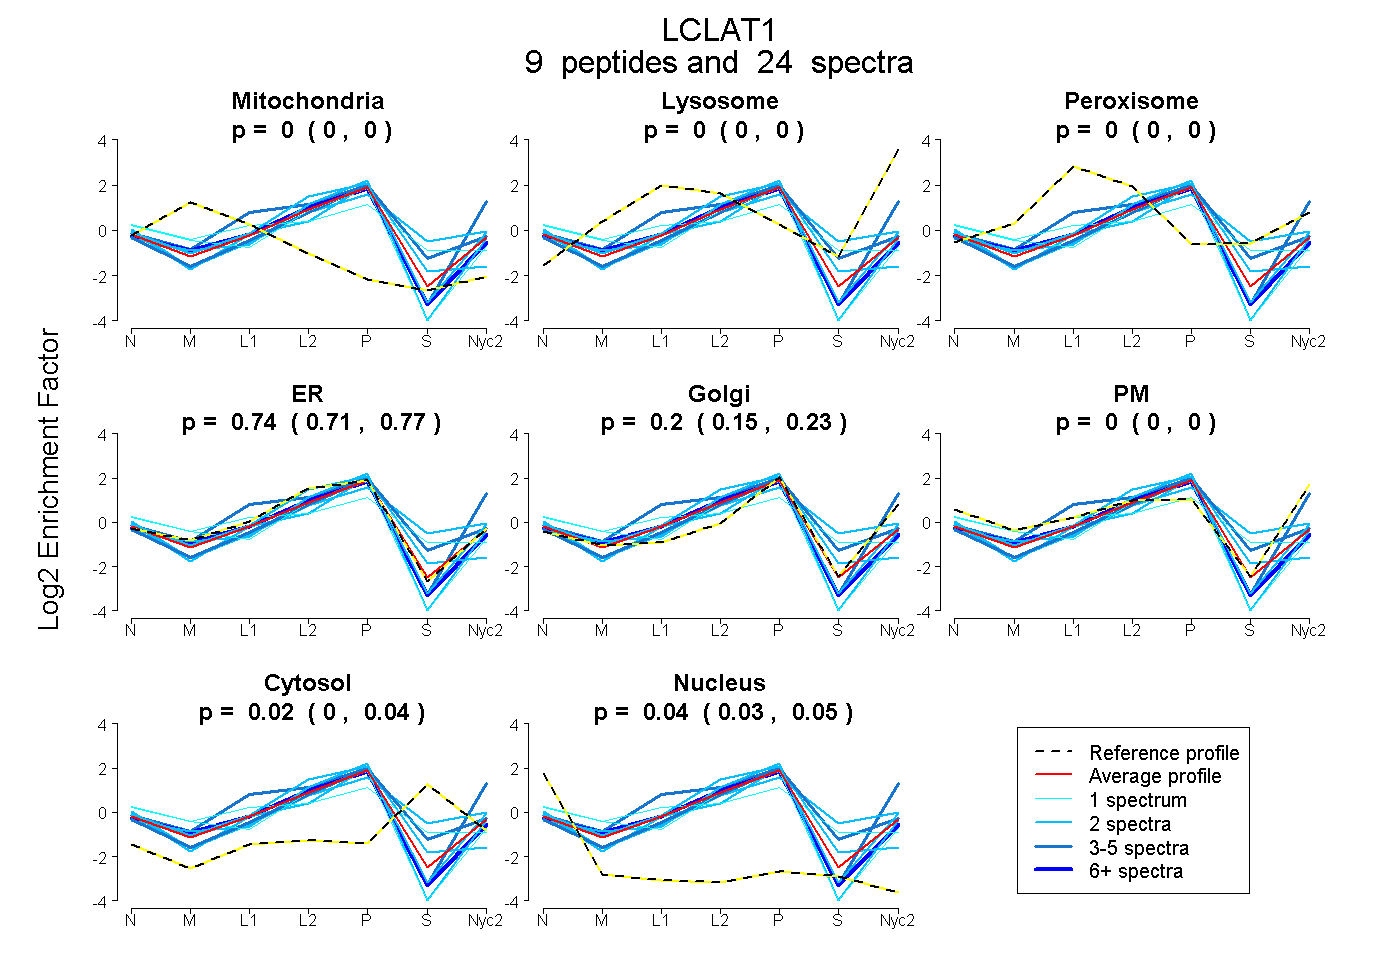
| Expt A |
9 peptides |
24 spectra |
|
0.000 0.000 | 0.000 |
0.000 0.000 | 0.000 |
0.000 0.000 | 0.000 |
0.744 0.710 | 0.772 |
0.198 0.155 | 0.231 |
0.000 0.000 | 0.000 |
0.016 0.000 | 0.042 |
0.042 0.025 | 0.054 |
| 6 spectra, EIHFHVHR | 0.000 | 0.000 | 0.000 | 0.874 | 0.064 | 0.000 | 0.000 | 0.062 | ||
| 1 spectrum, SVIIMNHR | 0.080 | 0.000 | 0.136 | 0.564 | 0.000 | 0.000 | 0.193 | 0.028 | ||
| 1 spectrum, YEYVLHPR | 0.000 | 0.000 | 0.000 | 0.846 | 0.047 | 0.000 | 0.000 | 0.106 | ||
| 2 spectra, SFYQGEK | 0.000 | 0.000 | 0.000 | 0.501 | 0.092 | 0.094 | 0.312 | 0.000 | ||
| 3 spectra, EDLQLWCHK | 0.000 | 0.087 | 0.000 | 0.453 | 0.048 | 0.412 | 0.000 | 0.000 | ||
| 2 spectra, TTGFTFVVDR | 0.000 | 0.000 | 0.000 | 0.908 | 0.092 | 0.000 | 0.000 | 0.000 | ||
| 2 spectra, HLLLGDFPK | 0.000 | 0.000 | 0.000 | 0.805 | 0.163 | 0.000 | 0.000 | 0.032 | ||
| 2 spectra, HPHLNSK | 0.000 | 0.000 | 0.000 | 0.772 | 0.000 | 0.000 | 0.109 | 0.119 | ||
| 5 spectra, SNDFAEK | 0.000 | 0.000 | 0.000 | 0.609 | 0.186 | 0.000 | 0.205 | 0.000 |
| Plot | Mito | Lyso or Perox | ER | Golgi | PM | Cytosol | Nucleus | ||||||
| Expt B |
6 peptides |
12 spectra |
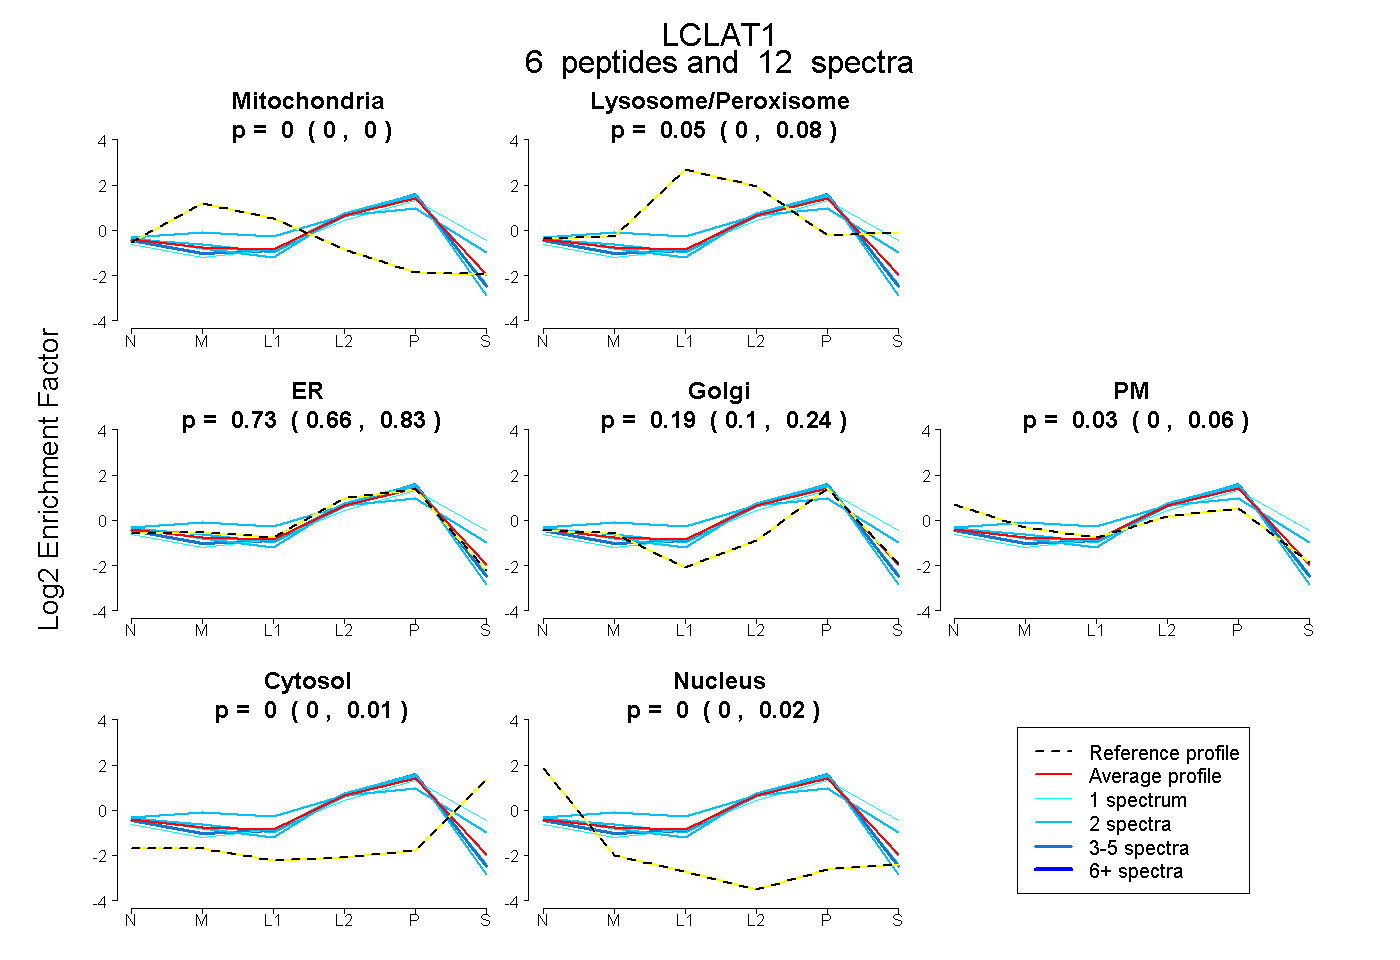 |
0.000 0.000 | 0.000 |
0.047 0.001 | 0.080 |
0.728 0.661 | 0.832 |
0.193 0.099 | 0.242 |
0.033 0.000 | 0.059 |
0.000 0.000 | 0.011 |
0.000 0.000 | 0.018 |
|||
| Plot | Lyso | Other | |||||||||||
| Expt C |
9 peptides |
29 spectra |
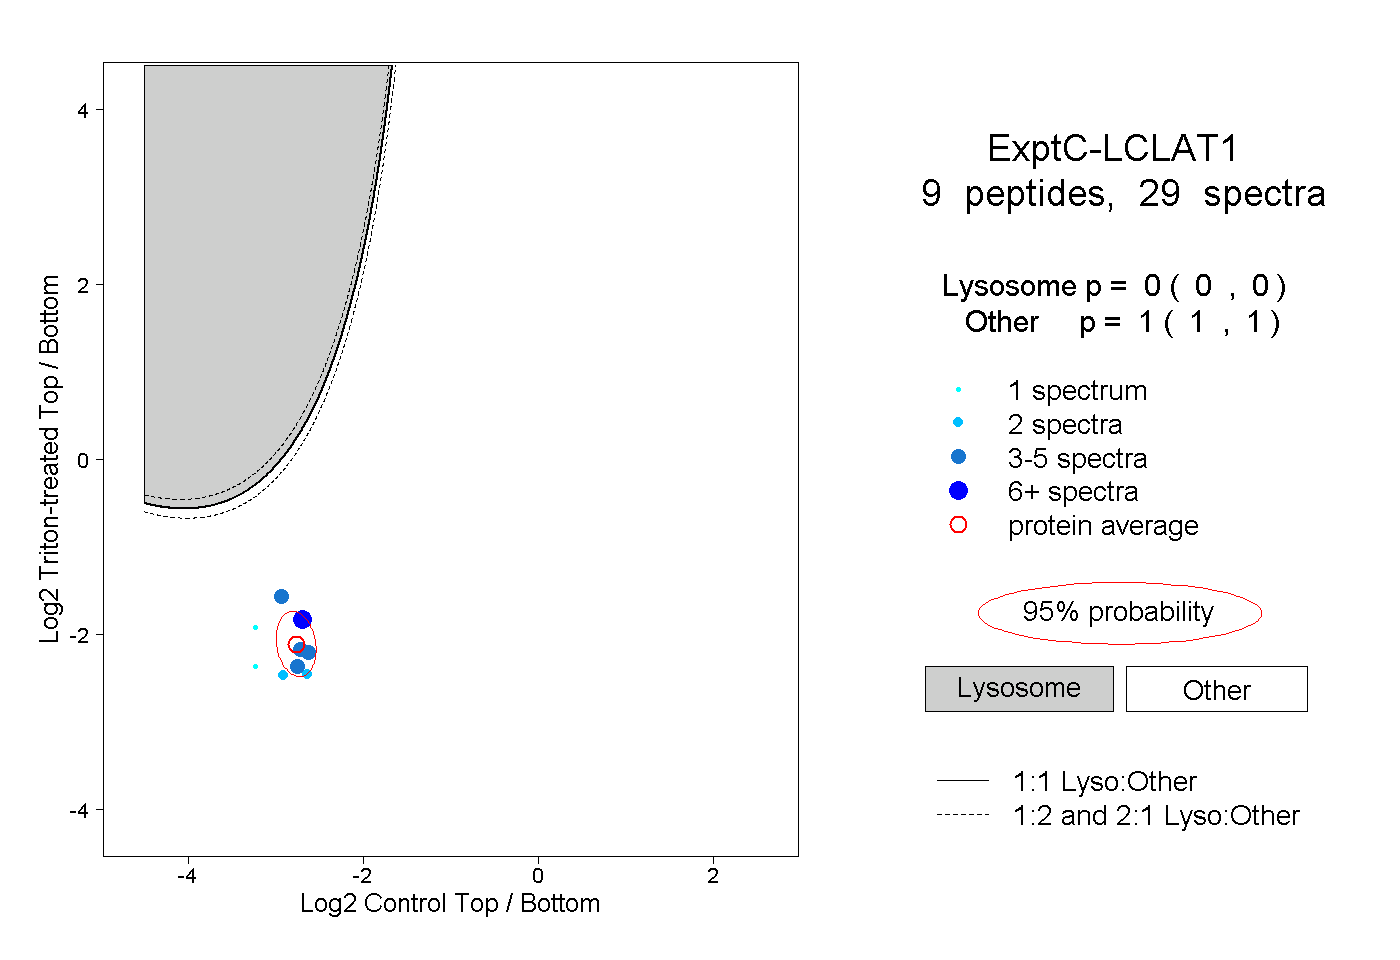 |
0.000 0.000 | 0.000 |
1.000 1.000 | 1.000 |
||||||||
| Plot | Lyso | Other | |||||||||||
| Expt D |
1 peptide |
1 spectrum |
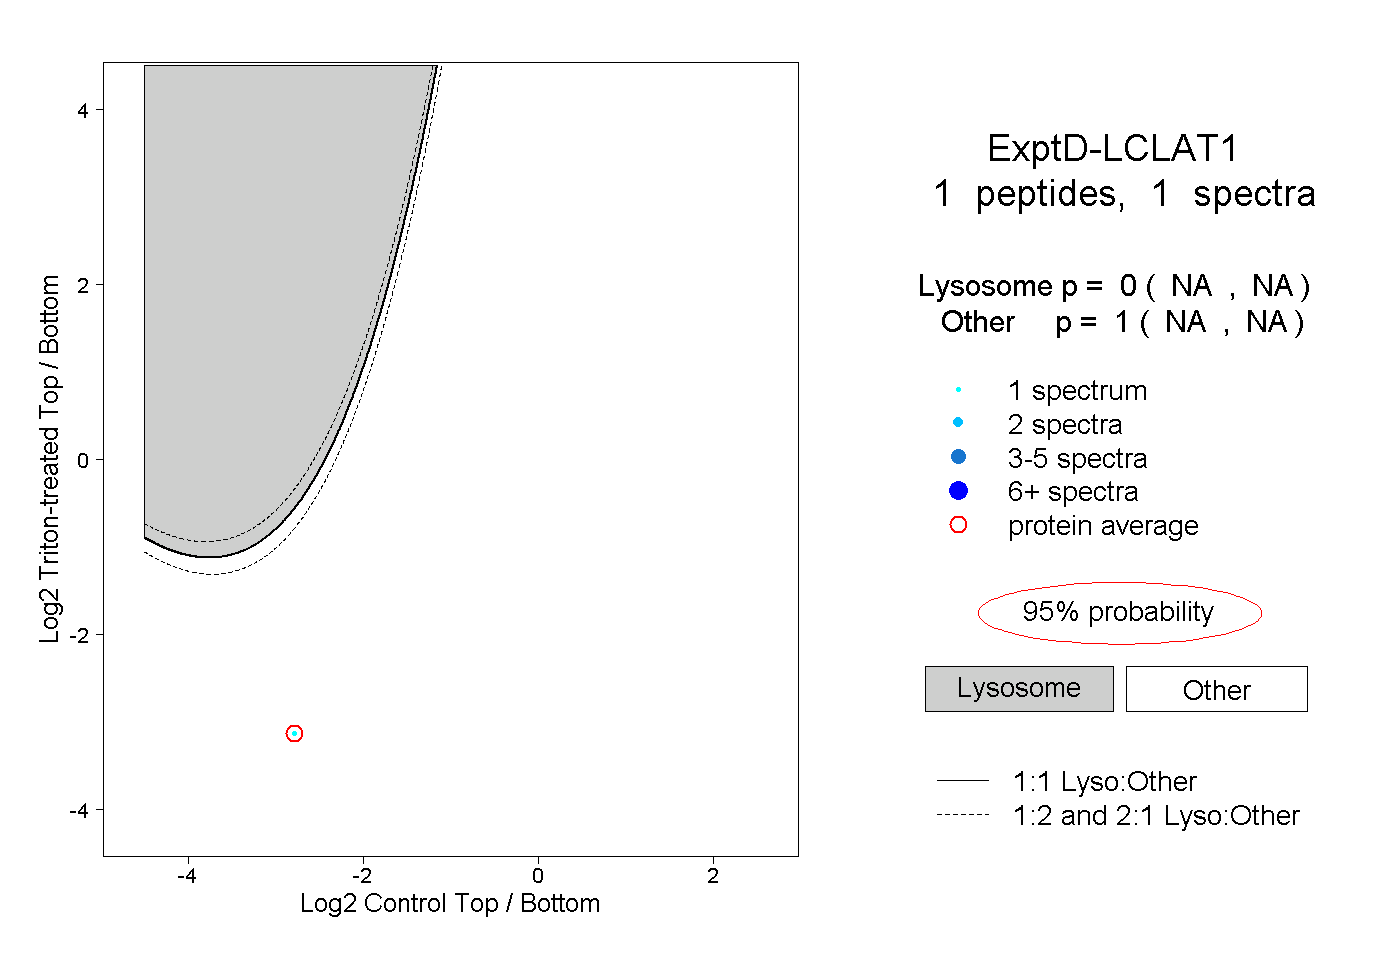 |
0.000 NA | NA |
1.000 NA | NA |