LCLAT1
[ENSRNOP00000050960]
Main page
| | | Plot |
Mito |
Lyso |
|
Perox |
ER |
Golgi |
PM |
Cytosol |
Nucleus |
|
| Expt A |
 9
9
peptides |
24
spectra |
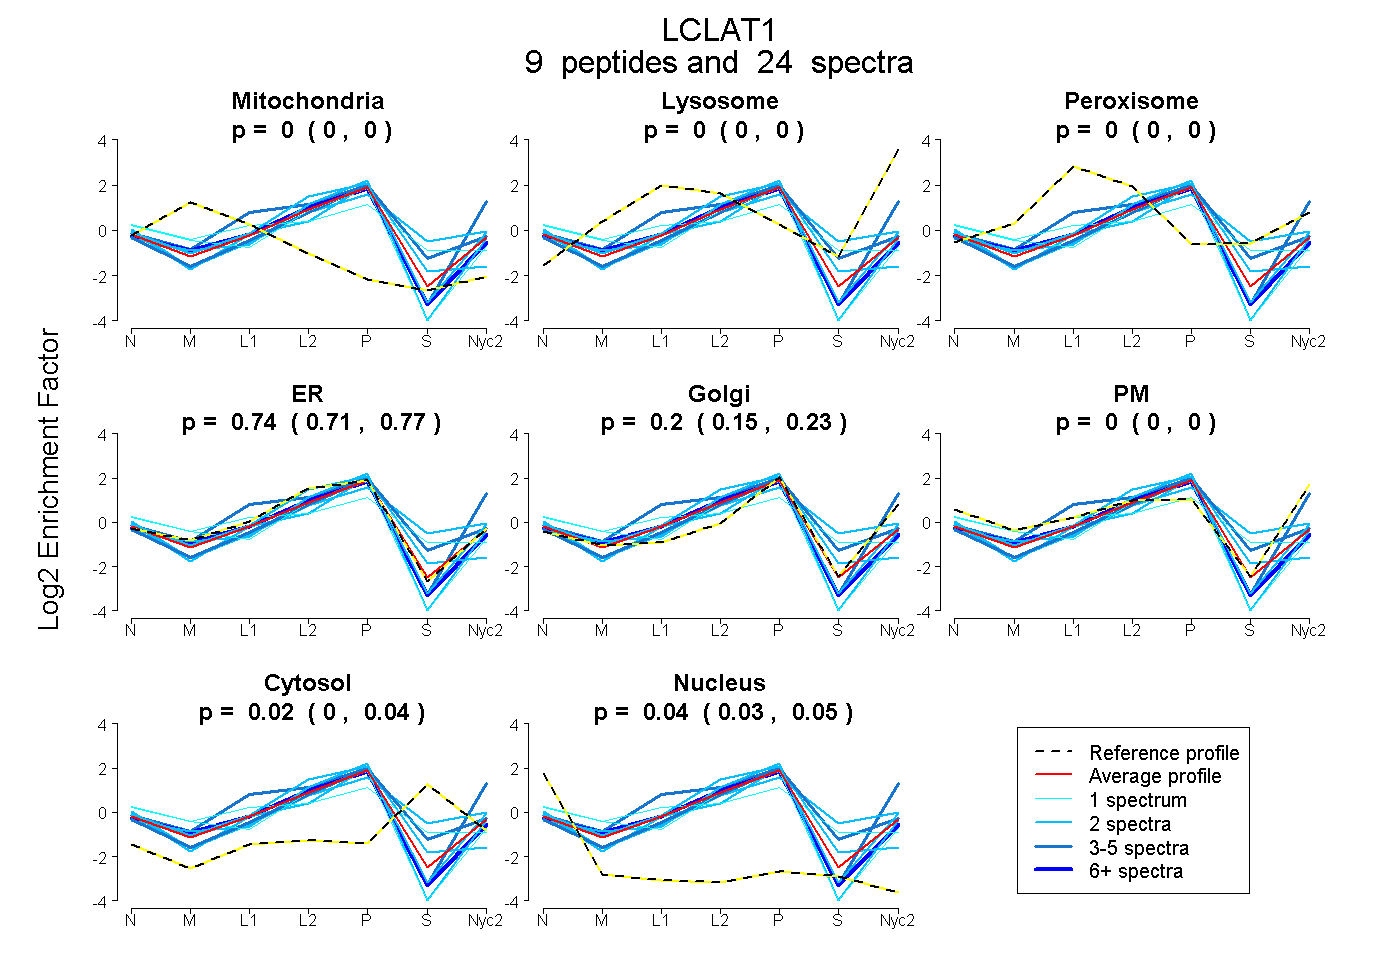 |
0.000
0.000 | 0.000 |
0.000
0.000 | 0.000 |
|
0.000
0.000 | 0.000 |
0.744
0.710 | 0.772 |
0.198
0.155 | 0.231 |
0.000
0.000 | 0.000 |
0.016
0.000 | 0.042 |
0.042
0.025 | 0.054 |
|
| | | Plot |
Mito |
|
Lyso or Perox |
|
ER |
Golgi |
PM |
Cytosol |
Nucleus |
|
| Expt B |
6
peptides |
12
spectra |
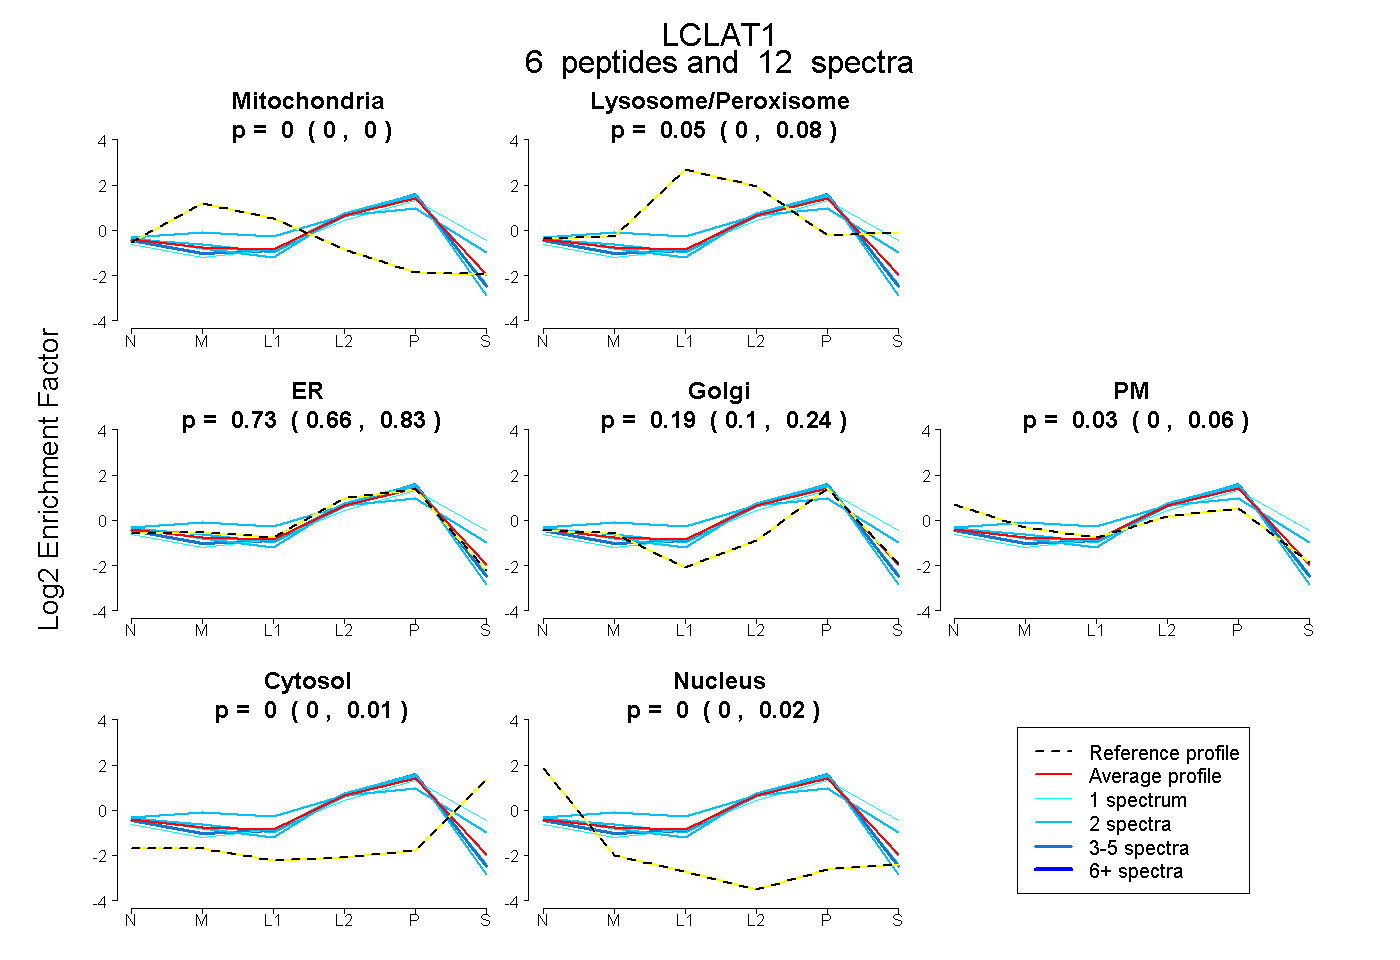 |
0.000
0.000 | 0.000 |
|
0.047
0.001 | 0.080 |
|
0.728
0.661 | 0.832 |
0.193
0.099 | 0.242 |
0.033
0.000 | 0.059 |
0.000
0.000 | 0.011 |
0.000
0.000 | 0.018 |
|
| 2 spectra, EIHFHVHR |
0.000 |
|
0.000 |
|
0.820 |
0.162 |
0.012 |
0.000 |
0.005 |
|
| 2 spectra, SVIIMNHR |
0.000 |
|
0.373 |
|
0.146 |
0.457 |
0.025 |
0.000 |
0.000 |
|
| 2 spectra, YEYVLHPR |
0.000 |
|
0.007 |
|
0.793 |
0.117 |
0.083 |
0.000 |
0.000 |
|
| 2 spectra, TTGFTFVVDR |
0.000 |
|
0.000 |
|
0.855 |
0.126 |
0.000 |
0.000 |
0.019 |
|
| 3 spectra, HLLLGDFPK |
0.000 |
|
0.000 |
|
0.880 |
0.109 |
0.000 |
0.000 |
0.011 |
|
| 1 spectrum, SNDFAEK |
0.000 |
|
0.165 |
|
0.449 |
0.205 |
0.000 |
0.181 |
0.000 |
|
| | | Plot |
|
Lyso |
|
|
|
|
|
|
|
Other |
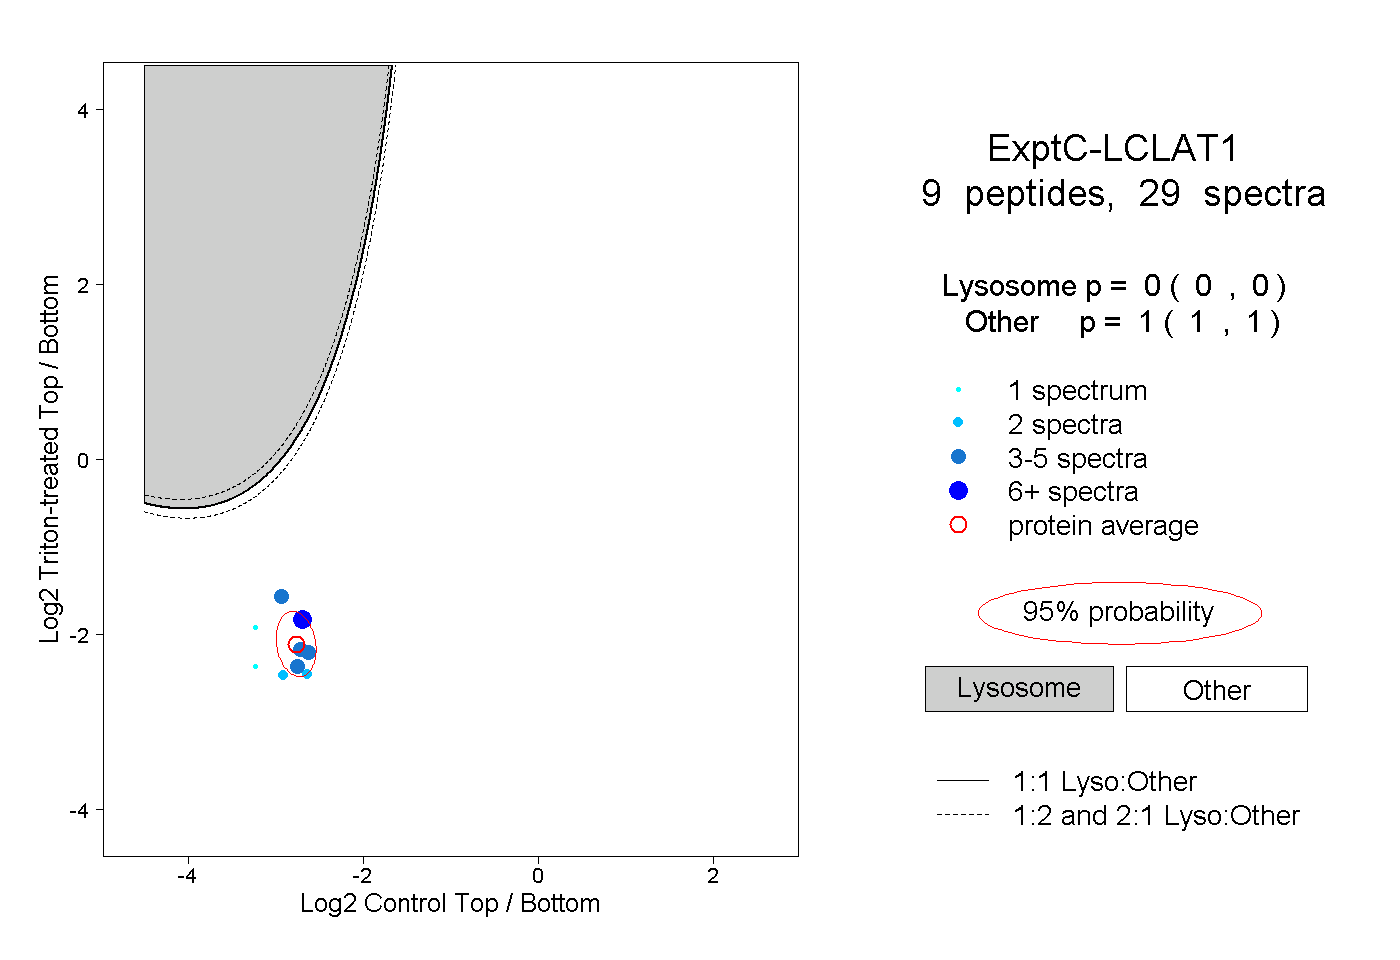
| Expt C |
9
peptides |
29
spectra |
 |
|
0.000
0.000 | 0.000 |
|
|
|
|
|
|
|
1.000
1.000 | 1.000 |
| | | Plot |
|
Lyso |
|
|
|
|
|
|
|
Other |
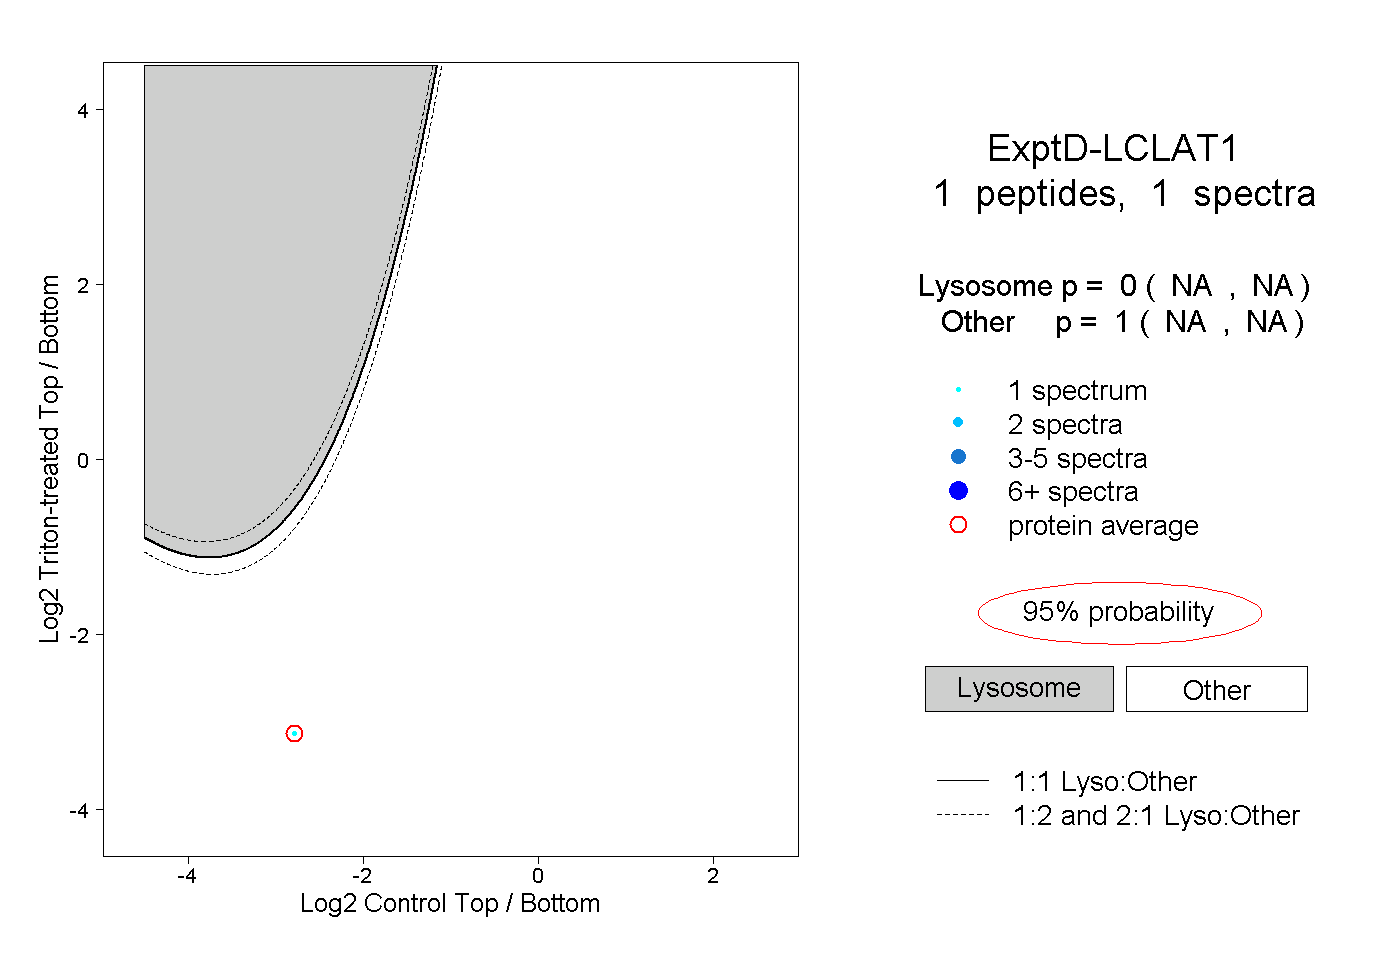
| Expt D |
1
peptide |
1
spectrum |
 |
|
0.000
NA | NA |
|
|
|
|
|
|
|
1.000
NA | NA |