 10
10peptides
spectra
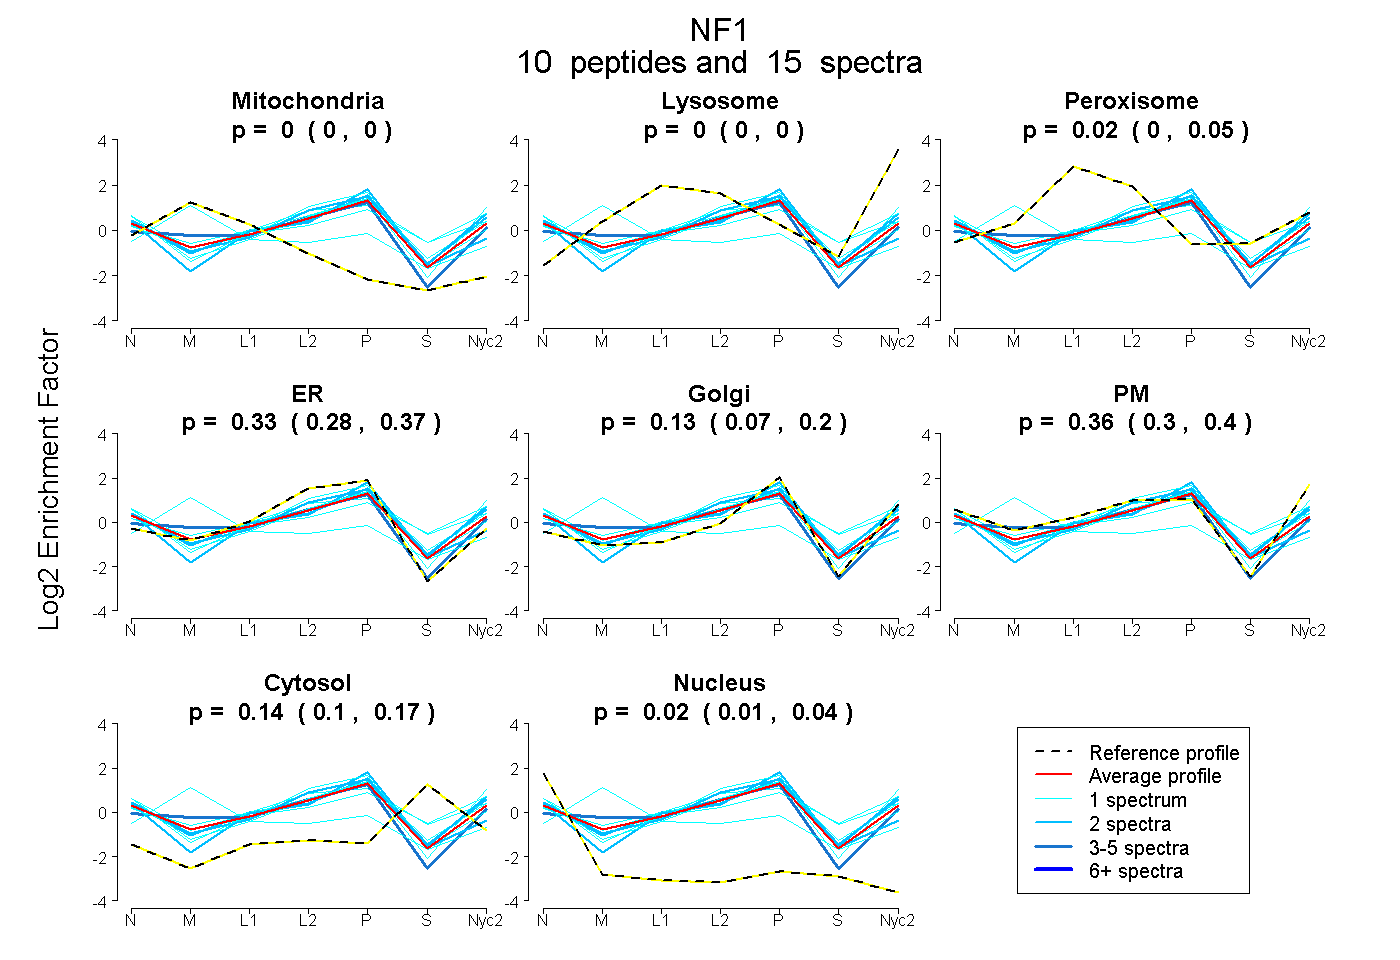
0.000 | 0.000
0.000 | 0.000
0.000 | 0.047
0.279 | 0.365
0.071 | 0.196
0.304 | 0.401
0.096 | 0.168
0.006 | 0.038
12peptides
spectra
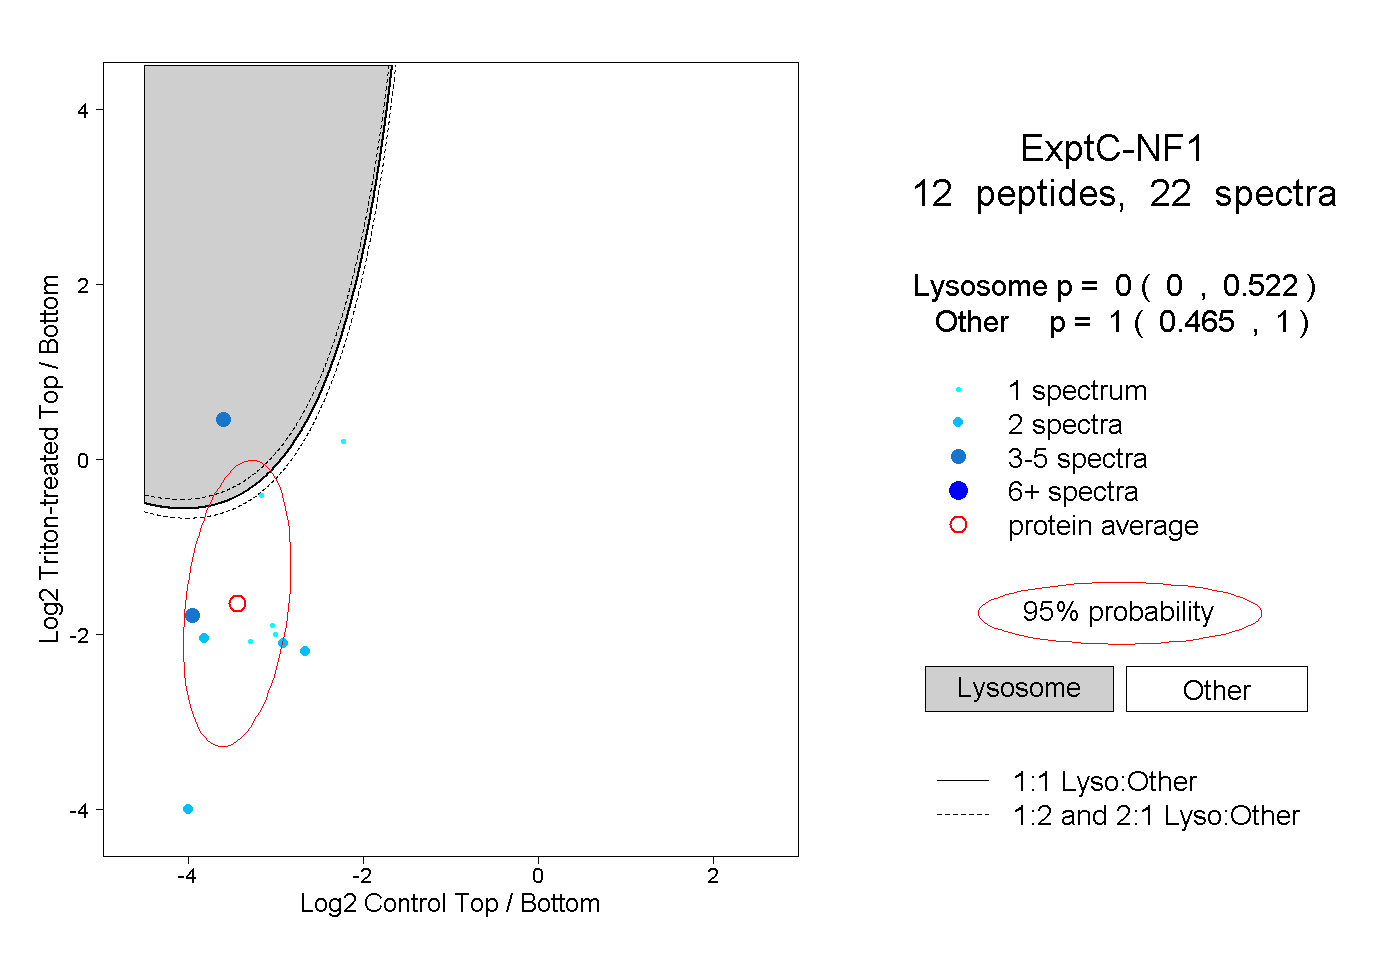
0.000 | 0.522
0.465 | 1.000
2peptides
spectra
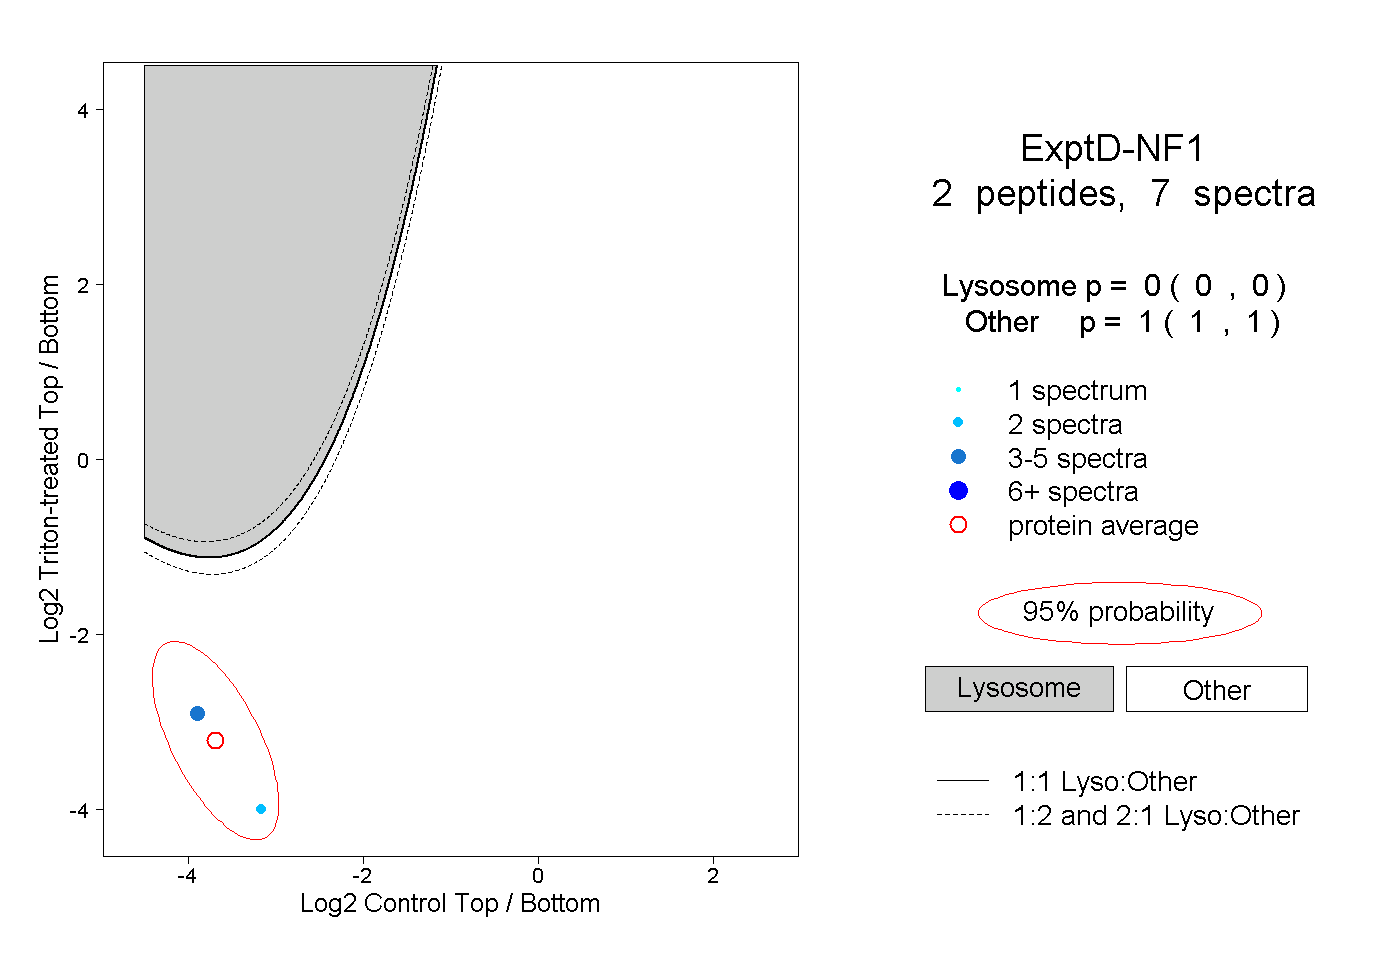
0.000 | 0.000
1.000 | 1.000