 10
10peptides
spectra
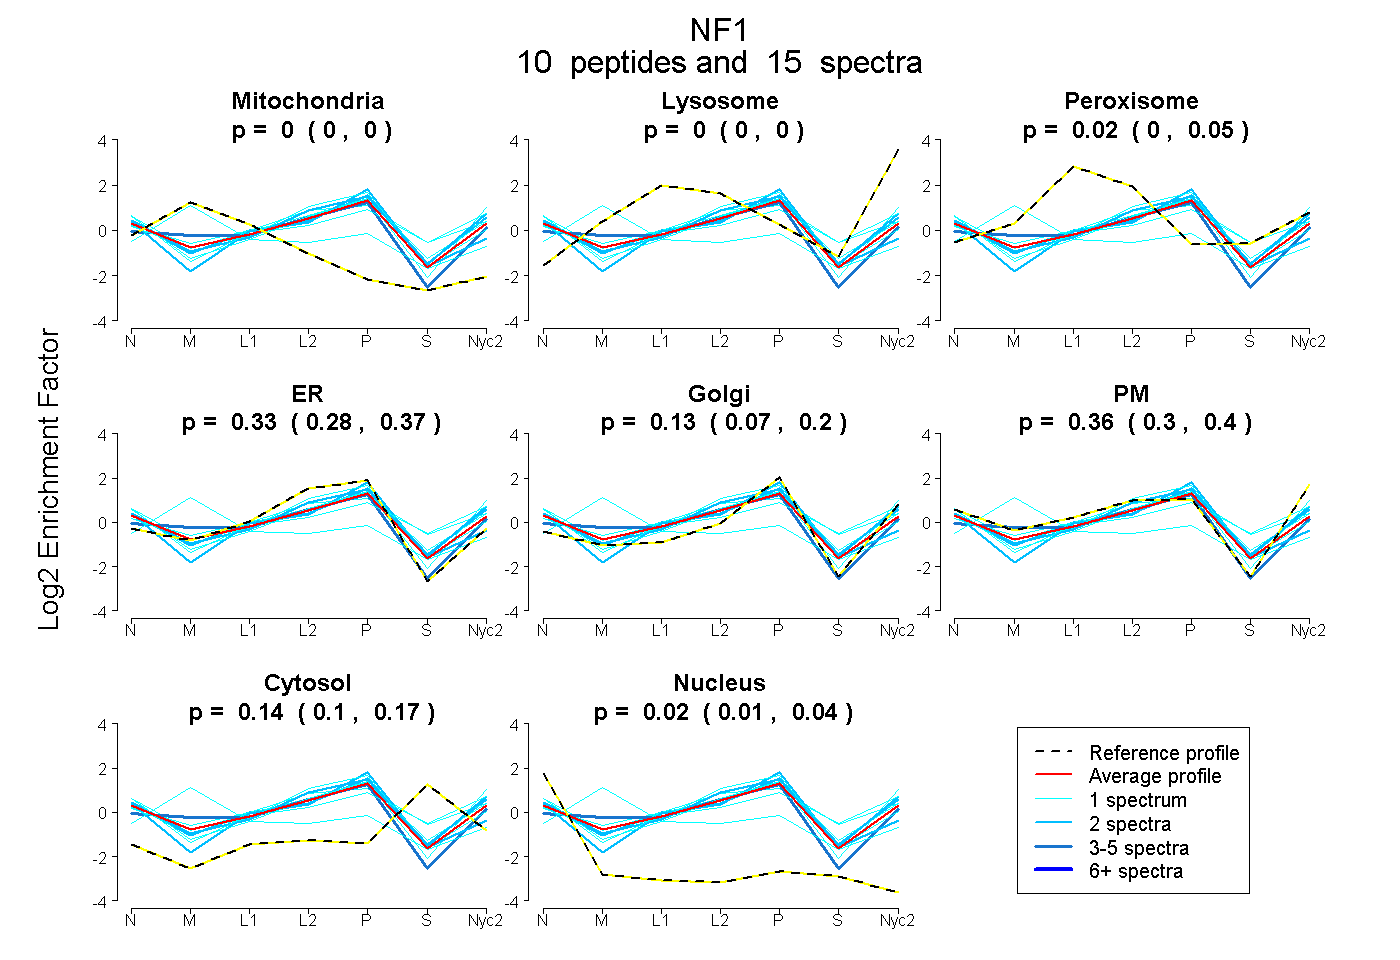
0.000 | 0.000
0.000 | 0.000
0.000 | 0.047
0.279 | 0.365
0.071 | 0.196
0.304 | 0.401
0.096 | 0.168
0.006 | 0.038
| Plot | Mito | Lyso | Perox | ER | Golgi | PM | Cytosol | Nucleus | |||||
| Expt A |
10 peptides |
15 spectra |
|
0.000 0.000 | 0.000 |
0.000 0.000 | 0.000 |
0.016 0.000 | 0.047 |
0.332 0.279 | 0.365 |
0.128 0.071 | 0.196 |
0.363 0.304 | 0.401 |
0.139 0.096 | 0.168 |
0.022 0.006 | 0.038 |
| 2 spectra, VGSTAVQVTSAER | 0.000 | 0.000 | 0.000 | 0.279 | 0.120 | 0.474 | 0.128 | 0.000 | ||
| 1 spectrum, VGLQIR | 0.000 | 0.000 | 0.000 | 0.280 | 0.107 | 0.406 | 0.197 | 0.009 | ||
| 1 spectrum, LEPSESLEENQR | 0.000 | 0.000 | 0.138 | 0.268 | 0.007 | 0.351 | 0.236 | 0.000 | ||
| 1 spectrum, NMFGETLHK | 0.546 | 0.079 | 0.000 | 0.000 | 0.334 | 0.000 | 0.042 | 0.000 | ||
| 3 spectra, LLGTR | 0.158 | 0.000 | 0.000 | 0.352 | 0.274 | 0.216 | 0.000 | 0.000 | ||
| 1 spectrum, EKPTDLEAR | 0.000 | 0.000 | 0.000 | 0.120 | 0.169 | 0.646 | 0.041 | 0.023 | ||
| 1 spectrum, YTTDEFDQR | 0.000 | 0.000 | 0.000 | 0.020 | 0.000 | 0.646 | 0.333 | 0.000 | ||
| 1 spectrum, NLLFNPSKPFSR | 0.000 | 0.000 | 0.000 | 0.615 | 0.025 | 0.227 | 0.132 | 0.000 | ||
| 2 spectra, LLLCNPR | 0.000 | 0.000 | 0.000 | 0.575 | 0.223 | 0.009 | 0.150 | 0.043 | ||
| 2 spectra, AGNPIFYYVAR | 0.000 | 0.000 | 0.025 | 0.210 | 0.232 | 0.391 | 0.142 | 0.000 |
| Plot | Lyso | Other | |||||||||||
| Expt C |
12 peptides |
22 spectra |
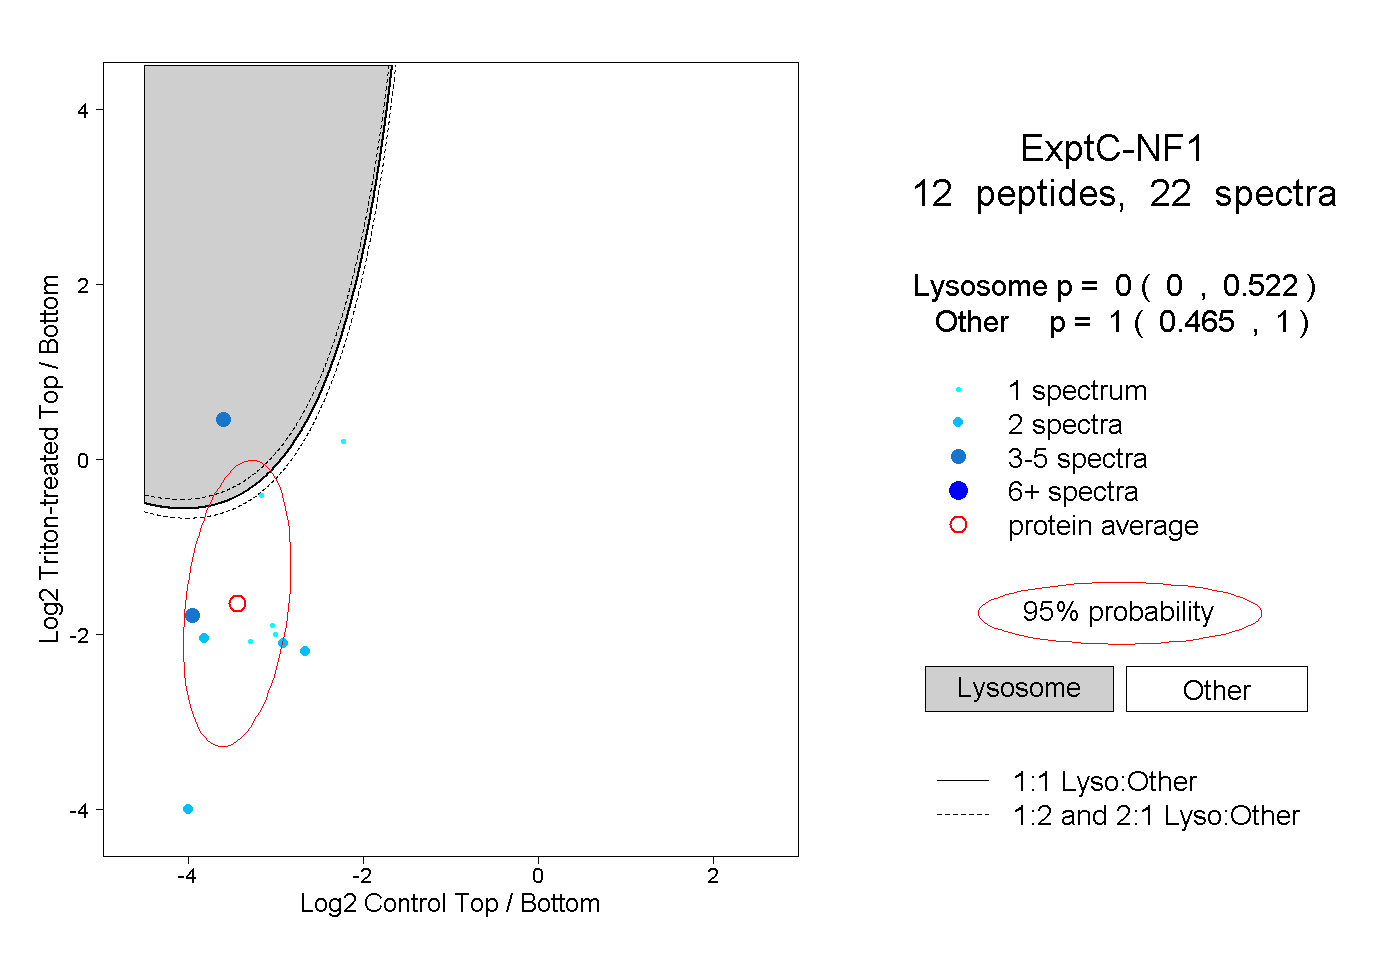 |
0.000 0.000 | 0.522 |
1.000 0.465 | 1.000 |
||||||||
| Plot | Lyso | Other | |||||||||||
| Expt D |
2 peptides |
7 spectra |
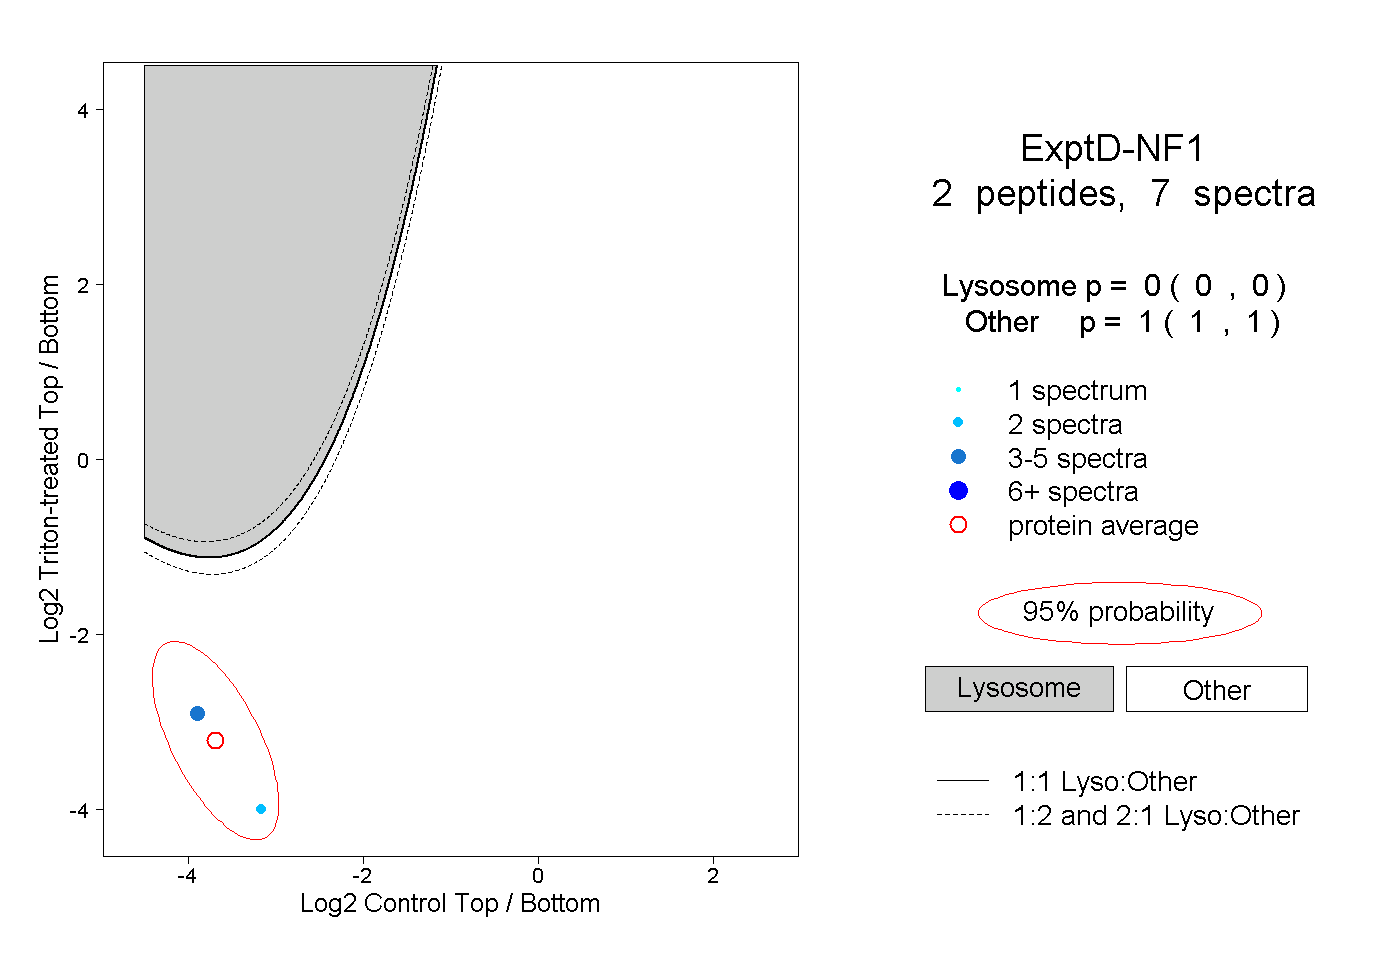 |
0.000 0.000 | 0.000 |
1.000 1.000 | 1.000 |