 10
10peptides
spectra
0.000 | 0.000
0.000 | 0.000
0.000 | 0.047
0.279 | 0.365
0.071 | 0.196
0.304 | 0.401
0.096 | 0.168
0.006 | 0.038
12peptides
spectra
0.000 | 0.522
0.465 | 1.000
| Plot | Mito | Lyso | Perox | ER | Golgi | PM | Cytosol | Nucleus | |||||
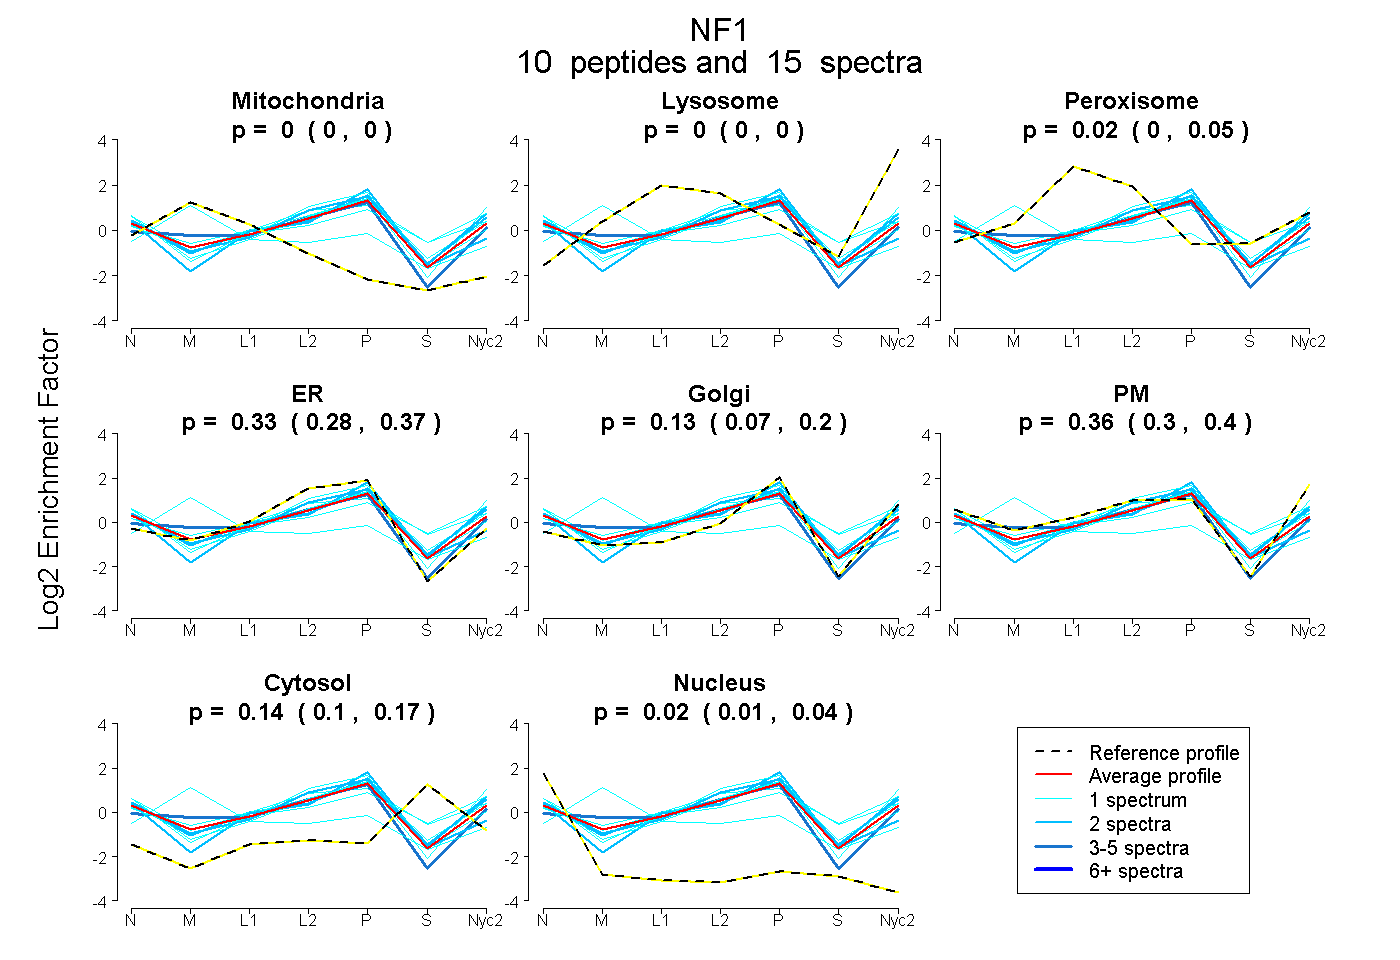
| Expt A |
10 peptides |
15 spectra |
|
0.000 0.000 | 0.000 |
0.000 0.000 | 0.000 |
0.016 0.000 | 0.047 |
0.332 0.279 | 0.365 |
0.128 0.071 | 0.196 |
0.363 0.304 | 0.401 |
0.139 0.096 | 0.168 |
0.022 0.006 | 0.038 |
||
| Plot | Lyso | Other | |||||||||||
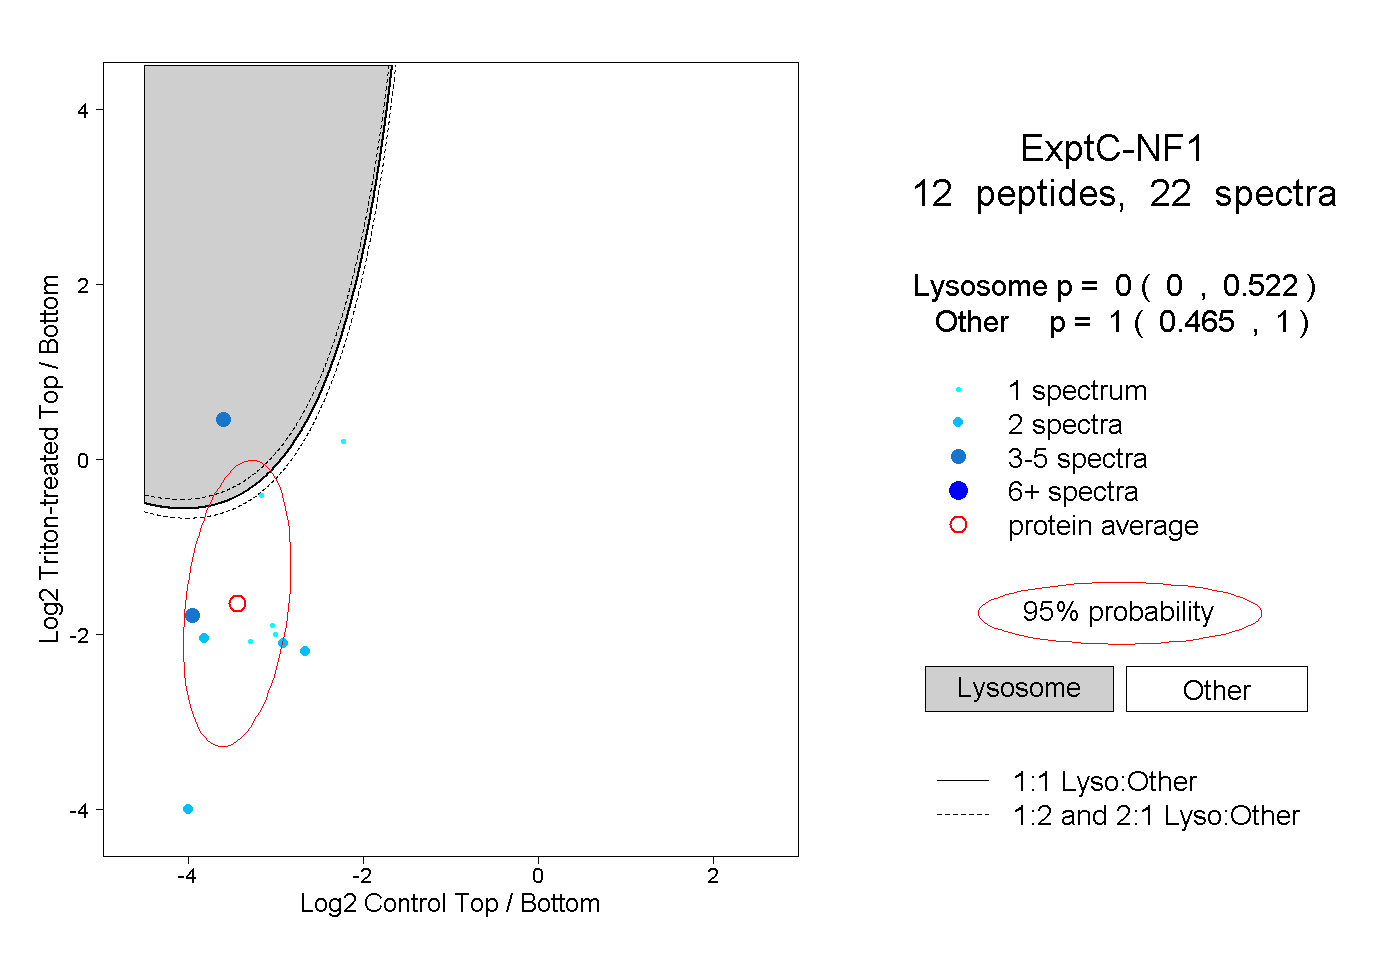
| Expt C |
12 peptides |
22 spectra |
|
0.000 0.000 | 0.522 |
1.000 0.465 | 1.000 |
| 1 spectrum, LILNYPK | 0.000 | 1.000 | ||||||||
| 4 spectra, LFLDSLR | 1.000 | 0.000 | ||||||||
| 1 spectrum, IFGEAAEK | 0.139 | 0.861 | ||||||||
| 1 spectrum, VAETDYEMETQR | 0.000 | 1.000 | ||||||||
| 2 spectra, LQPLLNK | 0.000 | 1.000 | ||||||||
| 2 spectra, IQPILDK | 0.000 | 1.000 | ||||||||
| 1 spectrum, SPEEVFMAIR | 0.000 | 1.000 | ||||||||
| 1 spectrum, LLGTR | 0.000 | 1.000 | ||||||||
| 4 spectra, FAGPFSK | 0.000 | 1.000 | ||||||||
| 2 spectra, SQLFLK | 0.000 | 1.000 | ||||||||
| 1 spectrum, LLLCNPR | 0.000 | 1.000 | ||||||||
| 2 spectra, SAGFSK | 0.000 | 1.000 |
| Plot | Lyso | Other | |||||||||||
| Expt D |
2 peptides |
7 spectra |
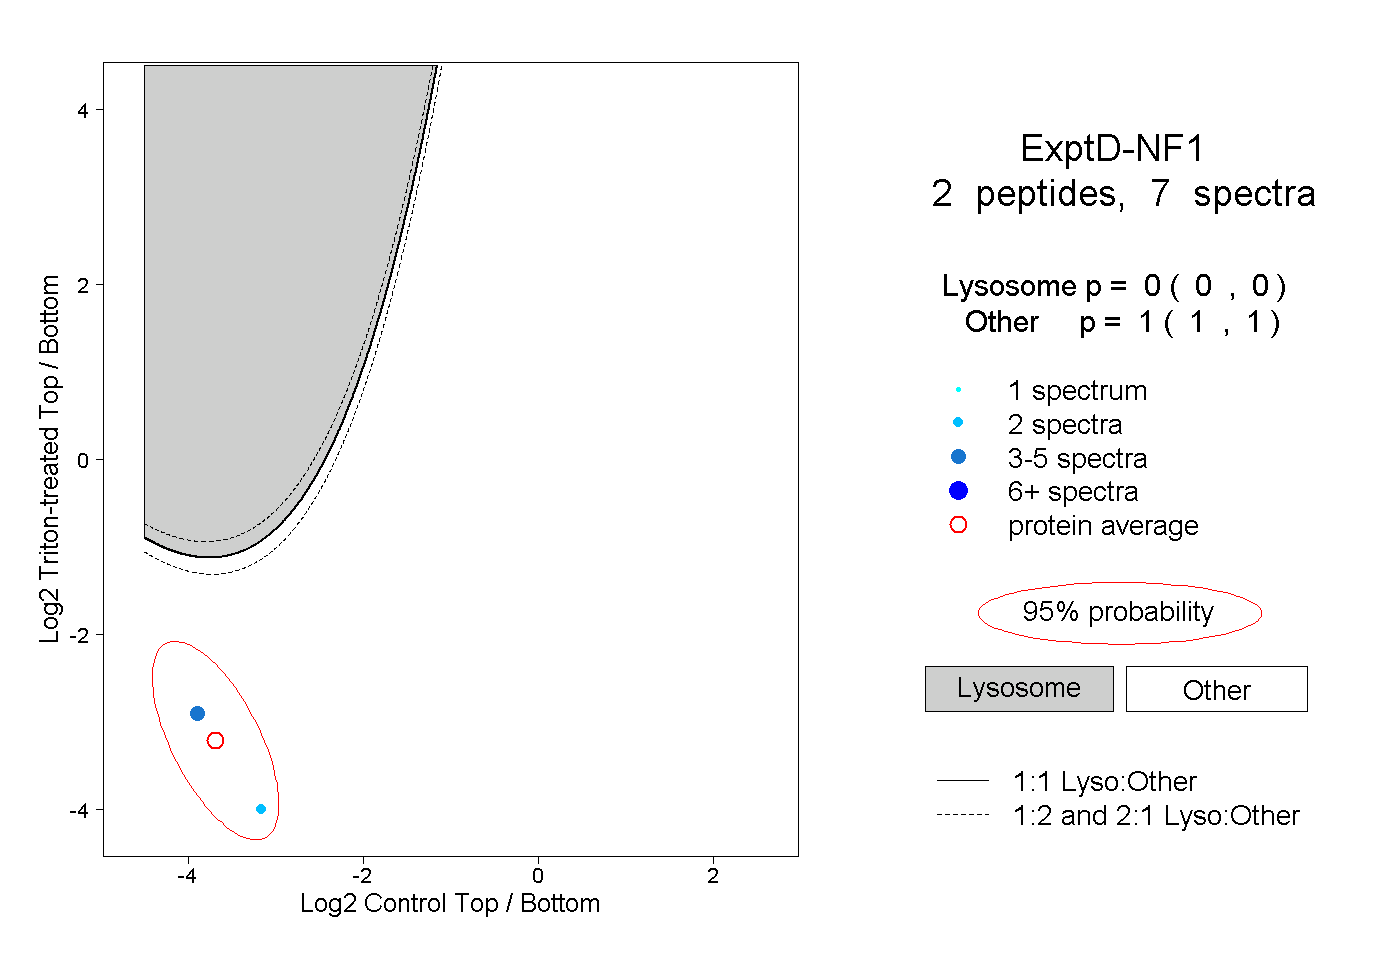 |
0.000 0.000 | 0.000 |
1.000 1.000 | 1.000 |