 10
10peptides
spectra
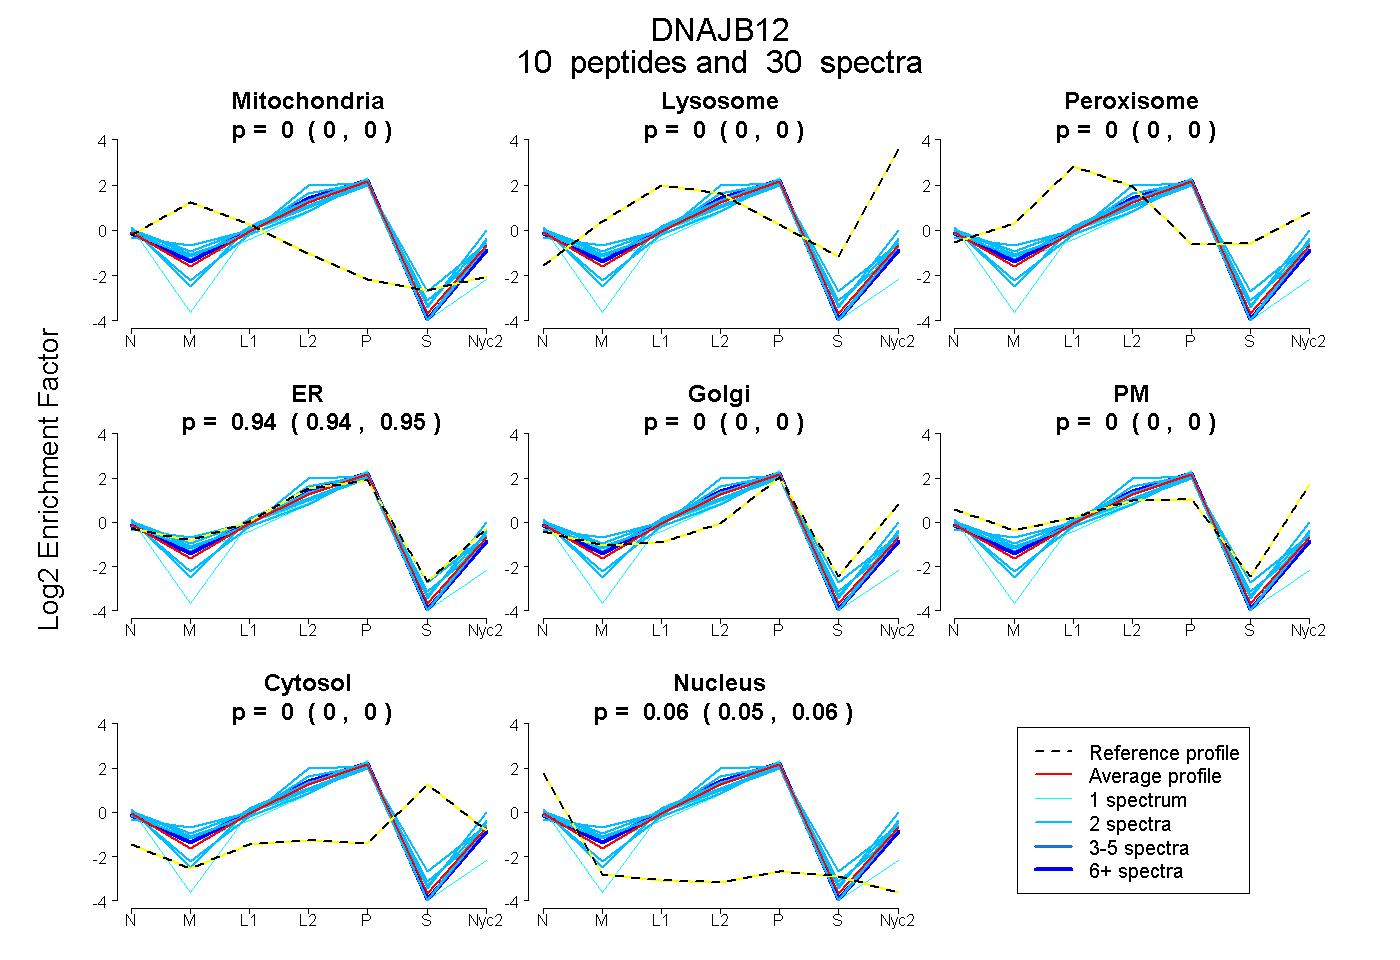
0.000 | 0.000
0.000 | 0.000
0.000 | 0.000
0.936 | 0.945
0.000 | 0.000
0.000 | 0.000
0.000 | 0.000
0.054 | 0.063
4peptides
spectra
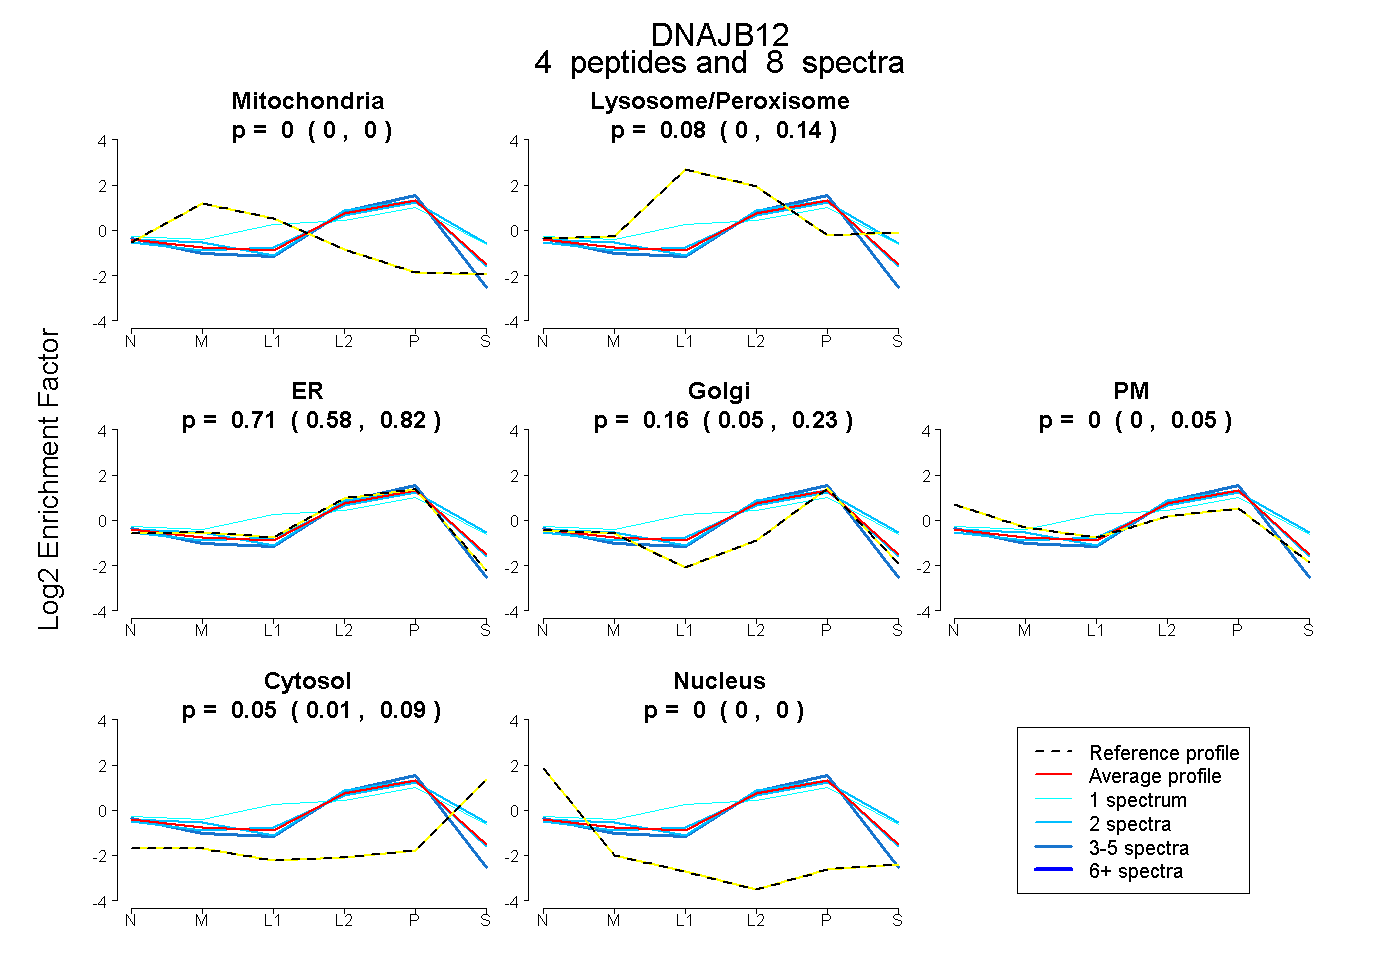
0.000 | 0.000
0.000 | 0.141
0.575 | 0.818
0.050 | 0.228
0.000 | 0.051
0.010 | 0.087
0.000 | 0.000
6peptides
spectra
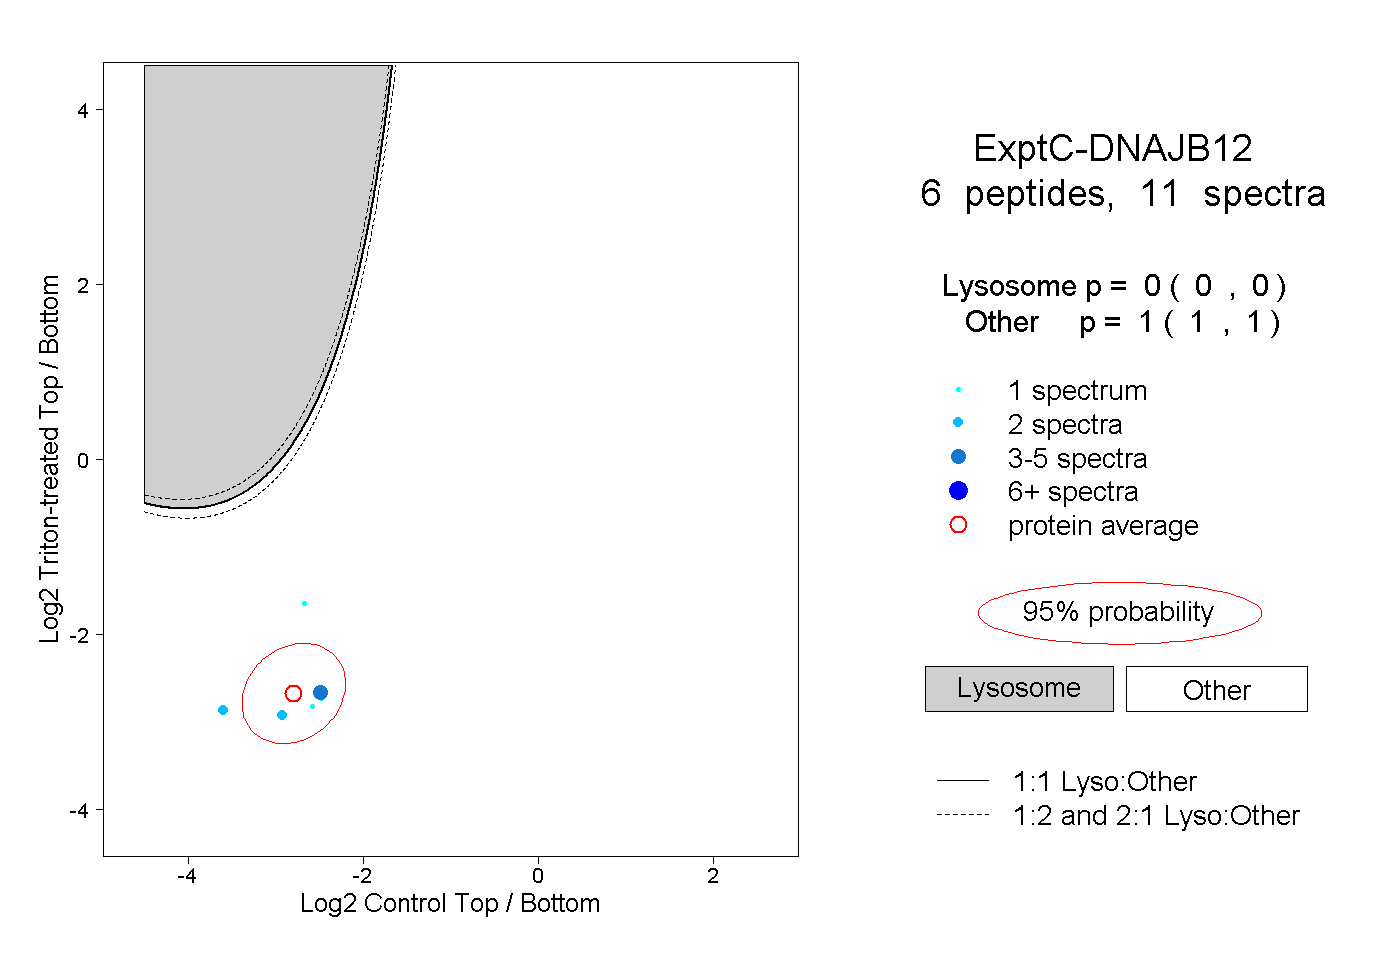
0.000 | 0.000
1.000 | 1.000
1peptide
spectra
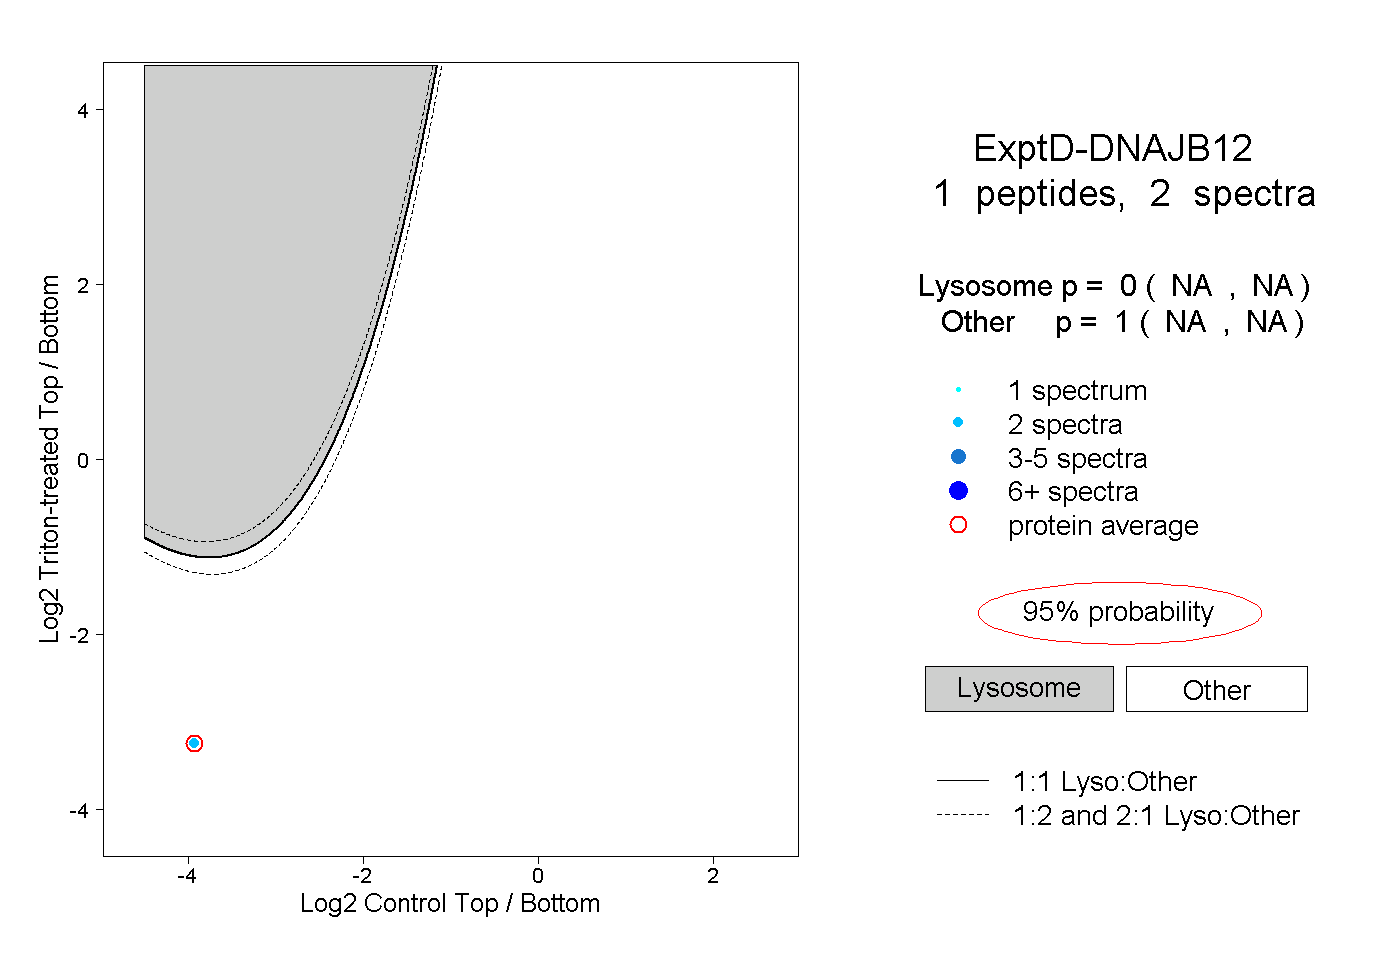
NA | NA
NA | NA