DNAJB12
[ENSRNOP00000049600]
Main page
| | | Plot |
Mito |
Lyso |
|
Perox |
ER |
Golgi |
PM |
Cytosol |
Nucleus |
|
| Expt A |
 10
10
peptides |
30
spectra |
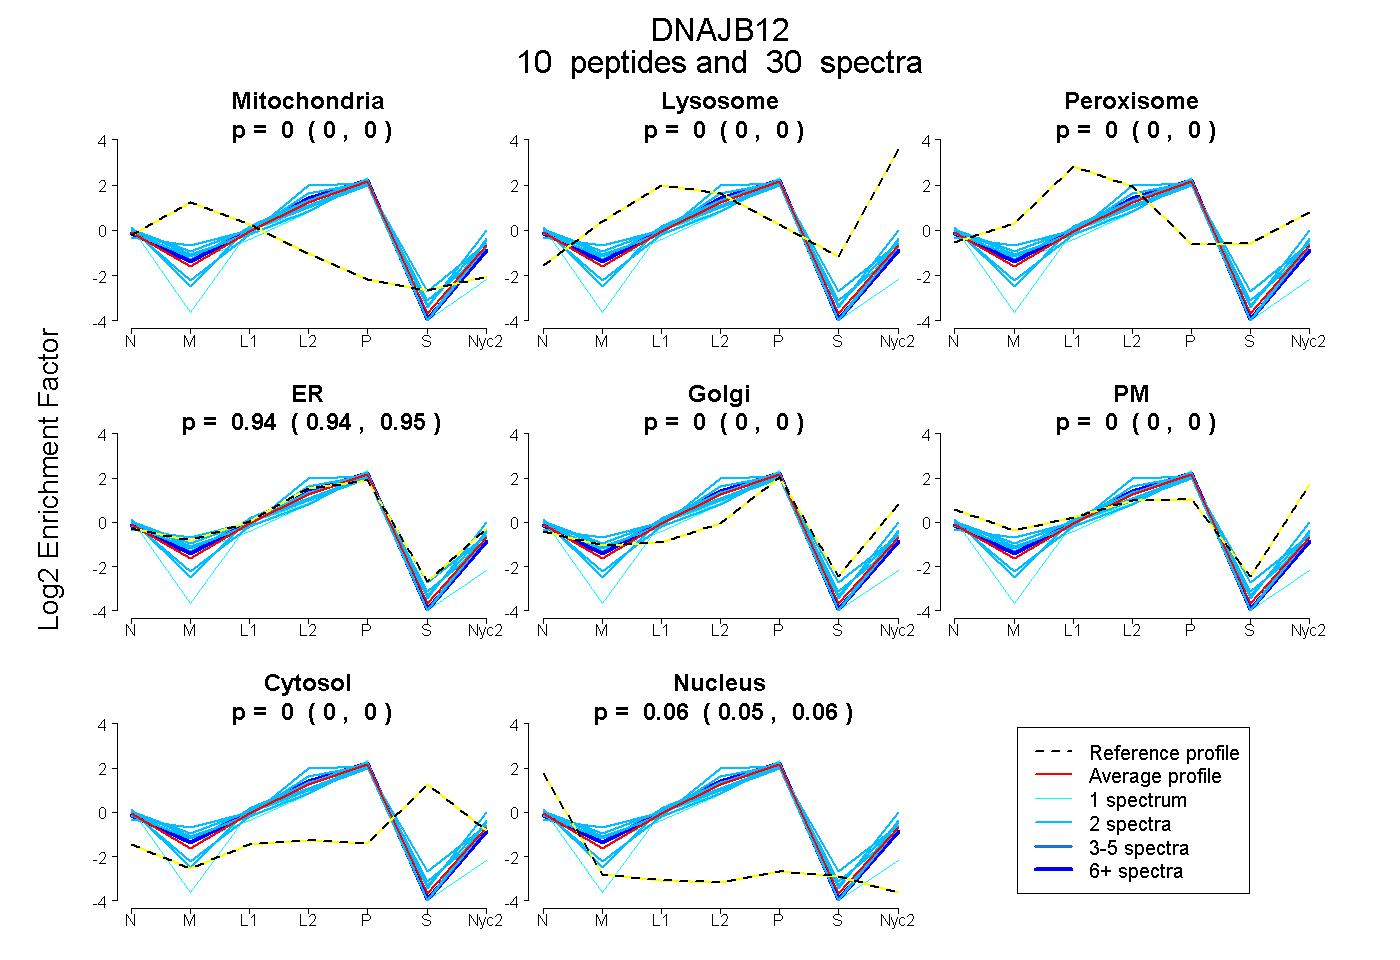 |
0.000
0.000 | 0.000 |
0.000
0.000 | 0.000 |
|
0.000
0.000 | 0.000 |
0.941
0.936 | 0.945 |
0.000
0.000 | 0.000 |
0.000
0.000 | 0.000 |
0.000
0.000 | 0.000 |
0.059
0.054 | 0.063 |
|
| | | Plot |
Mito |
|
Lyso or Perox |
|
ER |
Golgi |
PM |
Cytosol |
Nucleus |
|
| Expt B |
4
peptides |
8
spectra |
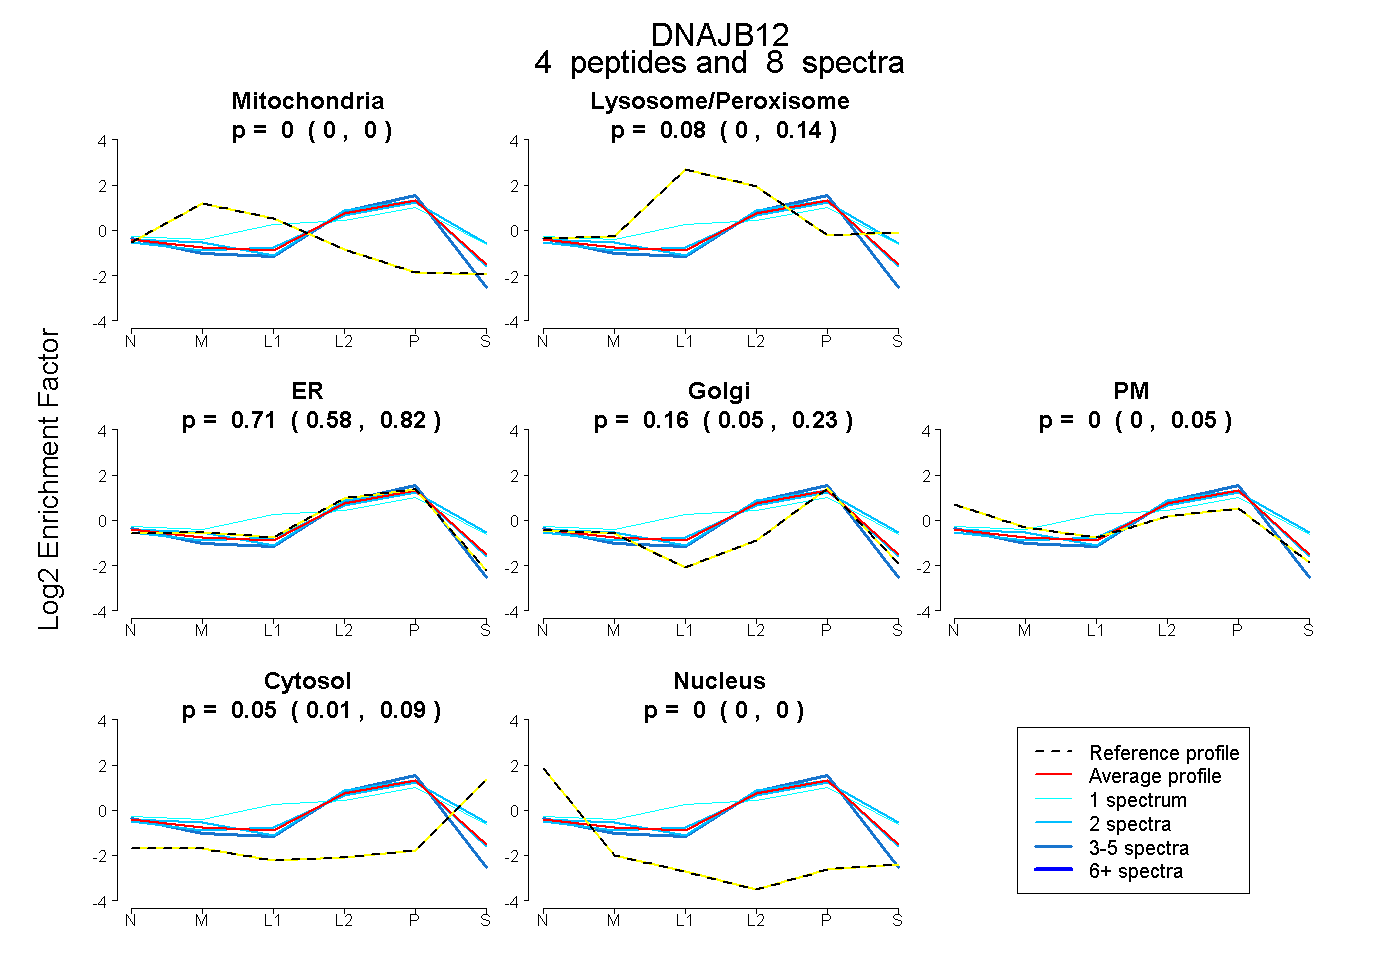 |
0.000
0.000 | 0.000 |
|
0.082
0.000 | 0.141 |
|
0.707
0.575 | 0.818 |
0.161
0.050 | 0.228 |
0.000
0.000 | 0.051 |
0.051
0.010 | 0.087 |
0.000
0.000 | 0.000 |
|
| 2 spectra, DYYEILGVSR |
0.000 |
|
0.000 |
|
0.834 |
0.039 |
0.065 |
0.062 |
0.000 |
|
| 2 spectra, LYPTPR |
0.000 |
|
0.183 |
|
0.494 |
0.175 |
0.000 |
0.149 |
0.000 |
|
| 3 spectra, AIQSNQPDR |
0.000 |
|
0.000 |
|
0.878 |
0.103 |
0.000 |
0.000 |
0.018 |
|
| 1 spectrum, NVEDDYIANLR |
0.000 |
|
0.487 |
|
0.000 |
0.513 |
0.000 |
0.000 |
0.000 |
|
| | | Plot |
|
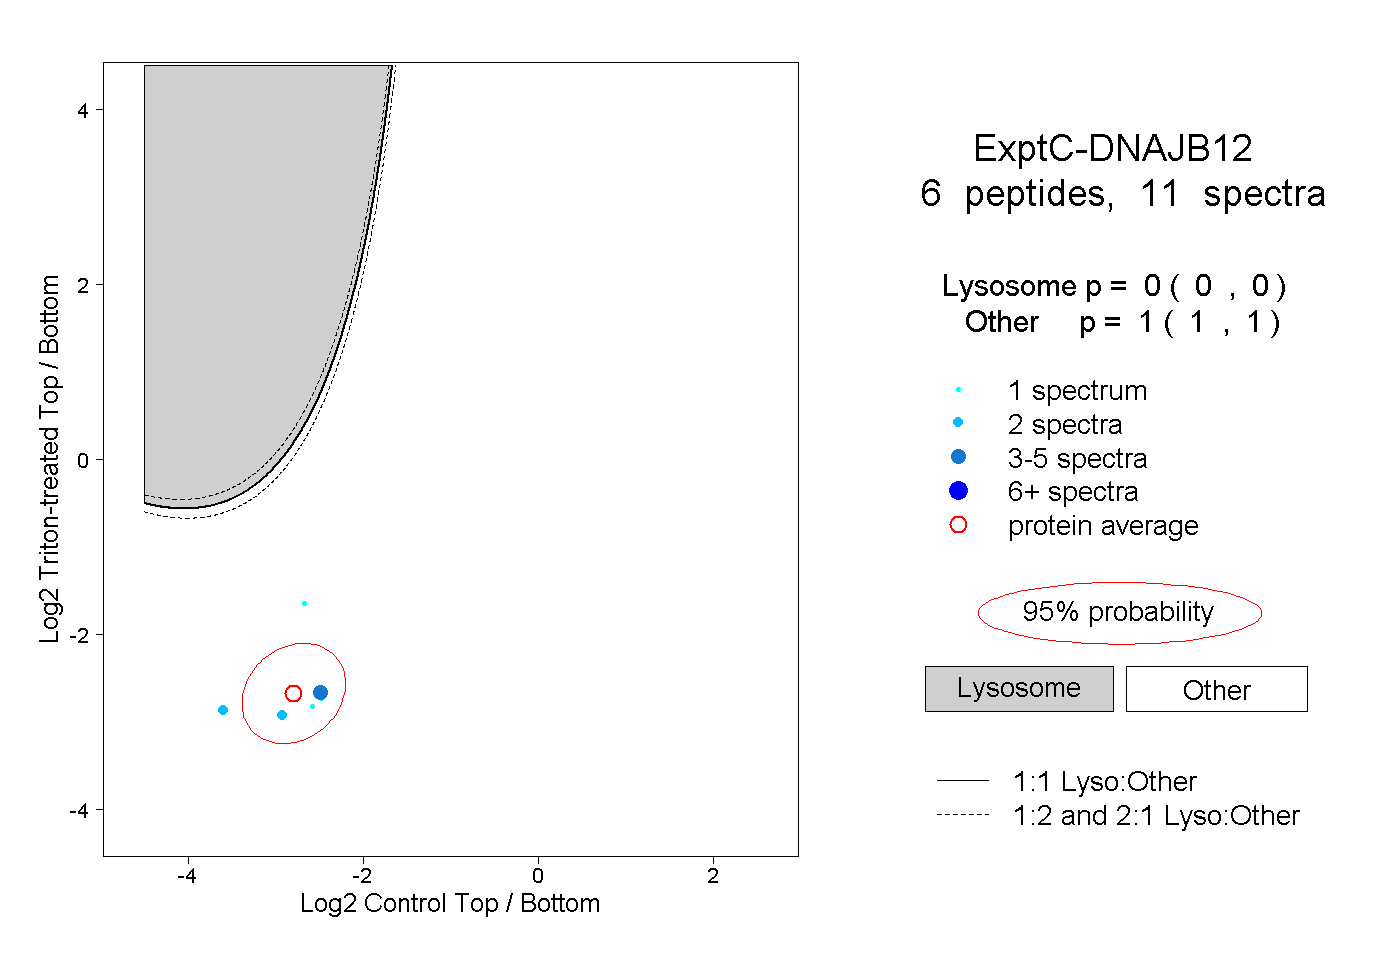
Lyso |
|
|
|
|
|
|
|
Other |
| Expt C |
6
peptides |
11
spectra |
 |
|
0.000
0.000 | 0.000 |
|
|
|
|
|
|
|
1.000
1.000 | 1.000 |
| | | Plot |
|
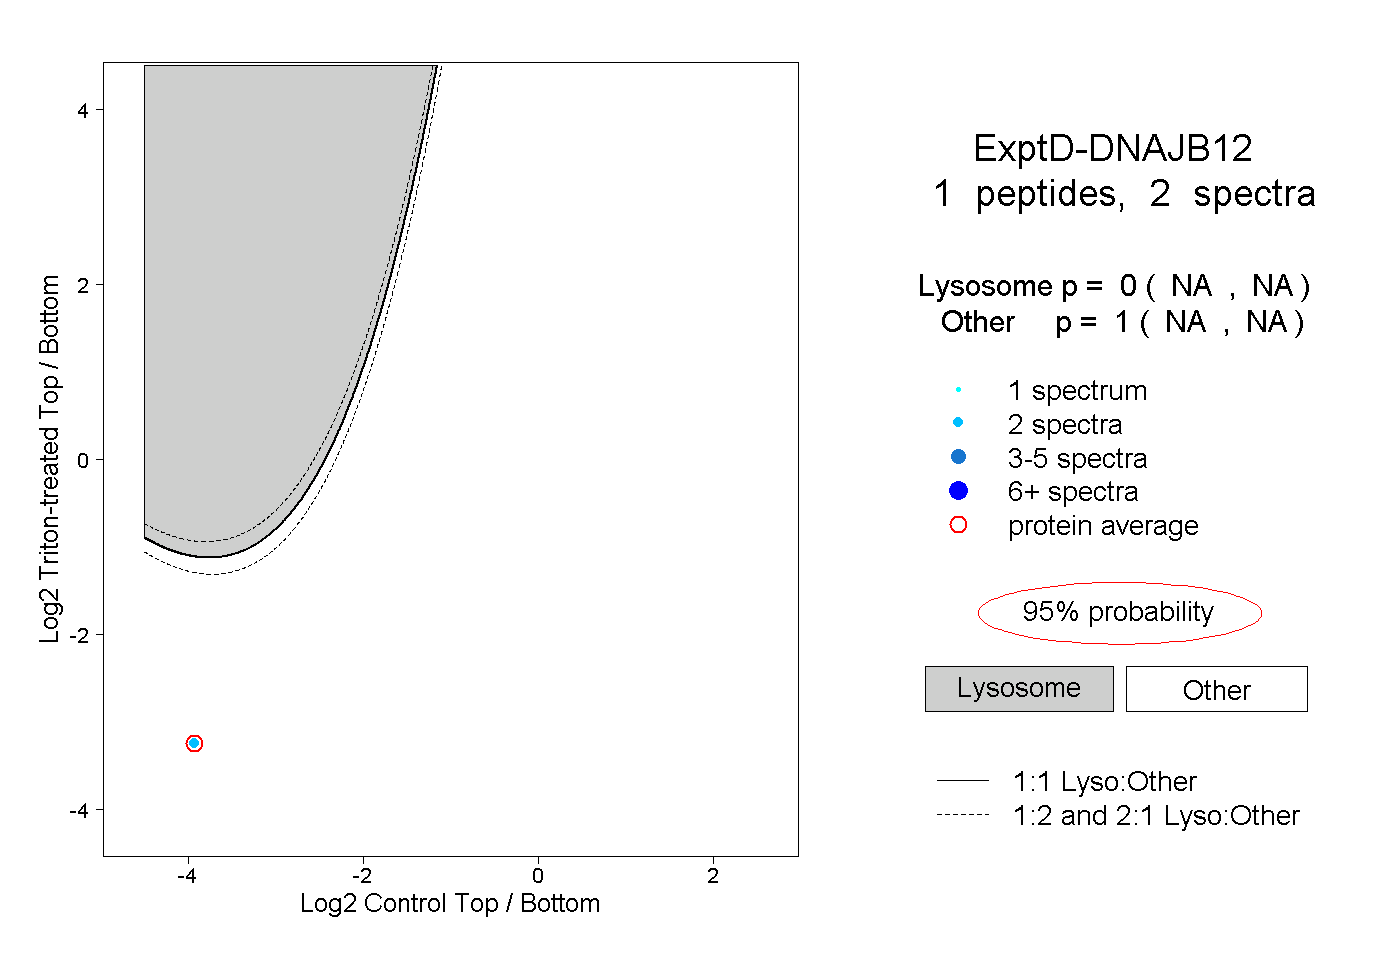
Lyso |
|
|
|
|
|
|
|
Other |
| Expt D |
1
peptide |
2
spectra |
 |
|
0.000
NA | NA |
|
|
|
|
|
|
|
1.000
NA | NA |