 9
9peptides
spectra
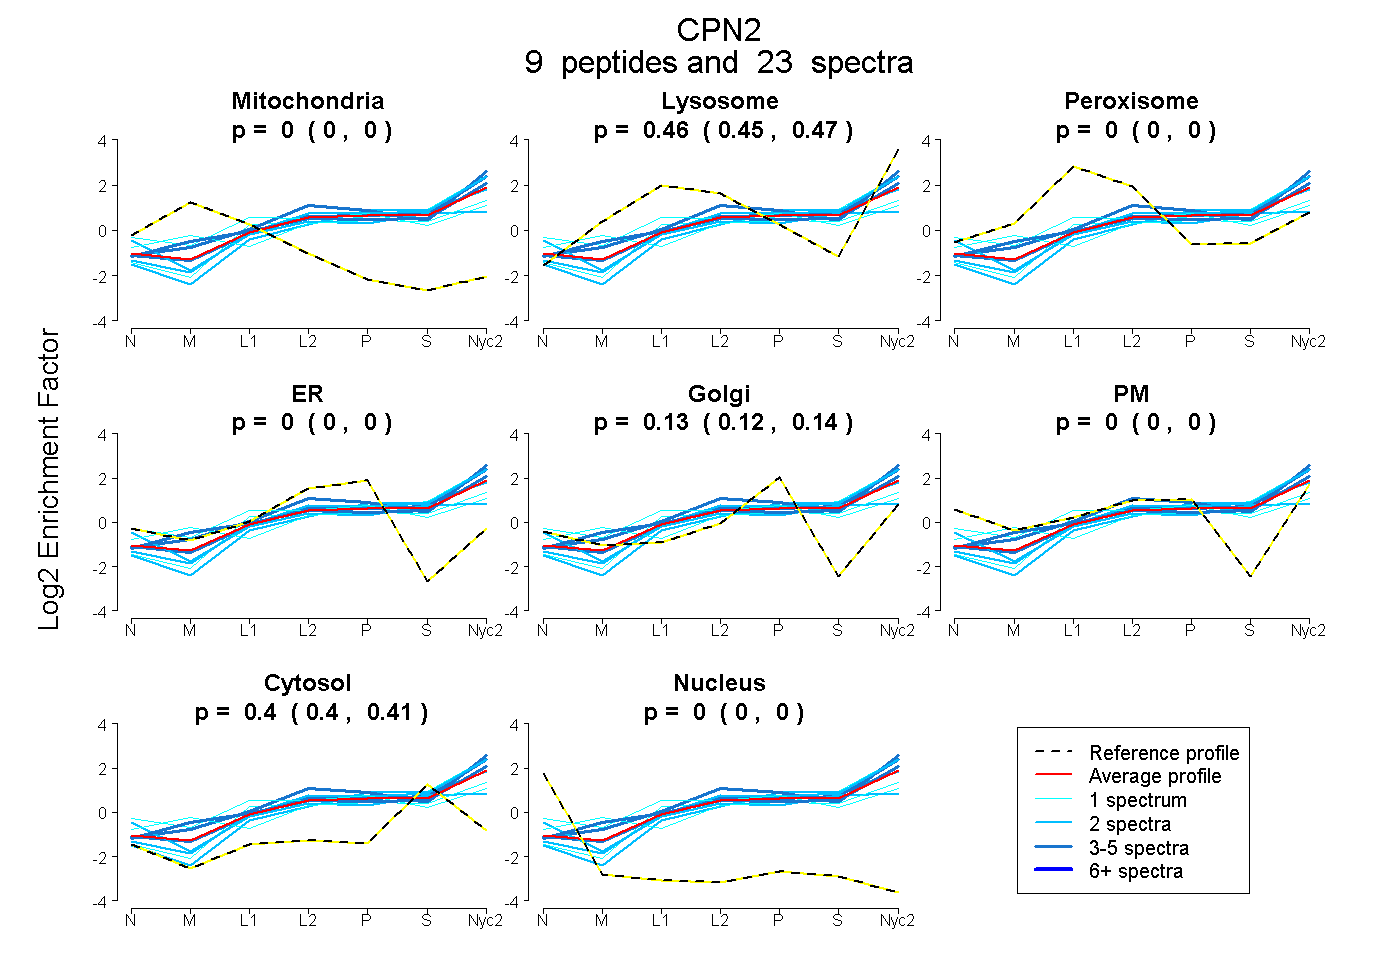
0.000 | 0.000
0.451 | 0.474
0.000 | 0.000
0.000 | 0.000
0.122 | 0.139
0.000 | 0.000
0.396 | 0.411
0.000 | 0.000
4peptides
spectra

0.000 | 0.000
0.274 | 0.285
0.333 | 0.347
0.000 | 0.000
0.000 | 0.000
0.375 | 0.383
0.000 | 0.000
9peptides
spectra
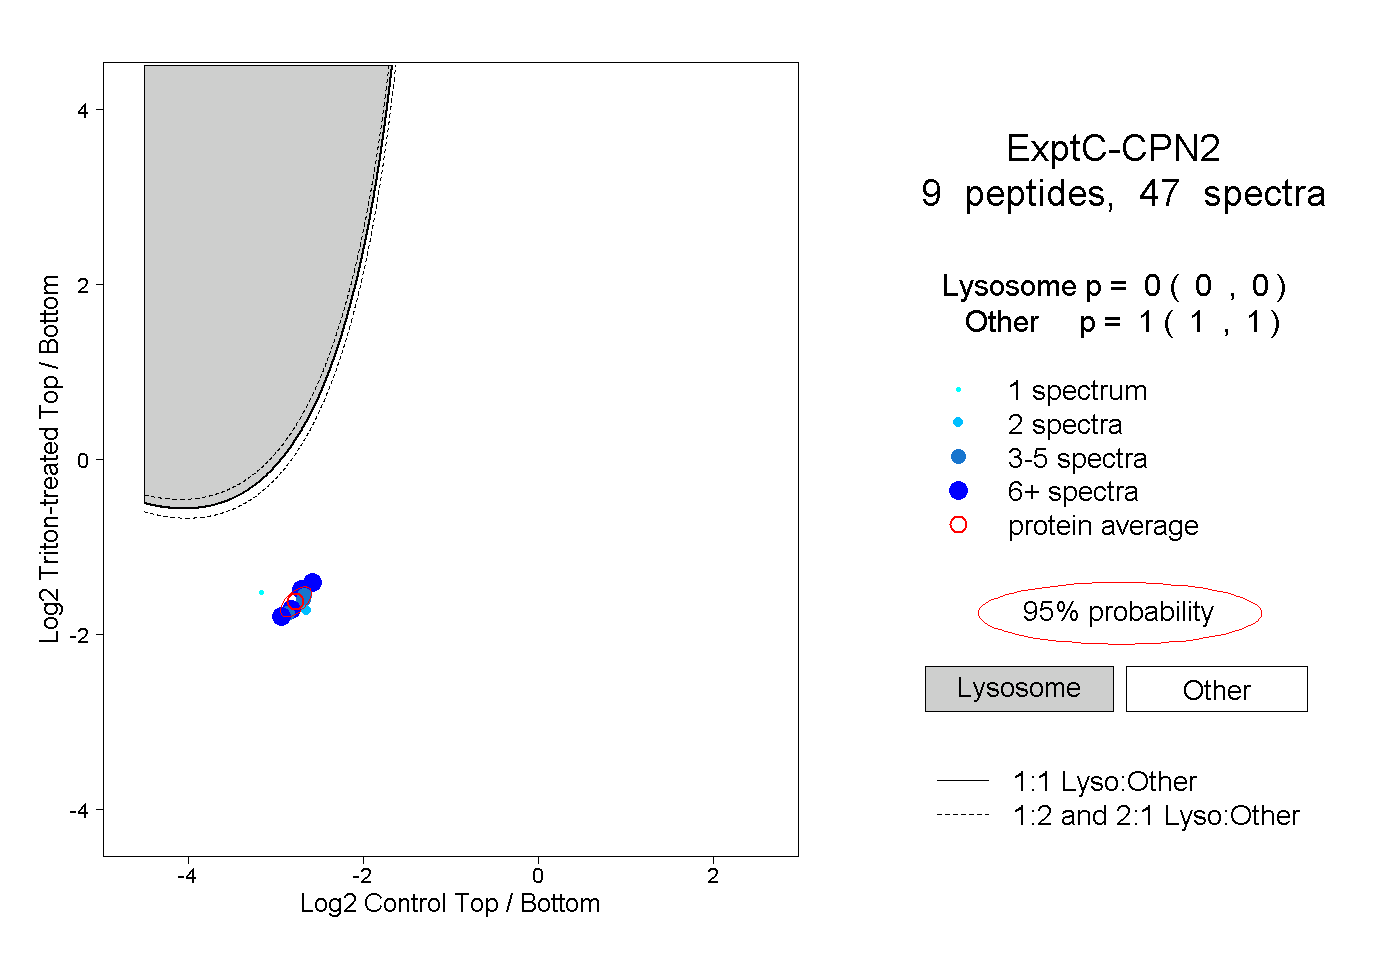
0.000 | 0.000
1.000 | 1.000
2peptides
spectra
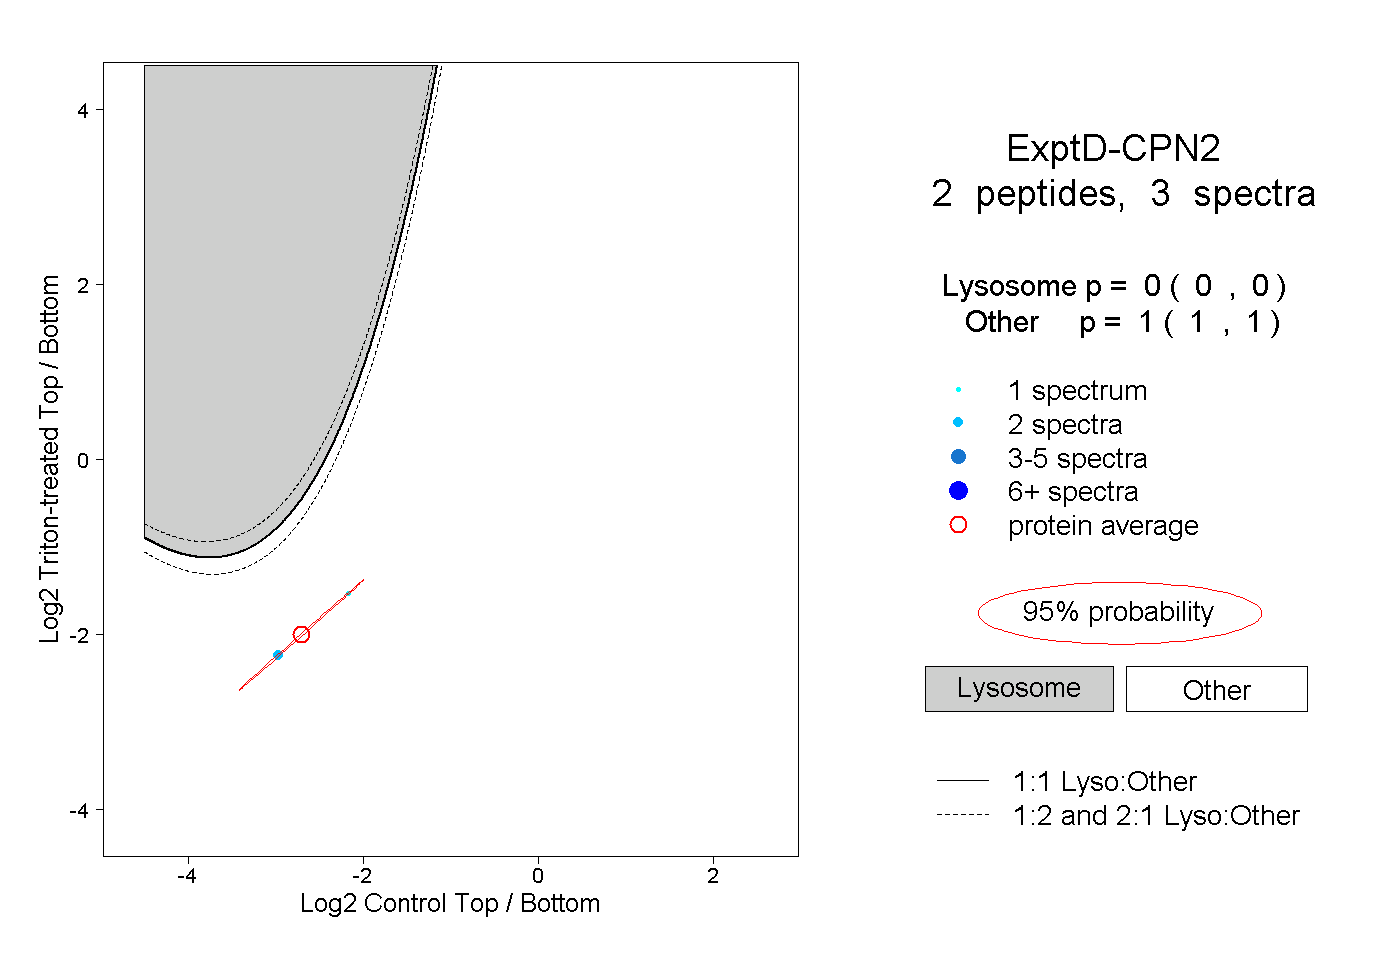
0.000 | 0.000
1.000 | 1.000