 9
9peptides
spectra
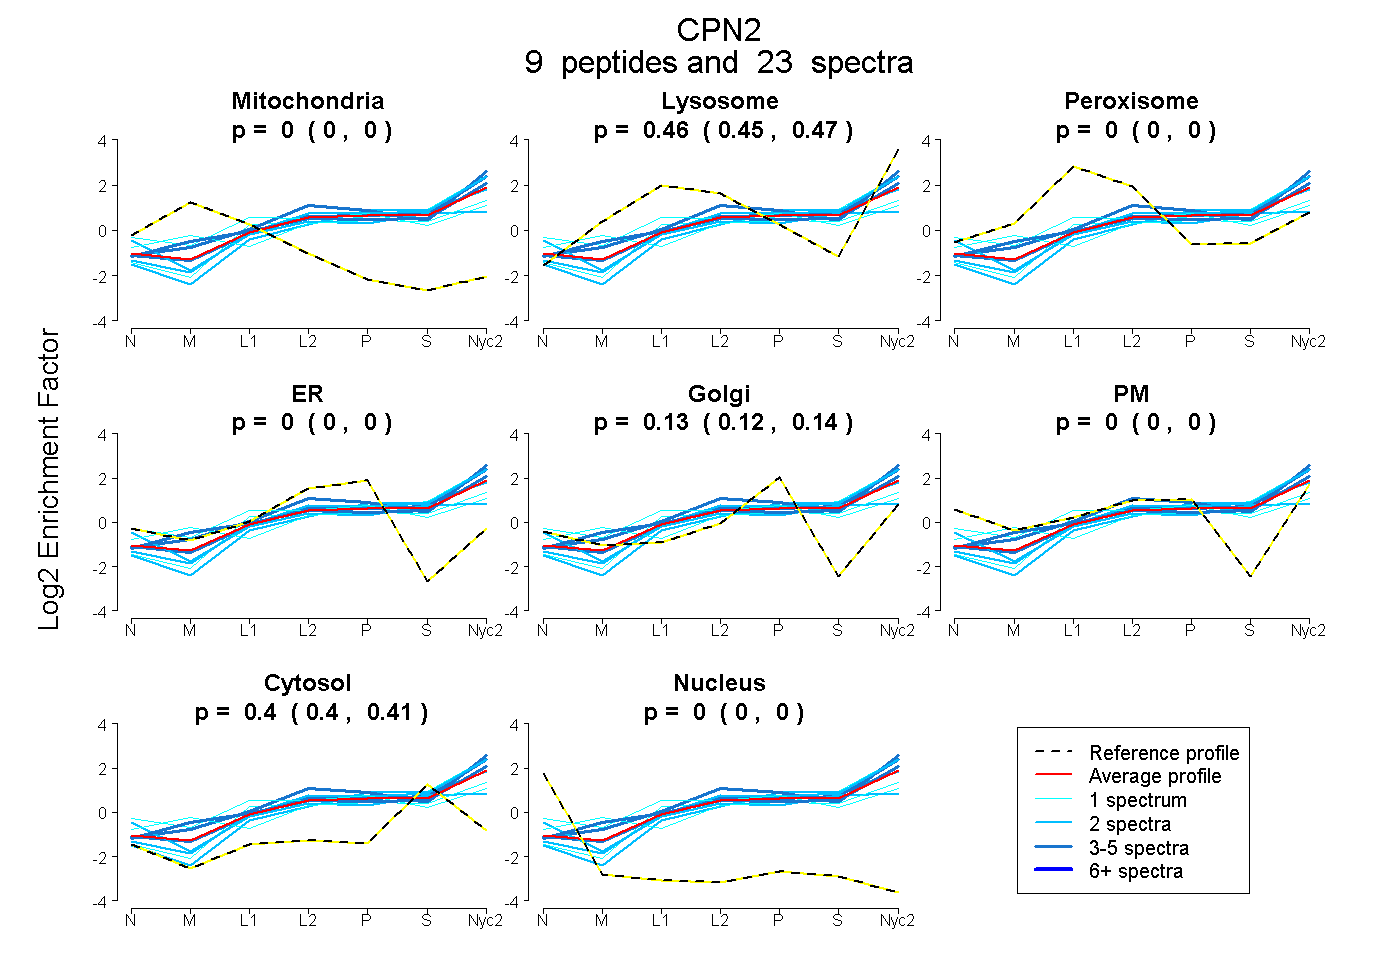
0.000 | 0.000
0.451 | 0.474
0.000 | 0.000
0.000 | 0.000
0.122 | 0.139
0.000 | 0.000
0.396 | 0.411
0.000 | 0.000
| Plot | Mito | Lyso | Perox | ER | Golgi | PM | Cytosol | Nucleus | |||||
| Expt A |
9 peptides |
23 spectra |
|
0.000 0.000 | 0.000 |
0.464 0.451 | 0.474 |
0.000 0.000 | 0.000 |
0.000 0.000 | 0.000 |
0.132 0.122 | 0.139 |
0.000 0.000 | 0.000 |
0.404 0.396 | 0.411 |
0.000 0.000 | 0.000 |
| 4 spectra, VVFLNTR | 0.000 | 0.540 | 0.000 | 0.000 | 0.095 | 0.000 | 0.365 | 0.000 | ||
| 1 spectrum, TLNLAQNLLTQLPK | 0.000 | 0.342 | 0.000 | 0.000 | 0.163 | 0.094 | 0.401 | 0.000 | ||
| 1 spectrum, NLEQLVK | 0.000 | 0.174 | 0.254 | 0.000 | 0.193 | 0.109 | 0.270 | 0.000 | ||
| 2 spectra, LTLDFNR | 0.000 | 0.513 | 0.000 | 0.000 | 0.068 | 0.000 | 0.419 | 0.000 | ||
| 5 spectra, LQLLDLSR | 0.000 | 0.517 | 0.000 | 0.000 | 0.095 | 0.000 | 0.388 | 0.000 | ||
| 1 spectrum, GMFQSLSSLQILK | 0.000 | 0.529 | 0.000 | 0.000 | 0.011 | 0.000 | 0.459 | 0.000 | ||
| 2 spectra, STCGSVR | 0.000 | 0.191 | 0.041 | 0.031 | 0.000 | 0.211 | 0.526 | 0.000 | ||
| 2 spectra, GQLVPNLK | 0.000 | 0.357 | 0.000 | 0.000 | 0.146 | 0.000 | 0.497 | 0.000 | ||
| 5 spectra, LFQSLR | 0.000 | 0.598 | 0.000 | 0.000 | 0.130 | 0.000 | 0.272 | 0.000 |
| Plot | Mito | Lyso or Perox | ER | Golgi | PM | Cytosol | Nucleus | ||||||
| Expt B |
4 peptides |
9 spectra |
 |
0.000 0.000 | 0.000 |
0.280 0.274 | 0.285 |
0.340 0.333 | 0.347 |
0.000 0.000 | 0.000 |
0.000 0.000 | 0.000 |
0.380 0.375 | 0.383 |
0.000 0.000 | 0.000 |
|||
| Plot | Lyso | Other | |||||||||||
| Expt C |
9 peptides |
47 spectra |
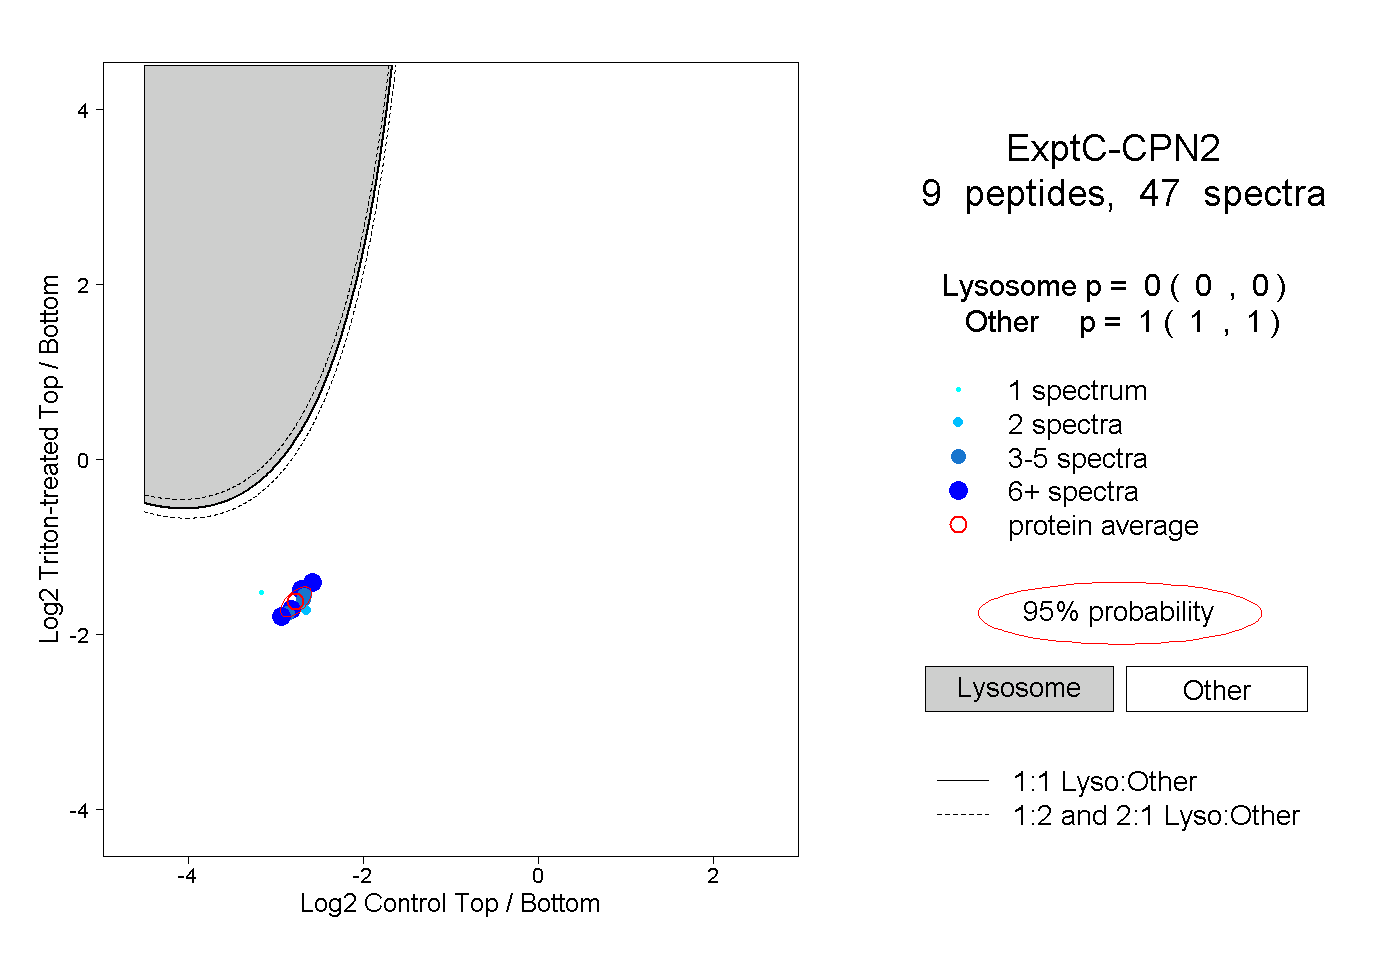 |
0.000 0.000 | 0.000 |
1.000 1.000 | 1.000 |
||||||||
| Plot | Lyso | Other | |||||||||||
| Expt D |
2 peptides |
3 spectra |
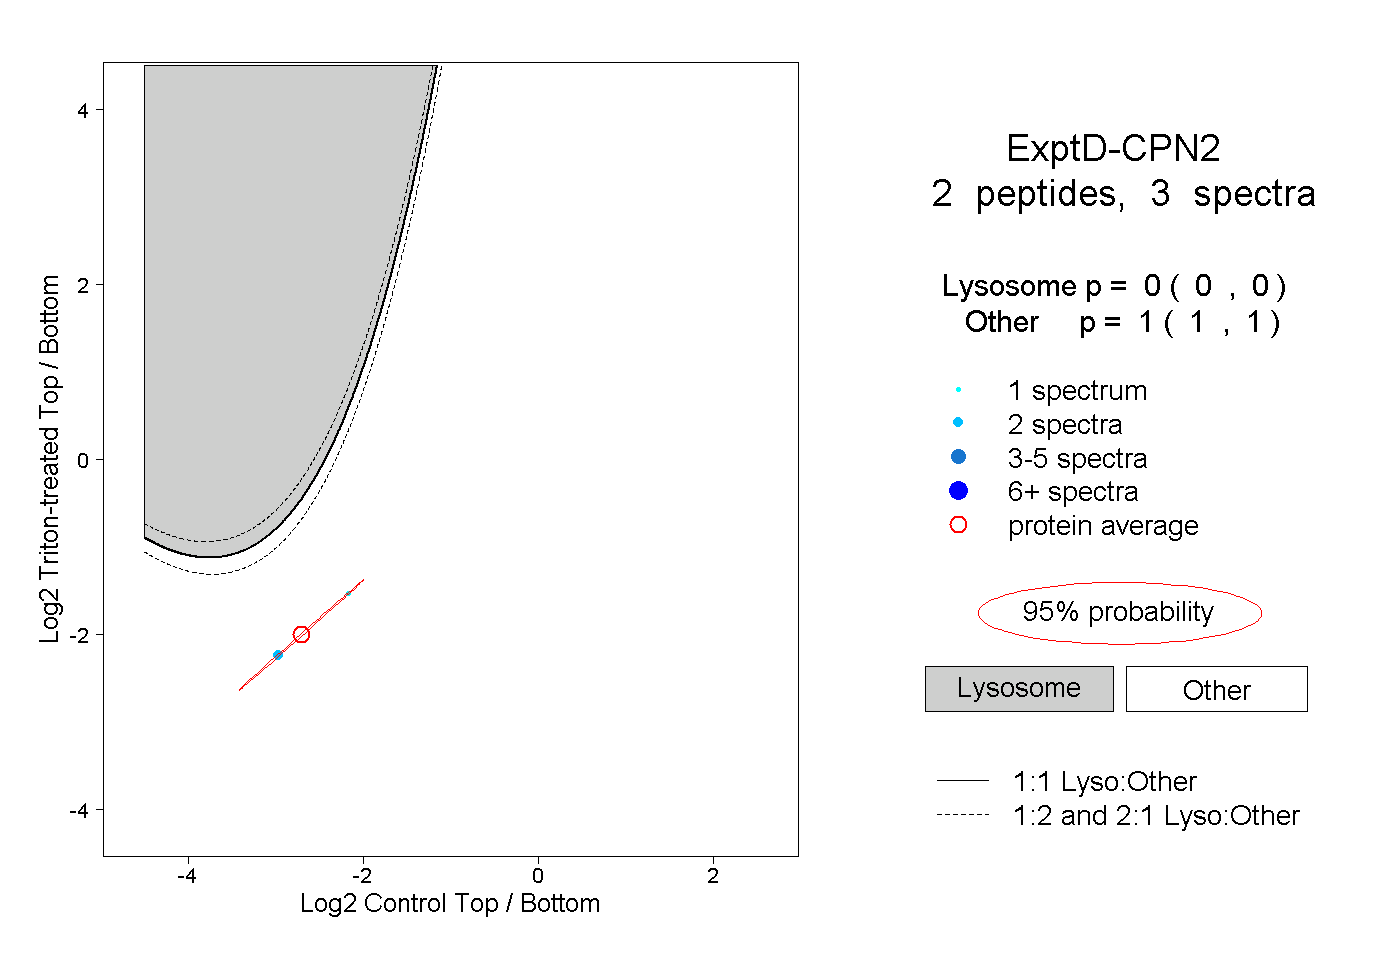 |
0.000 0.000 | 0.000 |
1.000 1.000 | 1.000 |