CPN2
[ENSRNOP00000049568]
Main page
| | | Plot |
Mito |
Lyso |
|
Perox |
ER |
Golgi |
PM |
Cytosol |
Nucleus |
|
| Expt A |
 9
9
peptides |
23
spectra |
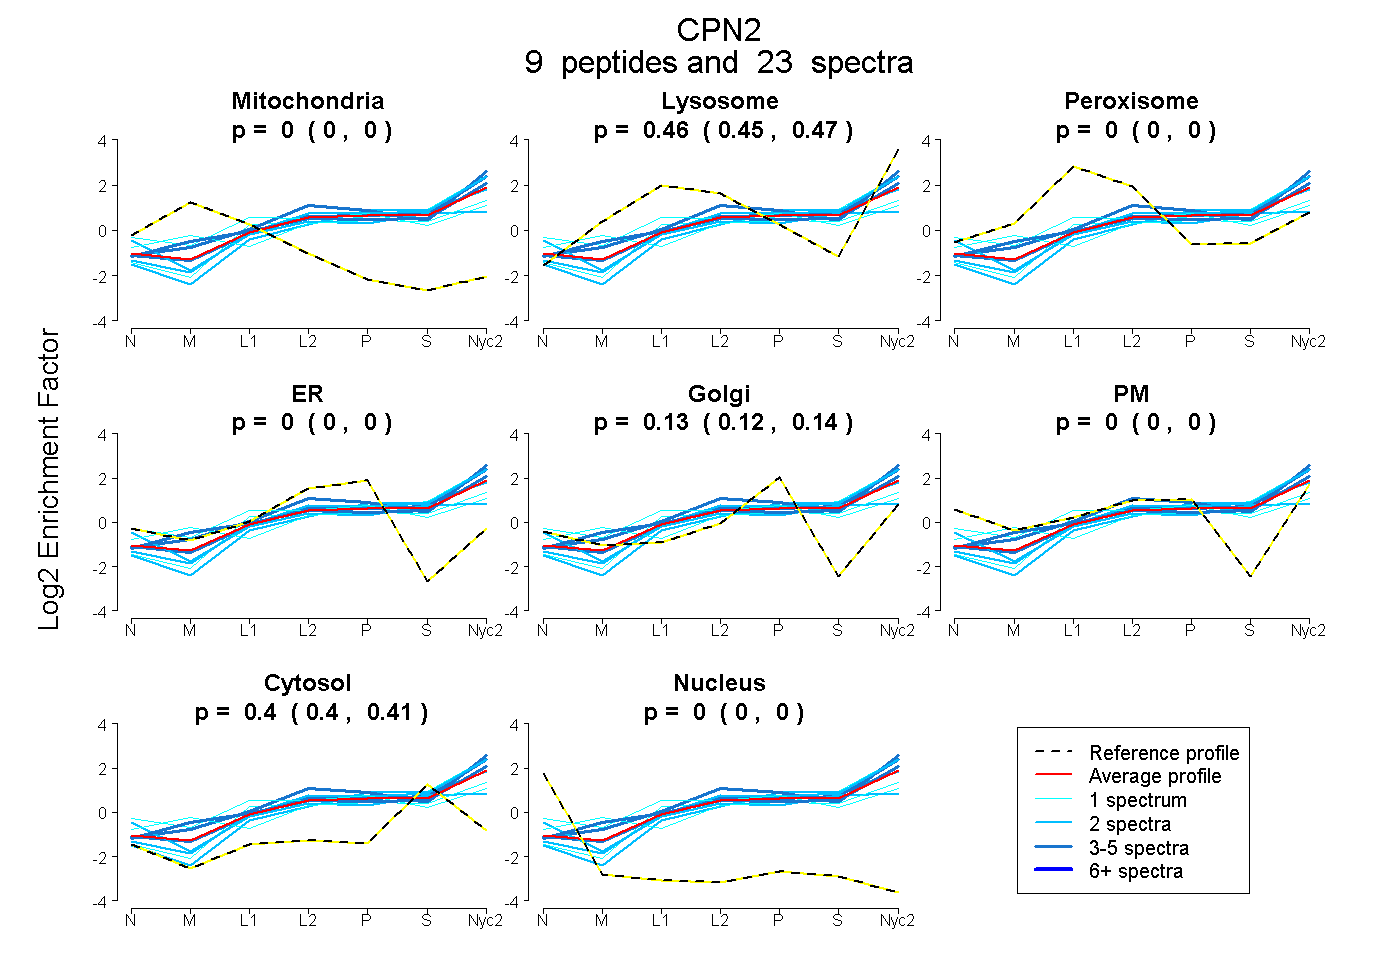 |
0.000
0.000 | 0.000 |
0.464
0.451 | 0.474 |
|
0.000
0.000 | 0.000 |
0.000
0.000 | 0.000 |
0.132
0.122 | 0.139 |
0.000
0.000 | 0.000 |
0.404
0.396 | 0.411 |
0.000
0.000 | 0.000 |
|
| | | Plot |
Mito |
|
Lyso or Perox |
|
ER |
Golgi |
PM |
Cytosol |
Nucleus |
|
| Expt B |
4
peptides |
9
spectra |
 |
0.000
0.000 | 0.000 |
|
0.280
0.274 | 0.285 |
|
0.340
0.333 | 0.347 |
0.000
0.000 | 0.000 |
0.000
0.000 | 0.000 |
0.380
0.375 | 0.383 |
0.000
0.000 | 0.000 |
|
| 2 spectra, VVFLNTR |
0.000 |
|
0.290 |
|
0.332 |
0.000 |
0.000 |
0.378 |
0.000 |
|
| 2 spectra, LTLDFNR |
0.000 |
|
0.268 |
|
0.334 |
0.000 |
0.000 |
0.398 |
0.000 |
|
| 2 spectra, LQLLDLSR |
0.000 |
|
0.247 |
|
0.390 |
0.000 |
0.000 |
0.363 |
0.000 |
|
| 3 spectra, LFQSLR |
0.000 |
|
0.311 |
|
0.307 |
0.000 |
0.000 |
0.381 |
0.000 |
|
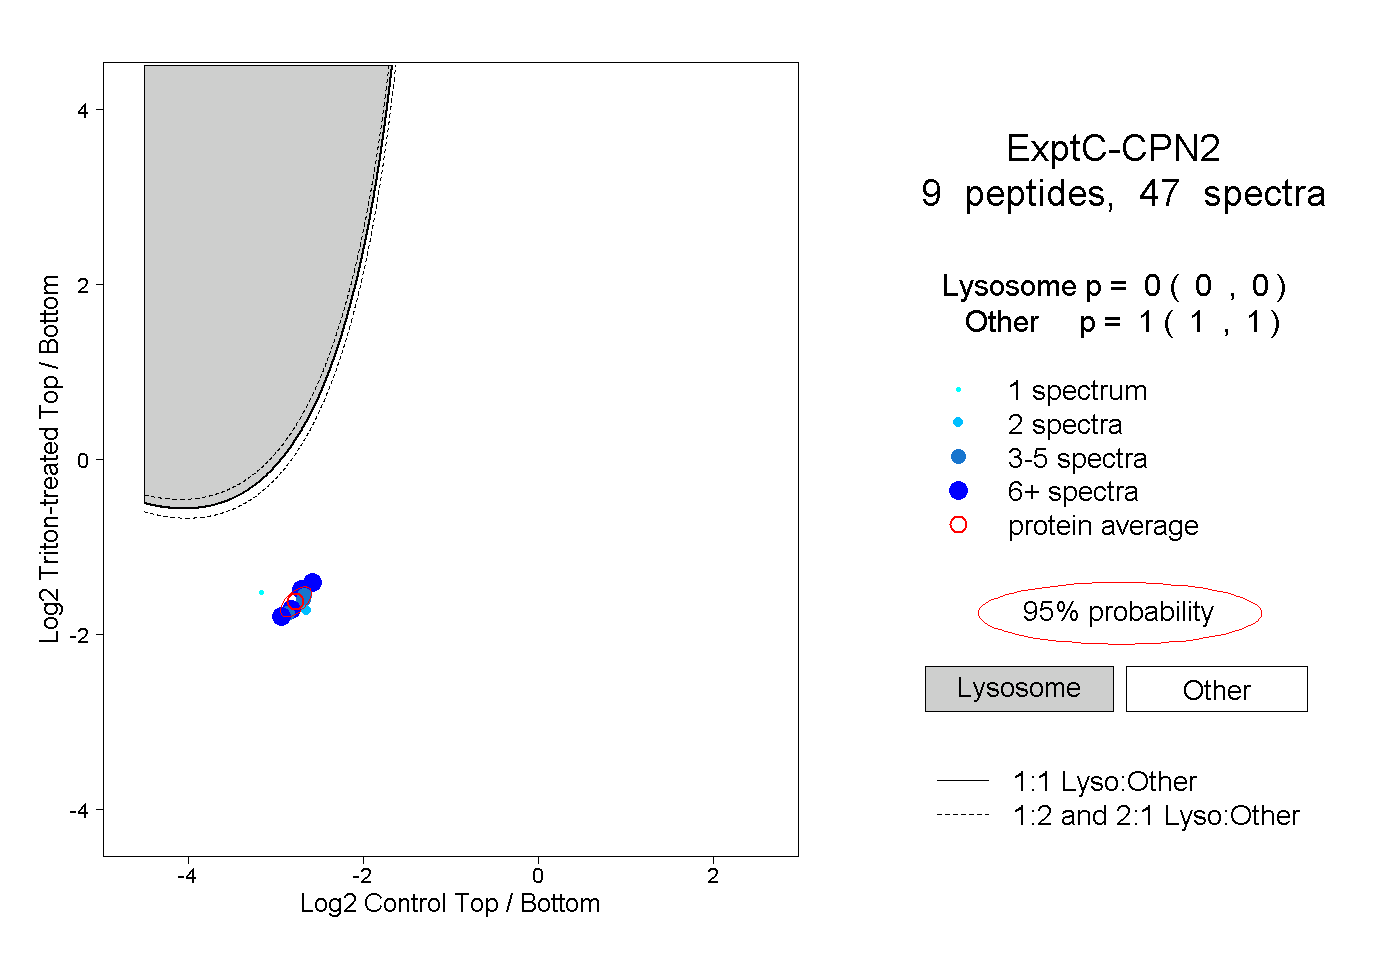
| | | Plot |
|
Lyso |
|
|
|
|
|
|
|
Other |
| Expt C |
9
peptides |
47
spectra |
 |
|
0.000
0.000 | 0.000 |
|
|
|
|
|
|
|
1.000
1.000 | 1.000 |
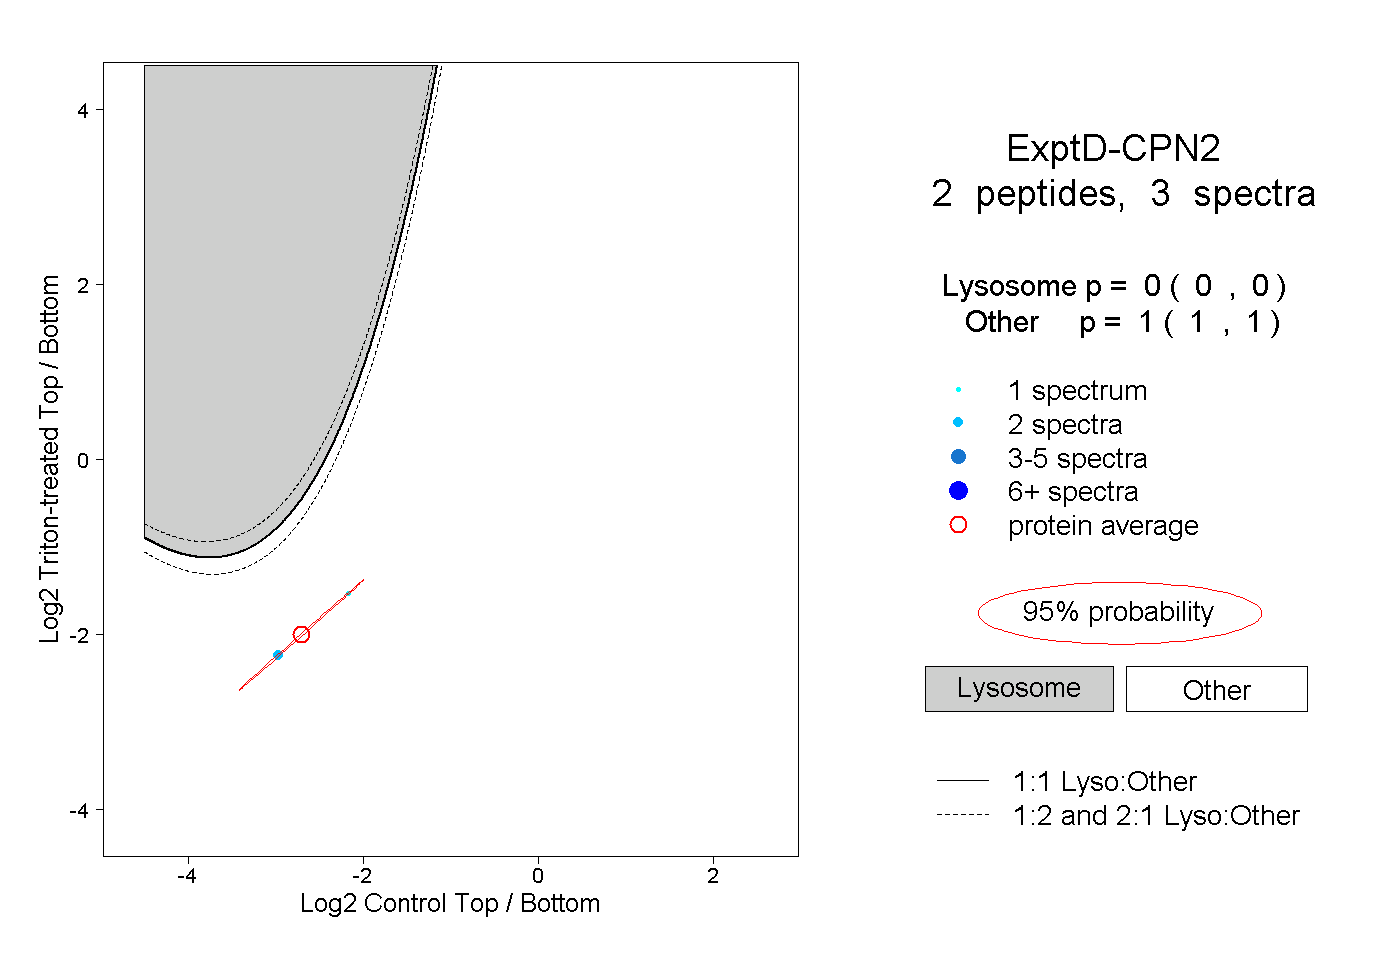
| | | Plot |
|
Lyso |
|
|
|
|
|
|
|
Other |
| Expt D |
2
peptides |
3
spectra |
 |
|
0.000
0.000 | 0.000 |
|
|
|
|
|
|
|
1.000
1.000 | 1.000 |