 19
19peptides
spectra
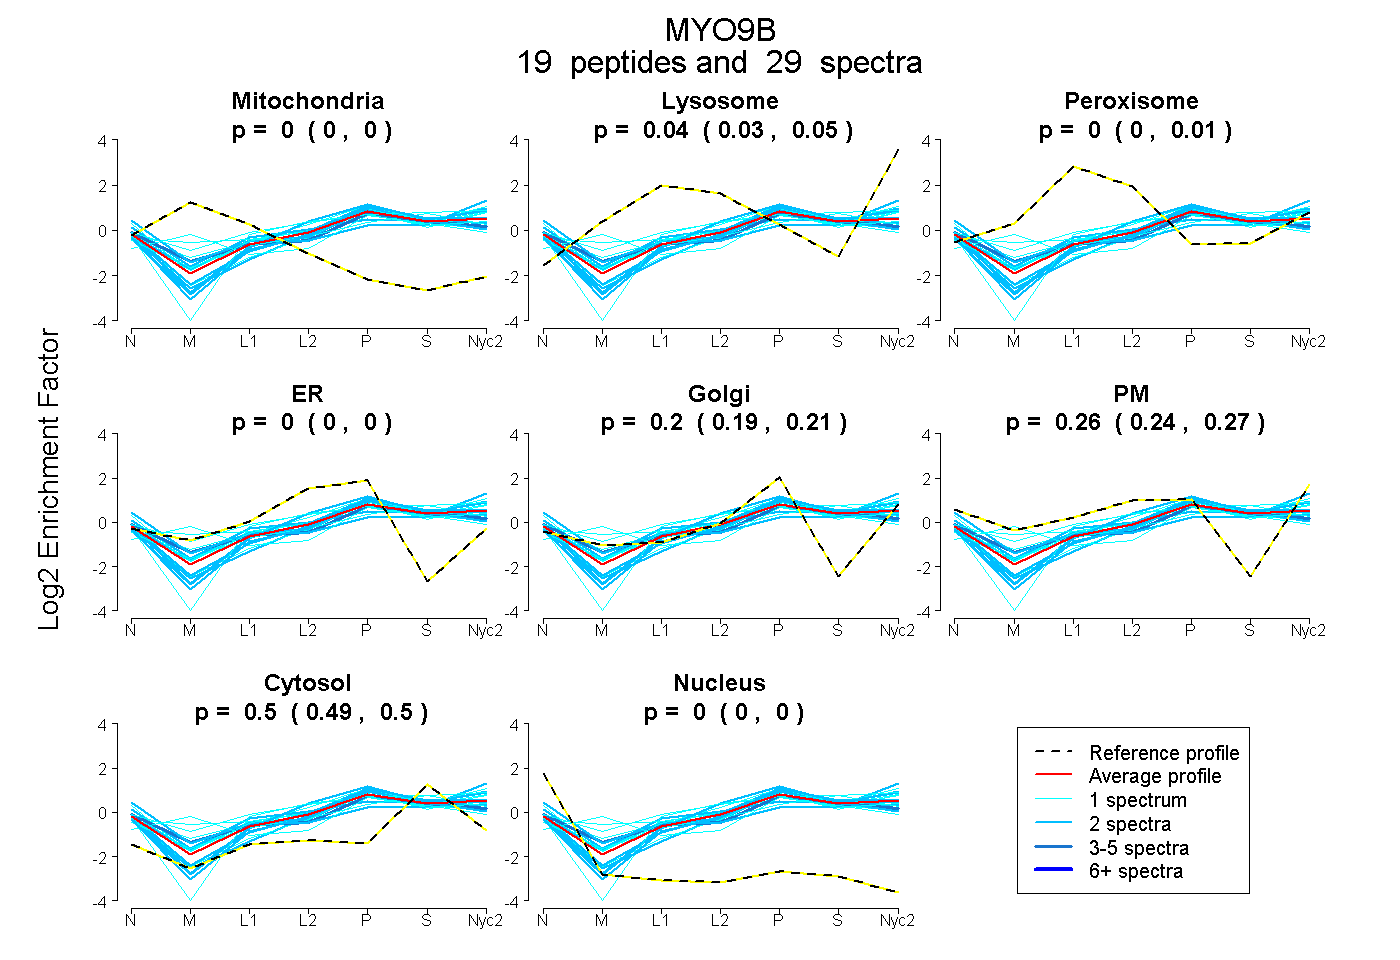
0.000 | 0.000
0.030 | 0.046
0.000 | 0.008
0.000 | 0.000
0.188 | 0.212
0.244 | 0.273
0.492 | 0.503
0.000 | 0.000
4peptides
spectra
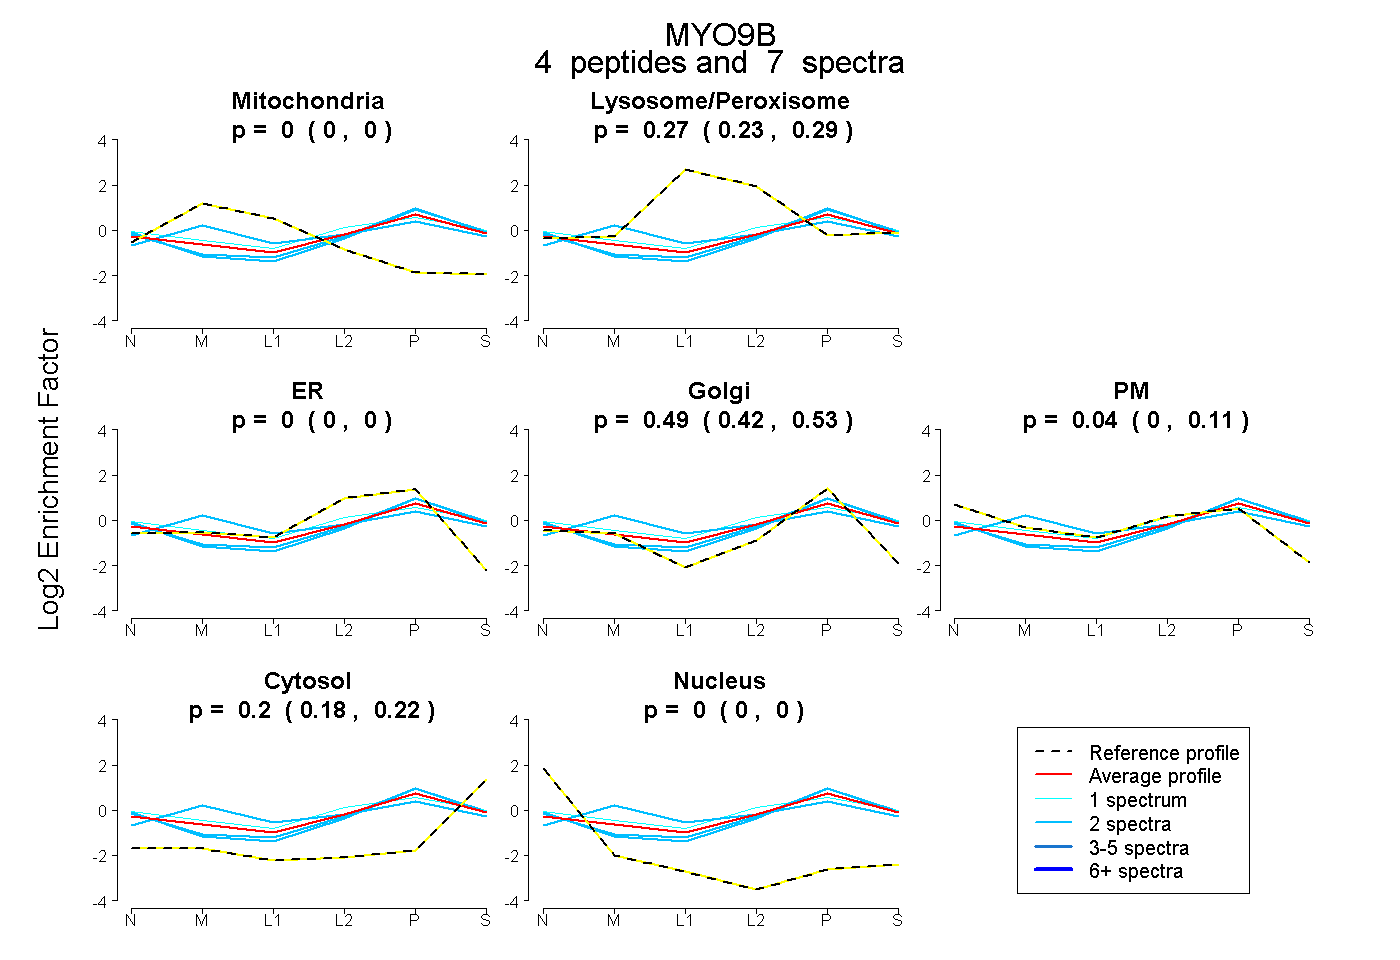
0.000 | 0.000
0.229 | 0.290
0.000 | 0.000
0.419 | 0.532
0.000 | 0.110
0.181 | 0.225
0.000 | 0.000
12peptides
spectra
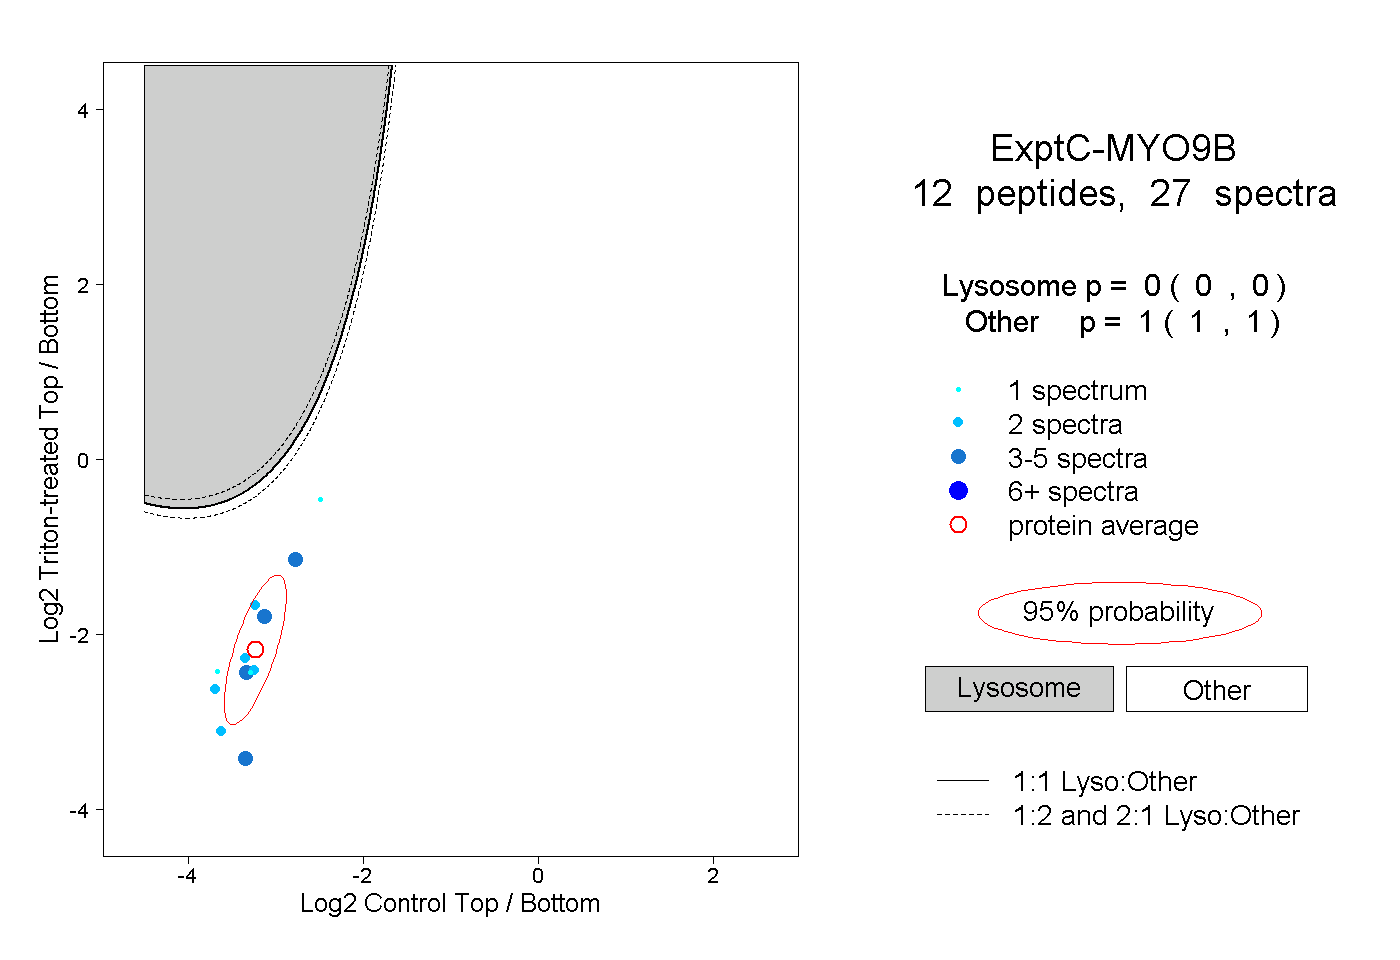
0.000 | 0.000
1.000 | 1.000
2peptides
spectra
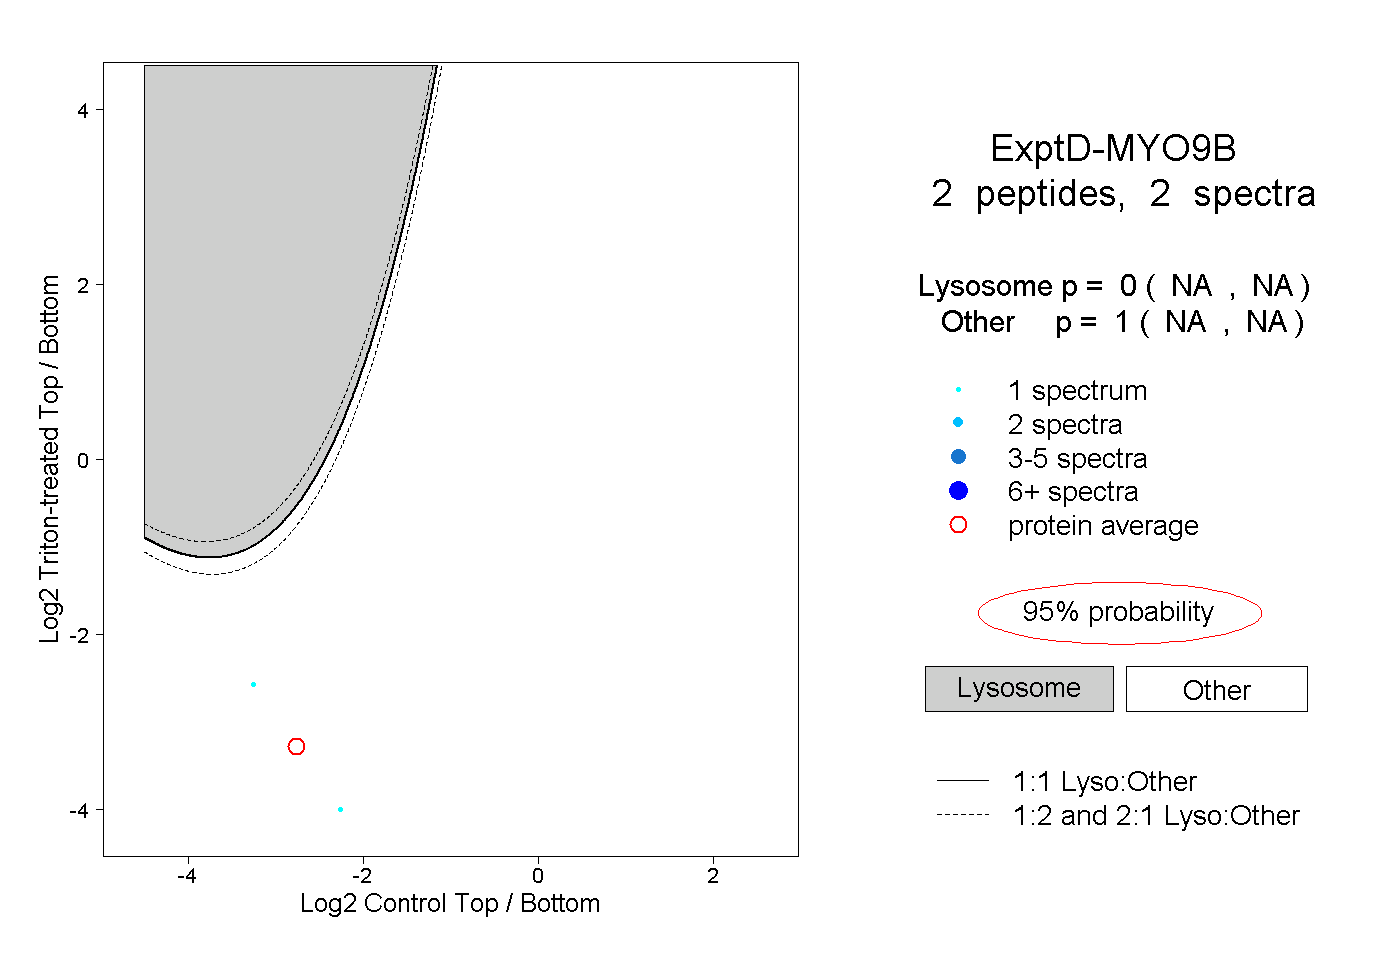
NA | NA
NA | NA