MYO9B
[ENSRNOP00000048368]
Main page
| | | Plot |
Mito |
Lyso |
|
Perox |
ER |
Golgi |
PM |
Cytosol |
Nucleus |
|
| Expt A |
 19
19
peptides |
29
spectra |
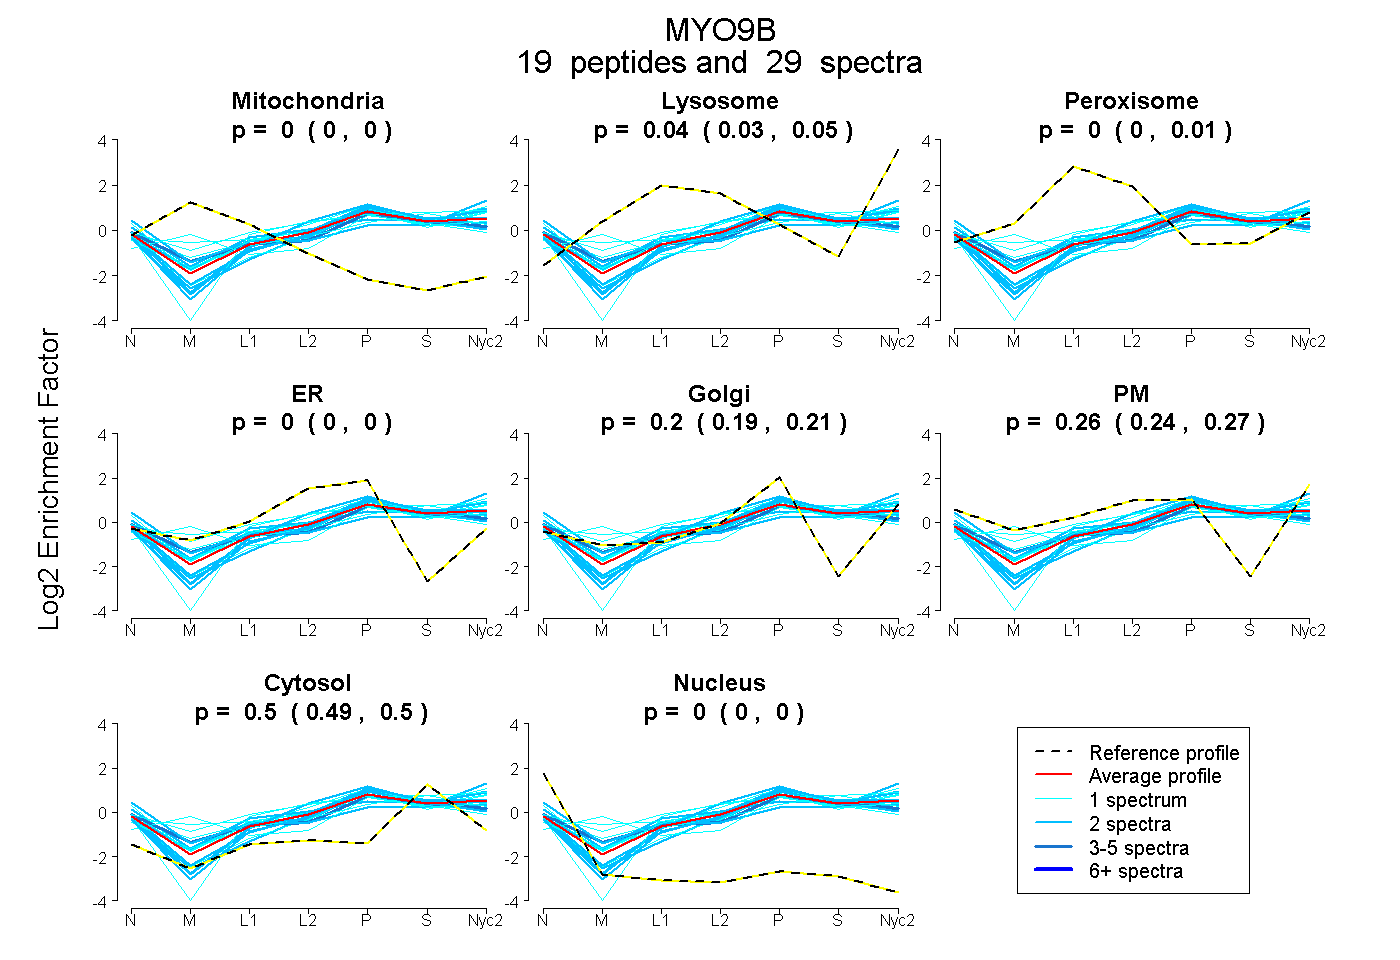 |
0.000
0.000 | 0.000 |
0.040
0.030 | 0.046 |
|
0.000
0.000 | 0.008 |
0.000
0.000 | 0.000 |
0.200
0.188 | 0.212 |
0.262
0.244 | 0.273 |
0.498
0.492 | 0.503 |
0.000
0.000 | 0.000 |
|
| | | Plot |
Mito |
|
Lyso or Perox |
|
ER |
Golgi |
PM |
Cytosol |
Nucleus |
|
| Expt B |
4
peptides |
7
spectra |
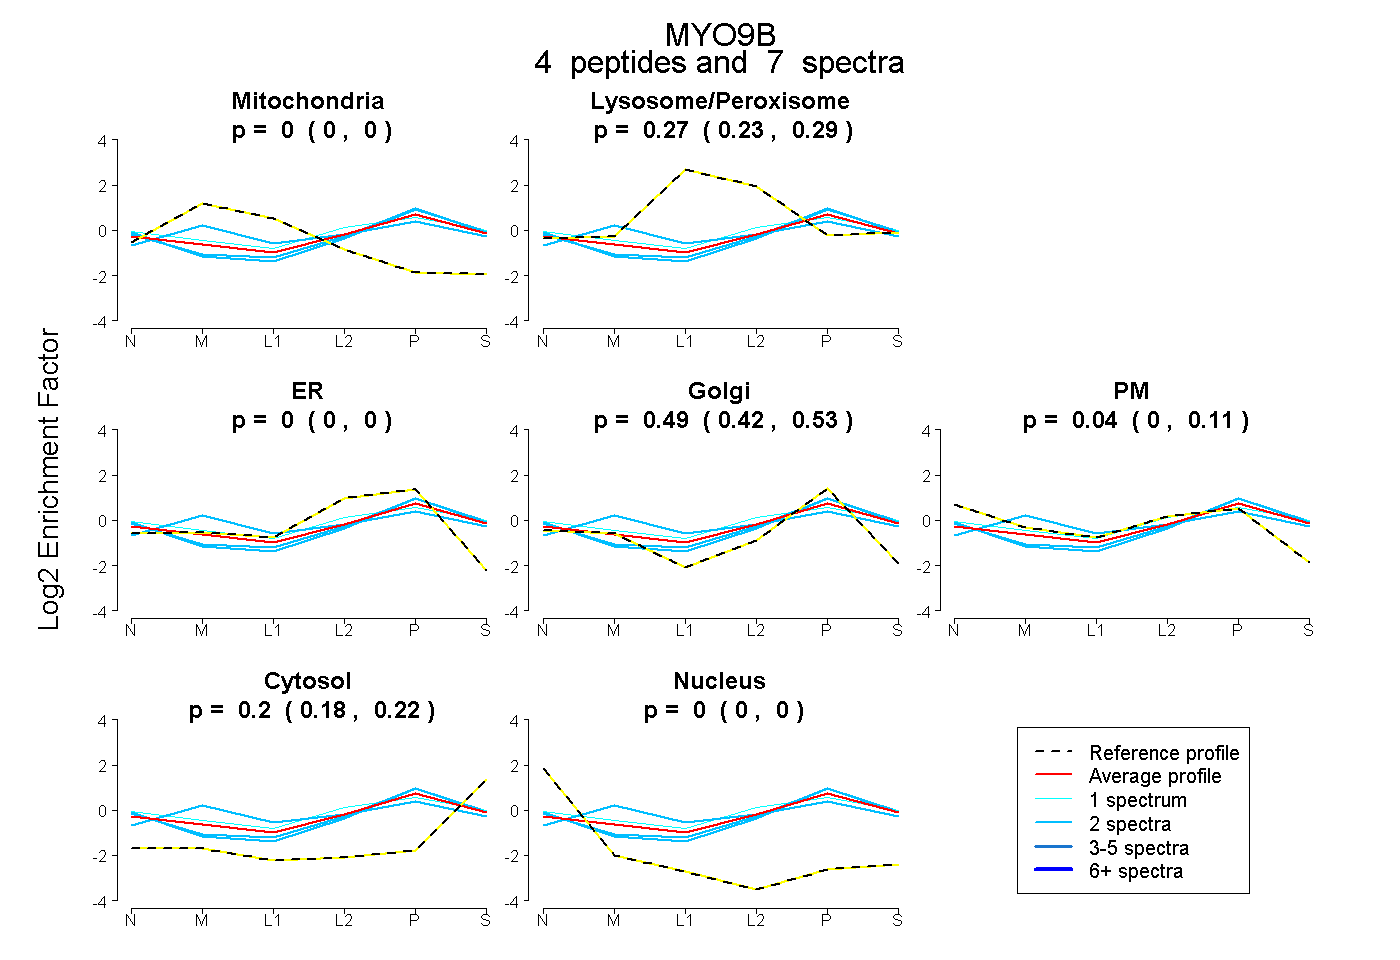 |
0.000
0.000 | 0.000 |
|
0.265
0.229 | 0.290 |
|
0.000
0.000 | 0.000 |
0.490
0.419 | 0.532 |
0.039
0.000 | 0.110 |
0.205
0.181 | 0.225 |
0.000
0.000 | 0.000 |
|
| 1 spectrum, ETLVEVLTK |
0.000 |
|
0.276 |
|
0.000 |
0.299 |
0.217 |
0.208 |
0.000 |
|
| 2 spectra, LIFHLVK |
0.000 |
|
0.230 |
|
0.000 |
0.561 |
0.003 |
0.206 |
0.000 |
|
| 2 spectra, SHVEELPR |
0.074 |
|
0.316 |
|
0.000 |
0.435 |
0.000 |
0.174 |
0.000 |
|
| 2 spectra, EAIAALLEK |
0.000 |
|
0.180 |
|
0.000 |
0.524 |
0.063 |
0.232 |
0.000 |
|
| | | Plot |
|
Lyso |
|
|
|
|
|
|
|
Other |
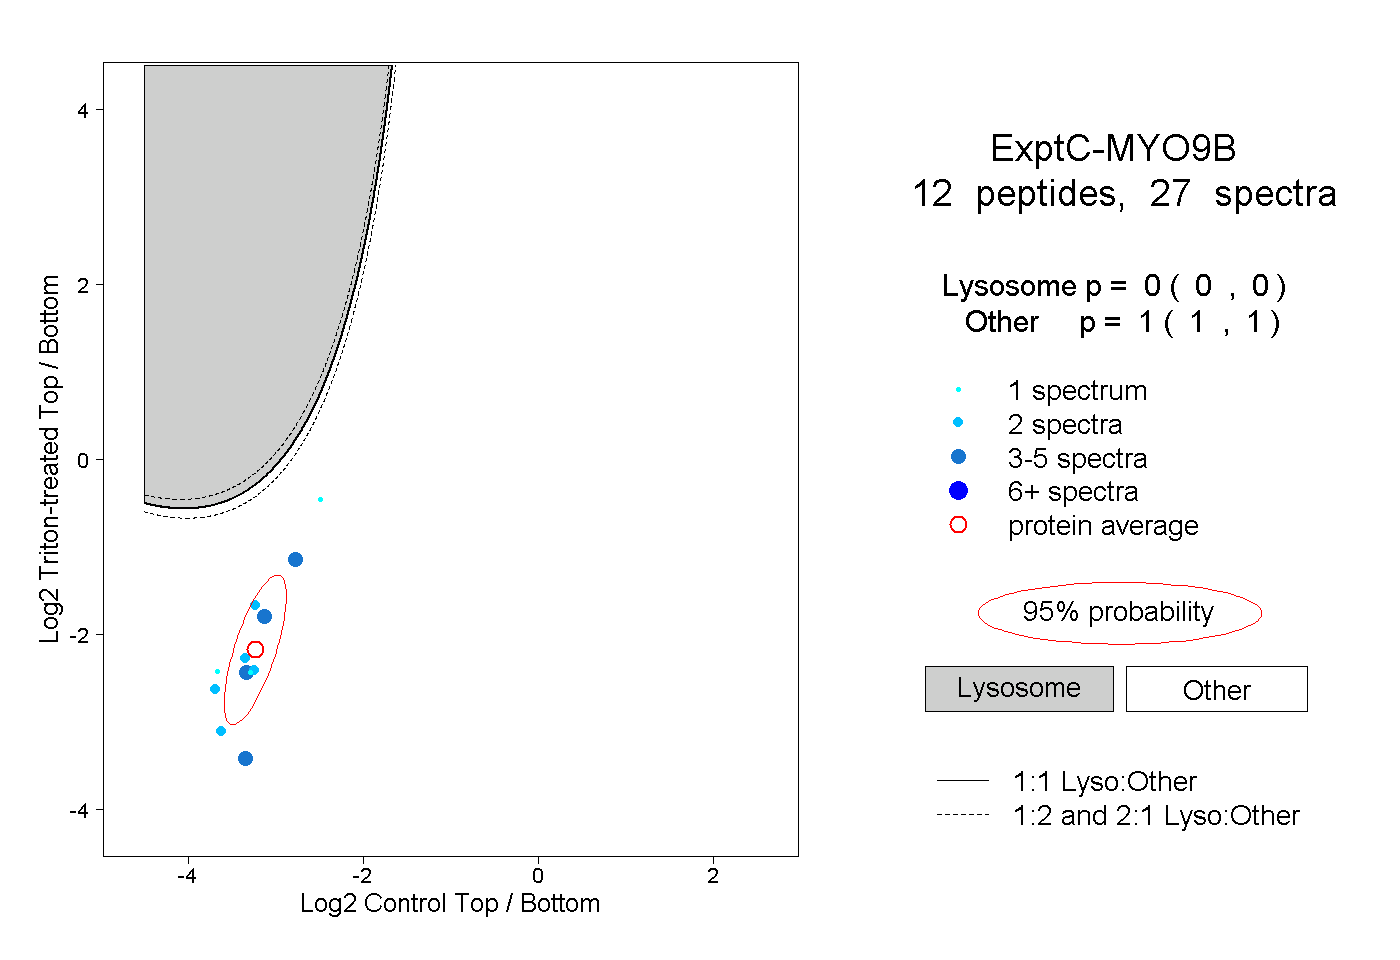
| Expt C |
12
peptides |
27
spectra |
 |
|
0.000
0.000 | 0.000 |
|
|
|
|
|
|
|
1.000
1.000 | 1.000 |
| | | Plot |
|
Lyso |
|
|
|
|
|
|
|
Other |
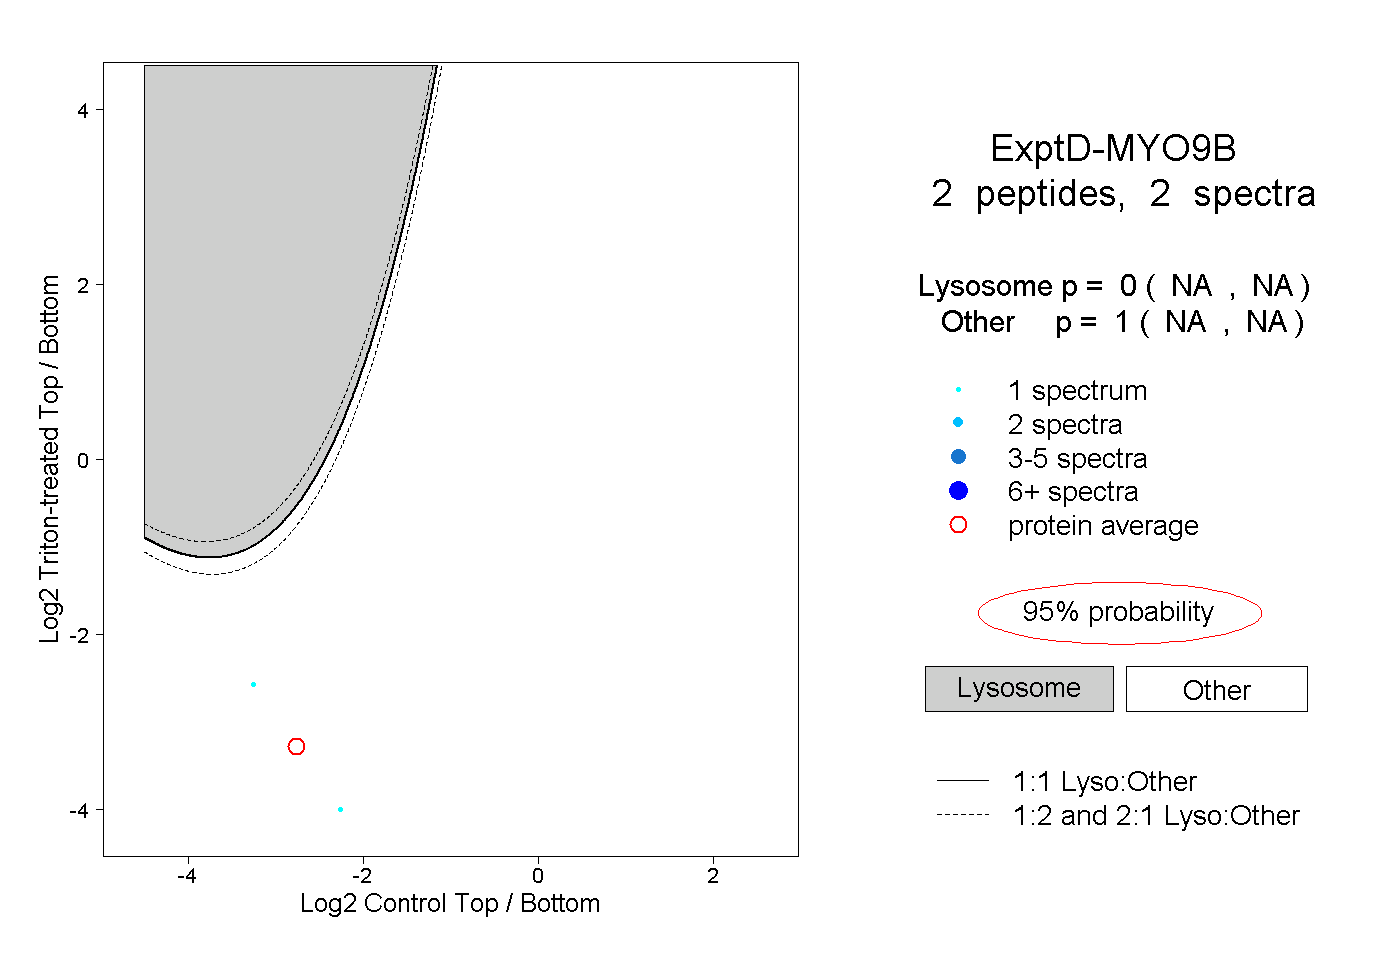
| Expt D |
2
peptides |
2
spectra |
 |
|
0.000
NA | NA |
|
|
|
|
|
|
|
1.000
NA | NA |