 19
19peptides
spectra
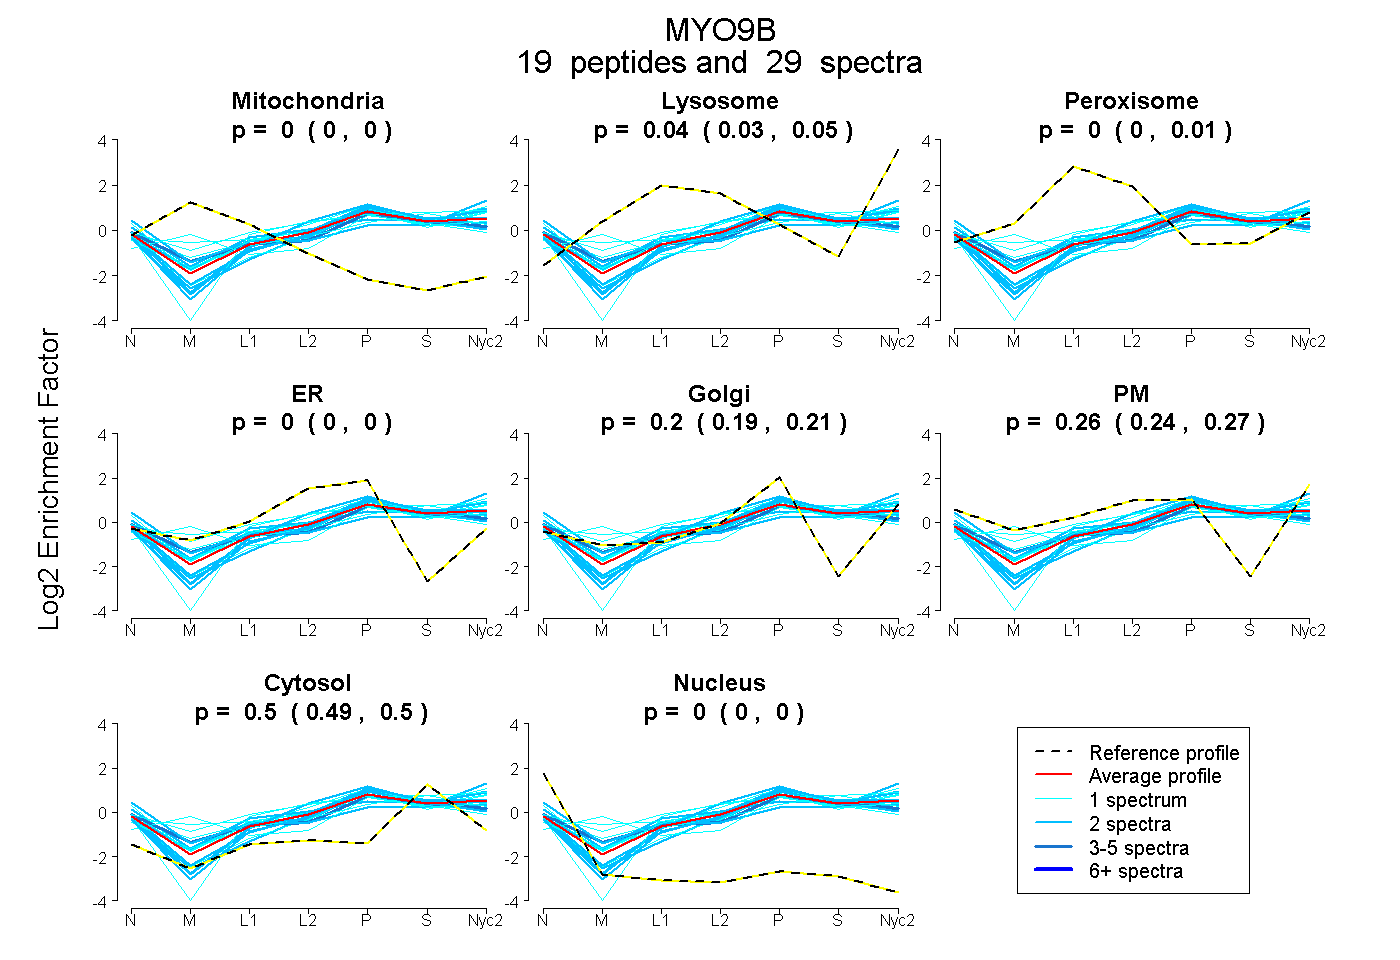
0.000 | 0.000
0.030 | 0.046
0.000 | 0.008
0.000 | 0.000
0.188 | 0.212
0.244 | 0.273
0.492 | 0.503
0.000 | 0.000
| Plot | Mito | Lyso | Perox | ER | Golgi | PM | Cytosol | Nucleus | |||||
| Expt A |
19 peptides |
29 spectra |
|
0.000 0.000 | 0.000 |
0.040 0.030 | 0.046 |
0.000 0.000 | 0.008 |
0.000 0.000 | 0.000 |
0.200 0.188 | 0.212 |
0.262 0.244 | 0.273 |
0.498 0.492 | 0.503 |
0.000 0.000 | 0.000 |
| 3 spectra, GSDSSYVR | 0.000 | 0.000 | 0.077 | 0.000 | 0.270 | 0.170 | 0.483 | 0.000 | ||
| 1 spectrum, TDFEPVK | 0.000 | 0.047 | 0.067 | 0.000 | 0.172 | 0.140 | 0.574 | 0.000 | ||
| 2 spectra, FLDEFLLNK | 0.000 | 0.036 | 0.000 | 0.000 | 0.287 | 0.197 | 0.480 | 0.000 | ||
| 1 spectrum, MEEINHLEAAESIAFR | 0.000 | 0.187 | 0.000 | 0.000 | 0.305 | 0.098 | 0.410 | 0.000 | ||
| 1 spectrum, DVQPCR | 0.000 | 0.000 | 0.000 | 0.000 | 0.000 | 0.518 | 0.482 | 0.000 | ||
| 2 spectra, VLLWPR | 0.000 | 0.020 | 0.000 | 0.000 | 0.416 | 0.030 | 0.534 | 0.000 | ||
| 2 spectra, EAIAALLEK | 0.000 | 0.000 | 0.000 | 0.000 | 0.475 | 0.005 | 0.520 | 0.000 | ||
| 1 spectrum, ETLVEVLTK | 0.000 | 0.139 | 0.082 | 0.000 | 0.284 | 0.141 | 0.354 | 0.000 | ||
| 1 spectrum, AMAVIR | 0.000 | 0.000 | 0.170 | 0.000 | 0.428 | 0.000 | 0.402 | 0.000 | ||
| 2 spectra, DSTTSDVIR | 0.000 | 0.000 | 0.080 | 0.117 | 0.000 | 0.289 | 0.514 | 0.000 | ||
| 1 spectrum, AEPFFIR | 0.000 | 0.077 | 0.000 | 0.000 | 0.123 | 0.339 | 0.462 | 0.000 | ||
| 1 spectrum, TPIESLFIEATER | 0.000 | 0.077 | 0.000 | 0.090 | 0.028 | 0.199 | 0.606 | 0.000 | ||
| 1 spectrum, FIQVNYLESGIVR | 0.000 | 0.000 | 0.000 | 0.000 | 0.397 | 0.081 | 0.521 | 0.000 | ||
| 2 spectra, GYASGVER | 0.000 | 0.045 | 0.000 | 0.000 | 0.000 | 0.487 | 0.468 | 0.000 | ||
| 1 spectrum, LEDFPIHAITGVLK | 0.085 | 0.070 | 0.016 | 0.000 | 0.381 | 0.000 | 0.447 | 0.000 | ||
| 2 spectra, TAGAALTPTEER | 0.000 | 0.091 | 0.000 | 0.036 | 0.318 | 0.084 | 0.471 | 0.000 | ||
| 2 spectra, LIFHLVK | 0.000 | 0.000 | 0.000 | 0.109 | 0.309 | 0.050 | 0.532 | 0.000 | ||
| 2 spectra, AEAGVSSPVTR | 0.000 | 0.035 | 0.048 | 0.000 | 0.287 | 0.164 | 0.467 | 0.000 | ||
| 1 spectrum, QNYQIGK | 0.000 | 0.000 | 0.248 | 0.000 | 0.239 | 0.167 | 0.346 | 0.000 |
| Plot | Mito | Lyso or Perox | ER | Golgi | PM | Cytosol | Nucleus | ||||||
| Expt B |
4 peptides |
7 spectra |
 |
0.000 0.000 | 0.000 |
0.265 0.229 | 0.290 |
0.000 0.000 | 0.000 |
0.490 0.419 | 0.532 |
0.039 0.000 | 0.110 |
0.205 0.181 | 0.225 |
0.000 0.000 | 0.000 |
|||
| Plot | Lyso | Other | |||||||||||
| Expt C |
12 peptides |
27 spectra |
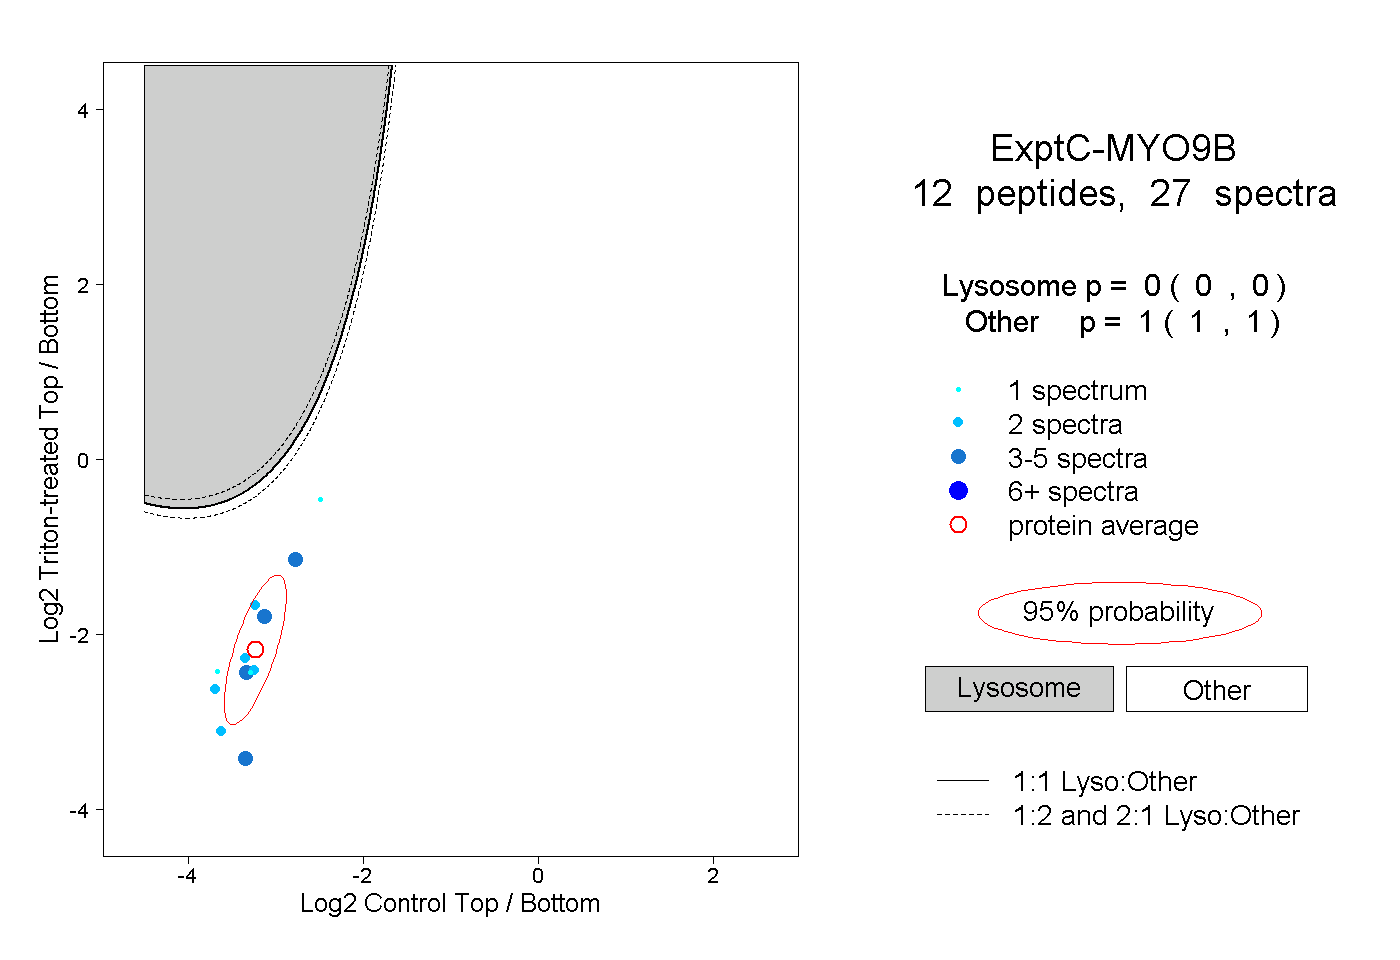 |
0.000 0.000 | 0.000 |
1.000 1.000 | 1.000 |
||||||||
| Plot | Lyso | Other | |||||||||||
| Expt D |
2 peptides |
2 spectra |
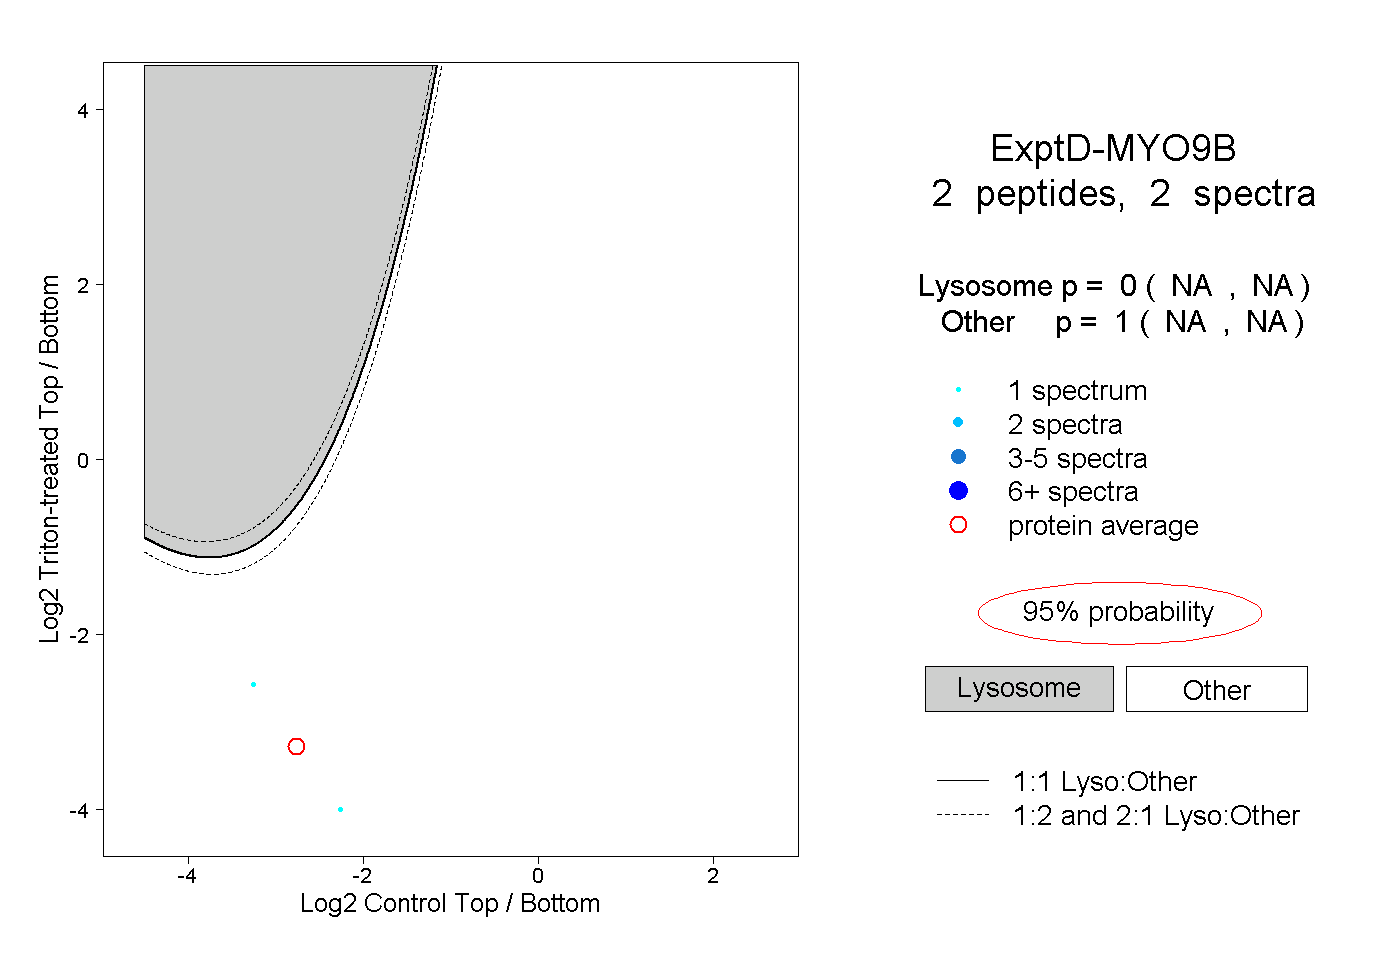 |
0.000 NA | NA |
1.000 NA | NA |