 51
51peptides
spectra
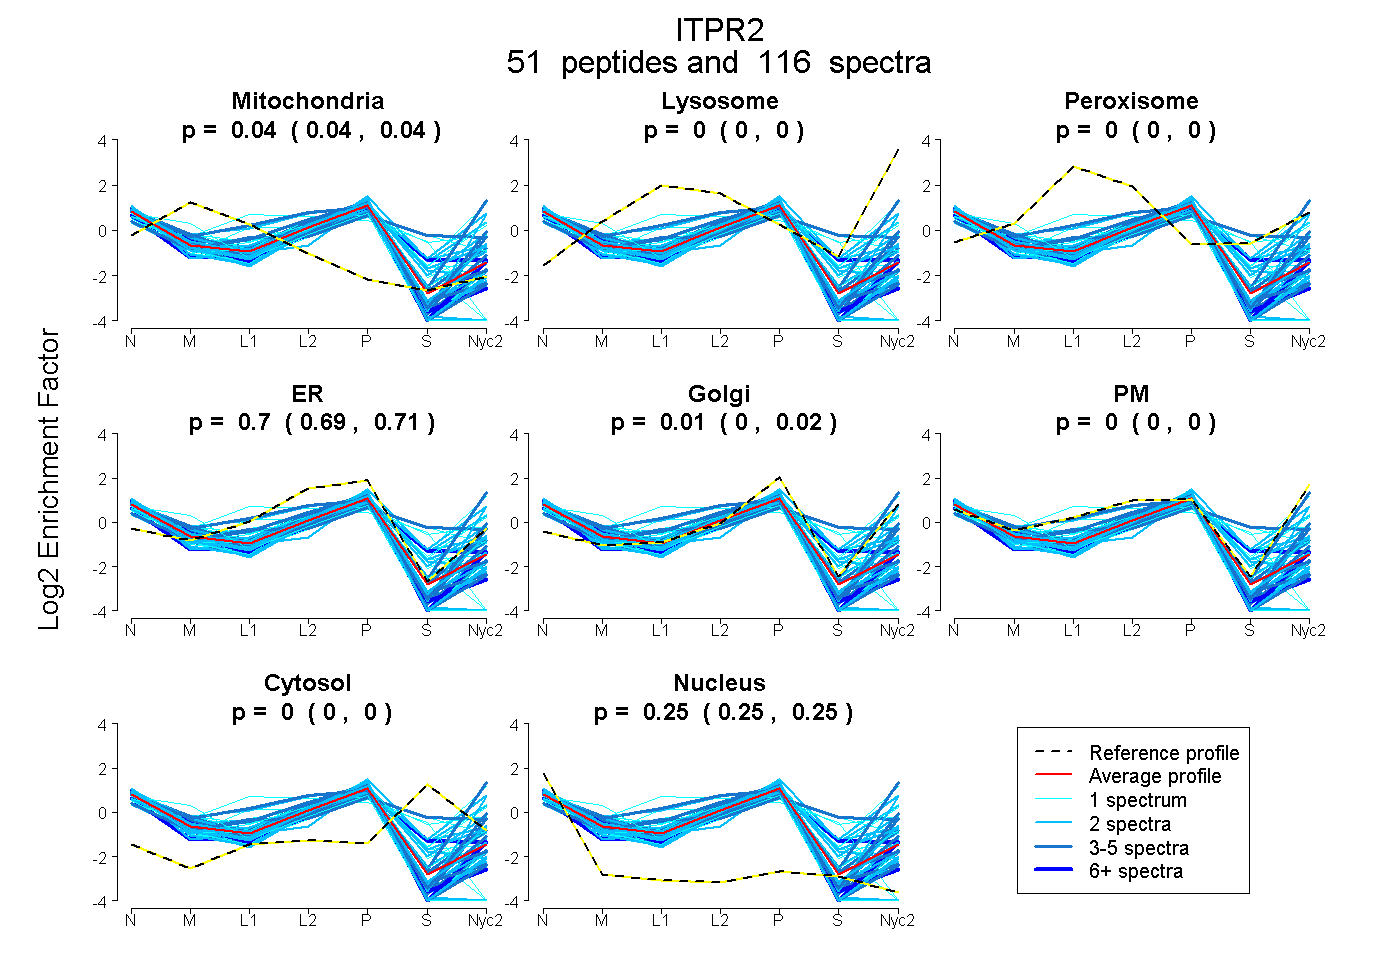
0.037 | 0.041
0.000 | 0.000
0.000 | 0.000
0.693 | 0.708
0.000 | 0.015
0.000 | 0.000
0.000 | 0.000
0.248 | 0.254
13peptides
spectra
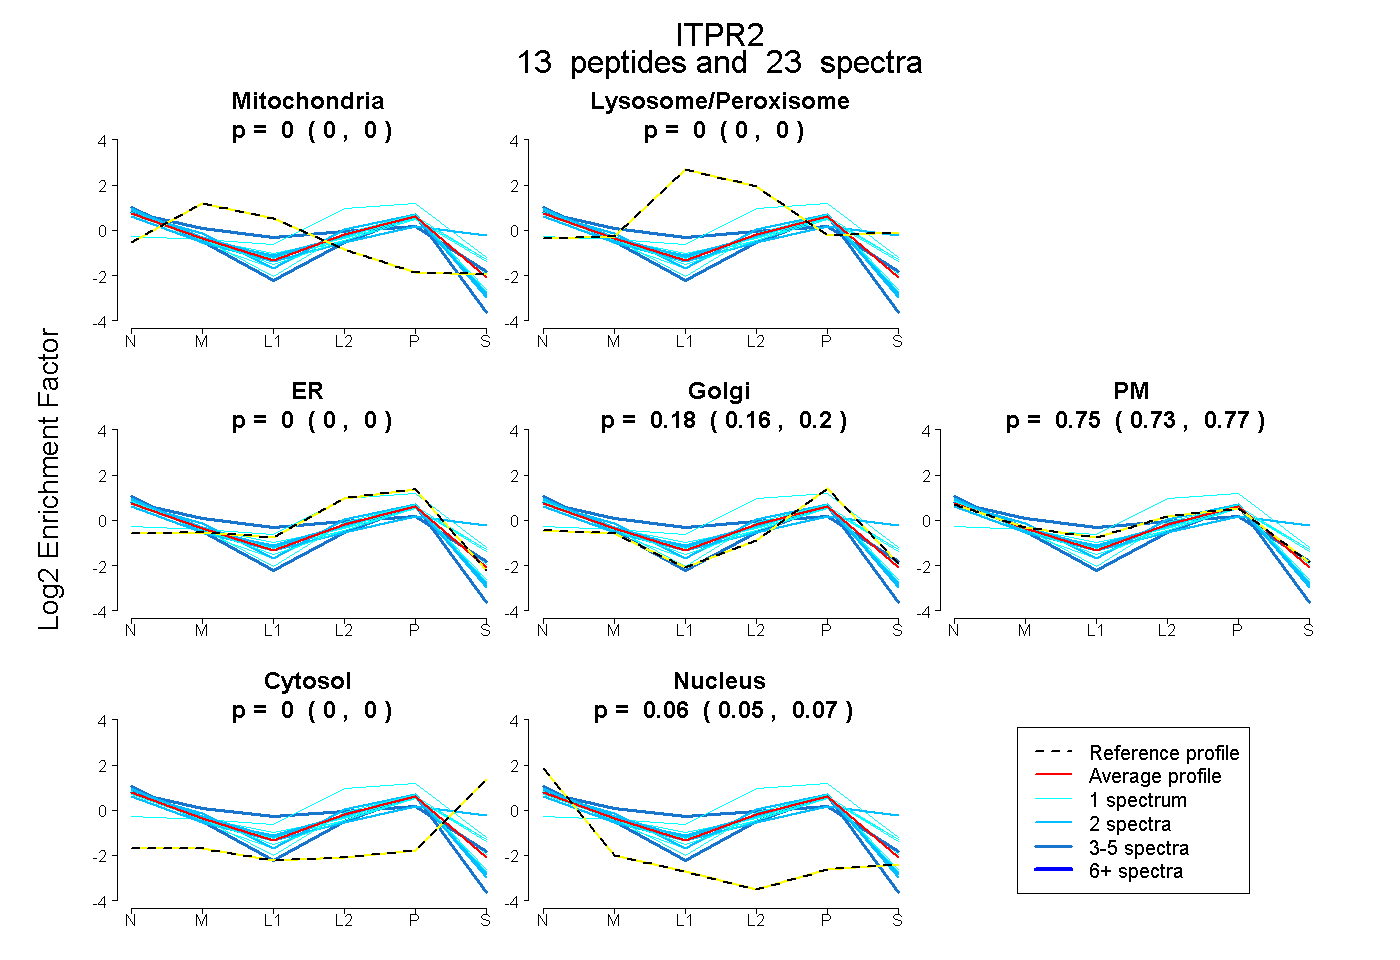
0.000 | 0.000
0.000 | 0.000
0.000 | 0.000
0.164 | 0.202
0.731 | 0.773
0.000 | 0.000
0.054 | 0.066
30peptides
spectra
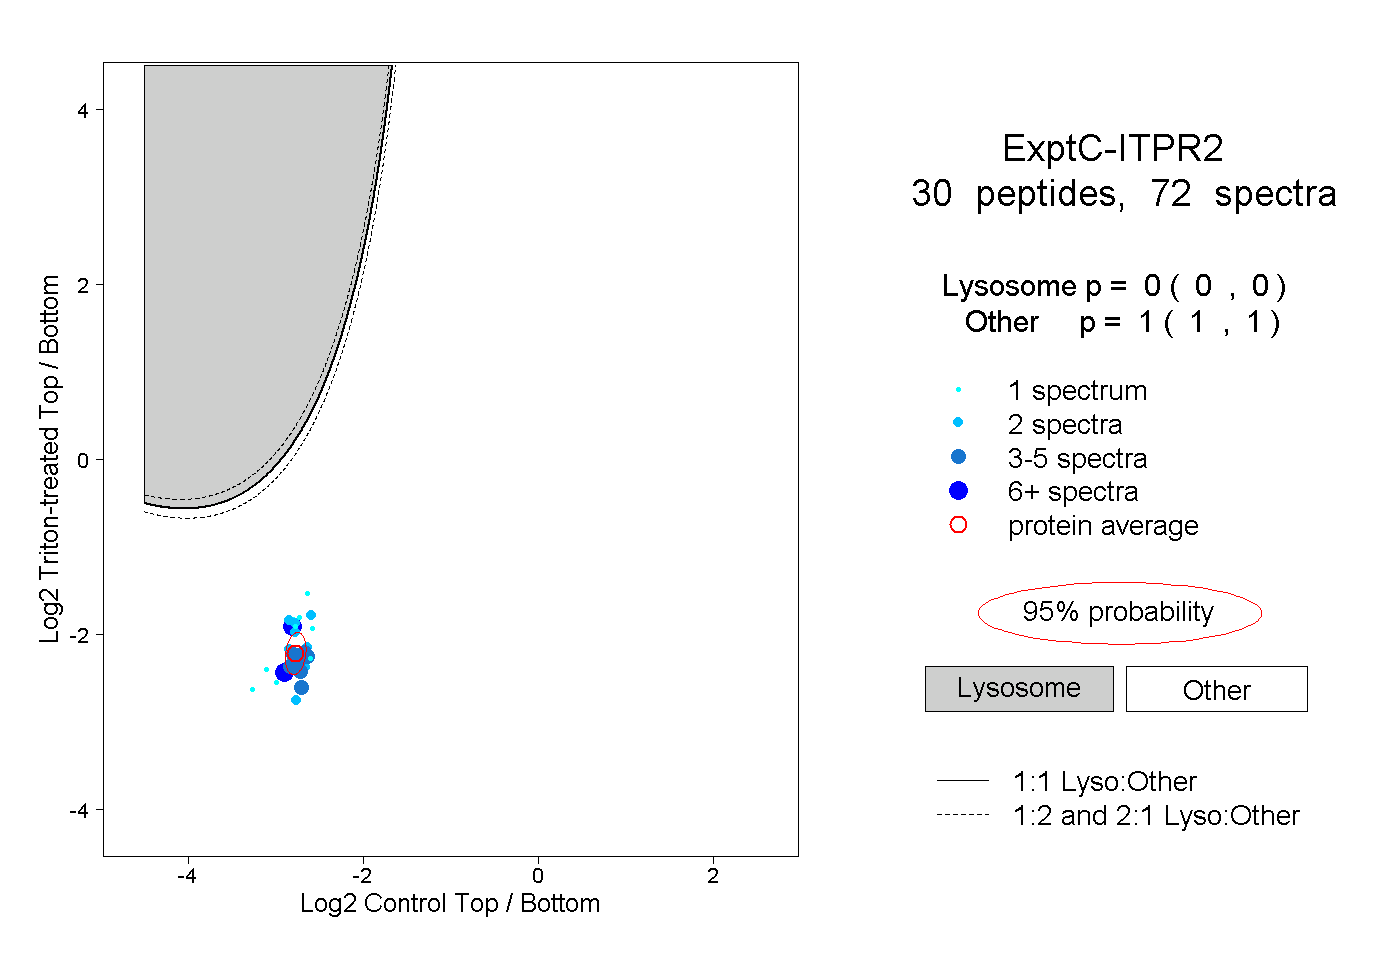
0.000 | 0.000
1.000 | 1.000
6peptides
spectra
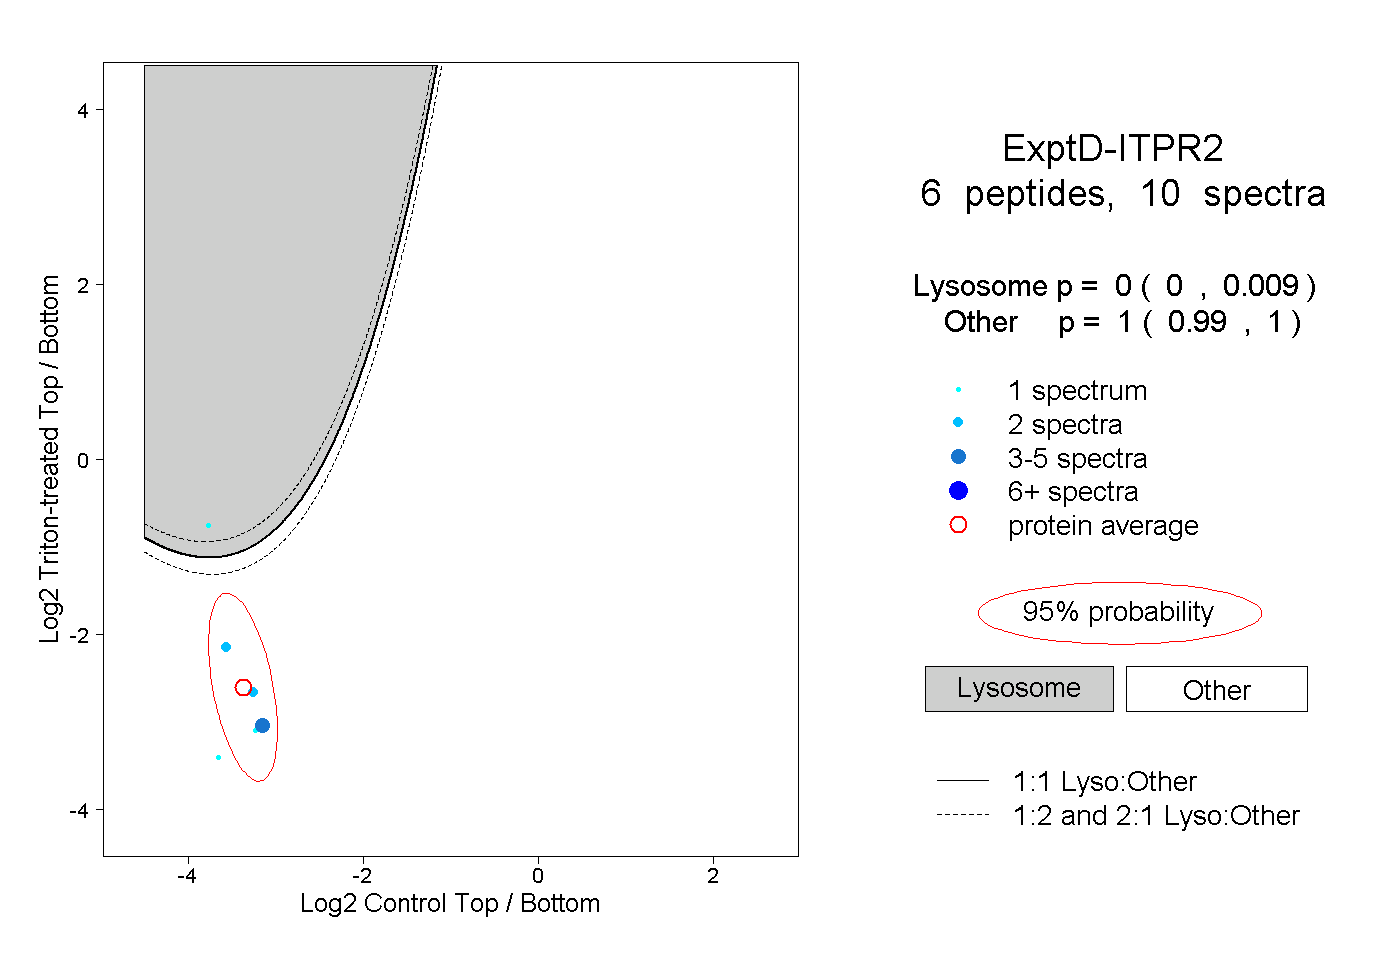
0.000 | 0.009
0.990 | 1.000