ITPR2
[ENSRNOP00000047905]
Main page
| | | Plot |
Mito |
Lyso |
|
Perox |
ER |
Golgi |
PM |
Cytosol |
Nucleus |
|
| Expt A |
 51
51
peptides |
116
spectra |
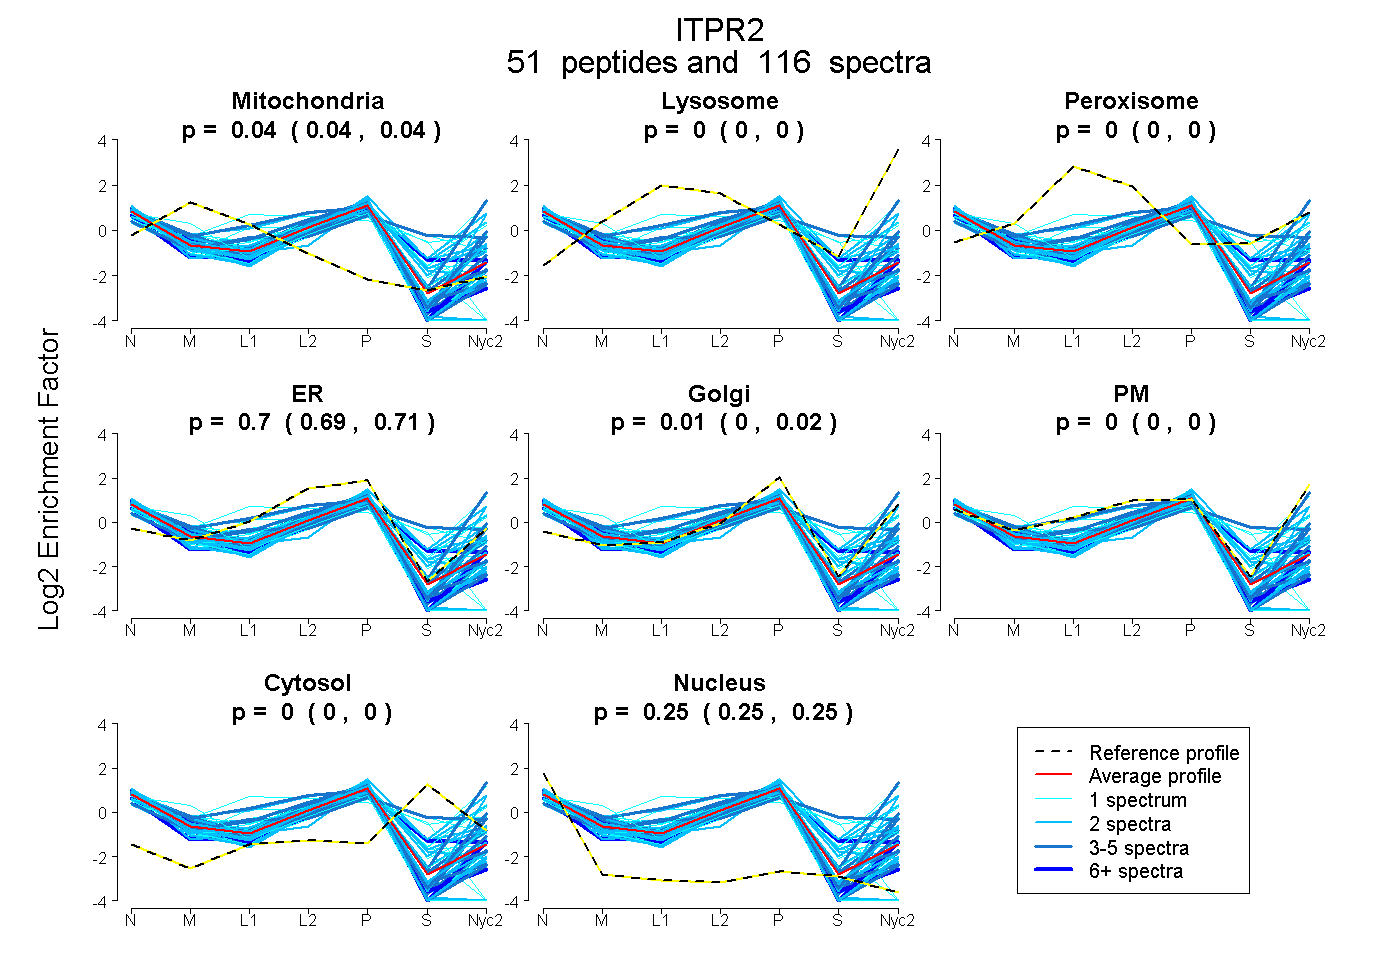 |
0.039
0.037 | 0.041 |
0.000
0.000 | 0.000 |
|
0.000
0.000 | 0.000 |
0.704
0.693 | 0.708 |
0.006
0.000 | 0.015 |
0.000
0.000 | 0.000 |
0.000
0.000 | 0.000 |
0.252
0.248 | 0.254 |
|
| | | Plot |
Mito |
|
Lyso or Perox |
|
ER |
Golgi |
PM |
Cytosol |
Nucleus |
|
| Expt B |
13
peptides |
23
spectra |
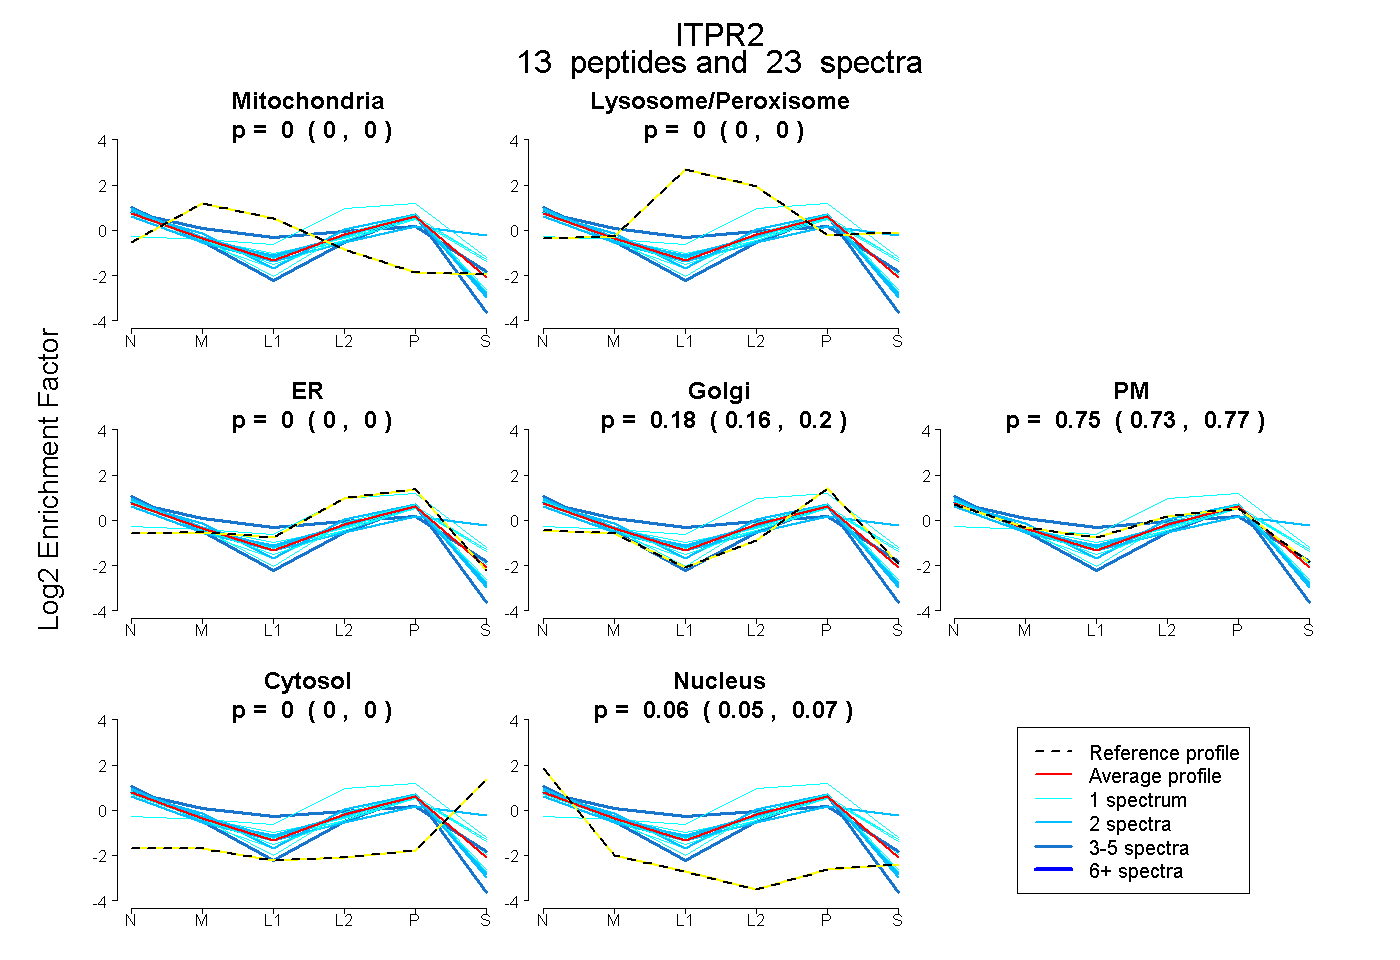 |
0.000
0.000 | 0.000 |
|
0.000
0.000 | 0.000 |
|
0.000
0.000 | 0.000 |
0.185
0.164 | 0.202 |
0.755
0.731 | 0.773 |
0.000
0.000 | 0.000 |
0.060
0.054 | 0.066 |
|
| 1 spectrum, GQLTEASSATSK |
0.000 |
|
0.000 |
|
0.000 |
0.048 |
0.841 |
0.092 |
0.020 |
|
| 2 spectra, ILFNMRPK |
0.000 |
|
0.000 |
|
0.121 |
0.210 |
0.600 |
0.000 |
0.068 |
|
| 1 spectrum, SELWVEK |
0.000 |
|
0.000 |
|
0.000 |
0.143 |
0.755 |
0.083 |
0.018 |
|
| 1 spectrum, LLLALMESR |
0.000 |
|
0.000 |
|
0.027 |
0.314 |
0.564 |
0.000 |
0.095 |
|
| 1 spectrum, LLETLR |
0.000 |
|
0.182 |
|
0.557 |
0.160 |
0.069 |
0.032 |
0.000 |
|
| 1 spectrum, ELQNFLR |
0.000 |
|
0.000 |
|
0.000 |
0.132 |
0.763 |
0.000 |
0.105 |
|
| 2 spectra, LLGEIVK |
0.000 |
|
0.000 |
|
0.000 |
0.000 |
0.700 |
0.300 |
0.000 |
|
| 1 spectrum, YQLNLFAR |
0.000 |
|
0.000 |
|
0.000 |
0.191 |
0.680 |
0.057 |
0.072 |
|
| 2 spectra, LTFEVVHLAR |
0.000 |
|
0.000 |
|
0.091 |
0.094 |
0.713 |
0.000 |
0.102 |
|
| 1 spectrum, AEVLQAFK |
0.000 |
|
0.000 |
|
0.056 |
0.215 |
0.620 |
0.000 |
0.110 |
|
| 4 spectra, EIETFVSLLR |
0.000 |
|
0.000 |
|
0.282 |
0.275 |
0.204 |
0.000 |
0.239 |
|
| 4 spectra, FLQLLCENHNR |
0.164 |
|
0.033 |
|
0.000 |
0.000 |
0.799 |
0.000 |
0.004 |
|
| 2 spectra, HVEYLR |
0.000 |
|
0.000 |
|
0.213 |
0.035 |
0.623 |
0.000 |
0.129 |
|
| | | Plot |
|
Lyso |
|
|
|
|
|
|
|
Other |
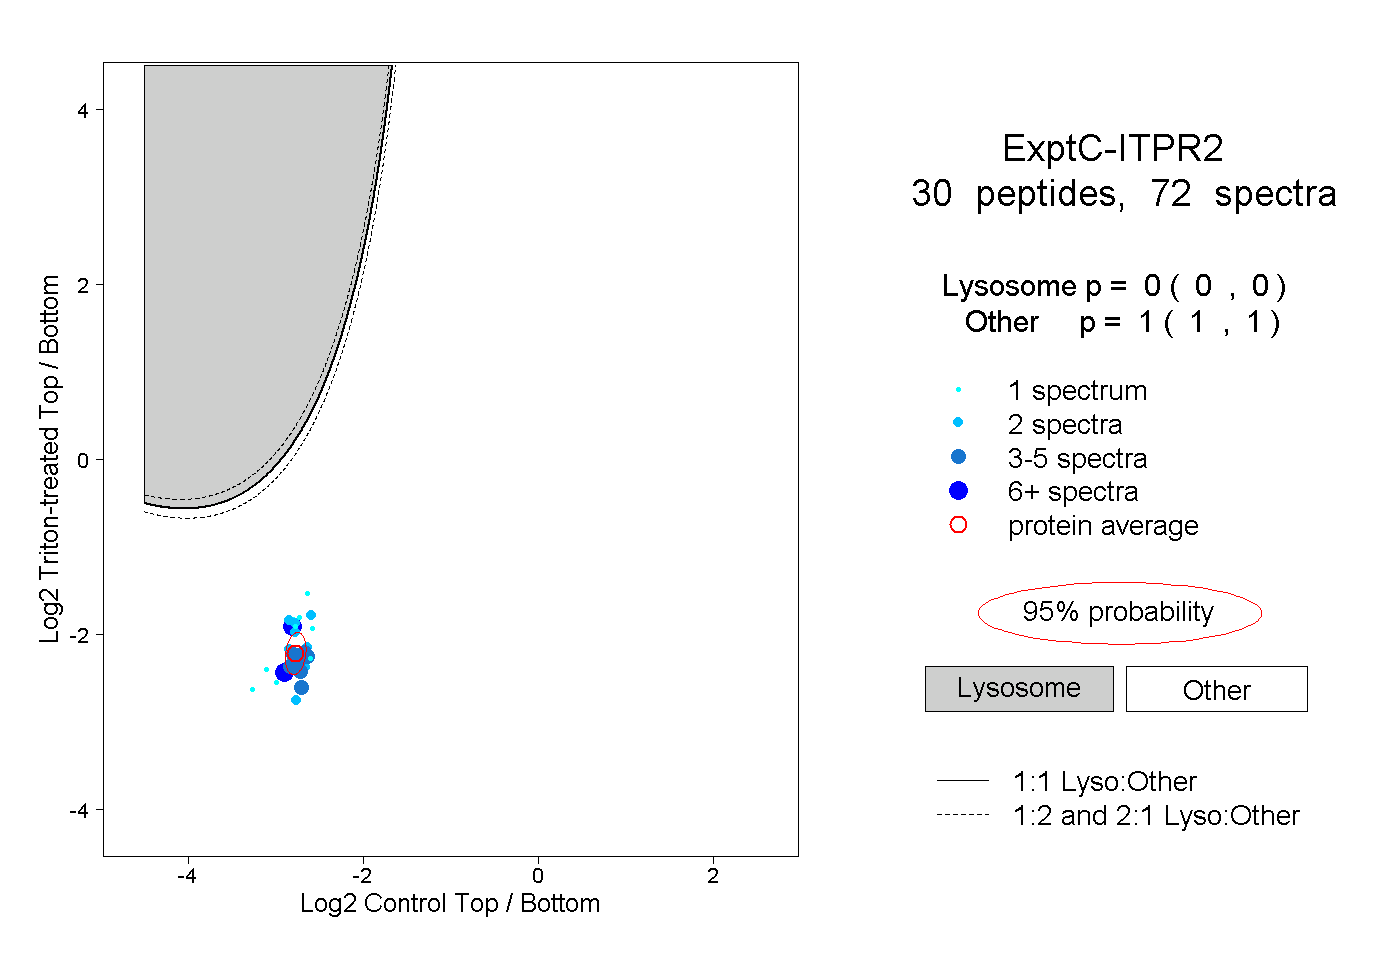
| Expt C |
30
peptides |
72
spectra |
 |
|
0.000
0.000 | 0.000 |
|
|
|
|
|
|
|
1.000
1.000 | 1.000 |
| | | Plot |
|
Lyso |
|
|
|
|
|
|
|
Other |
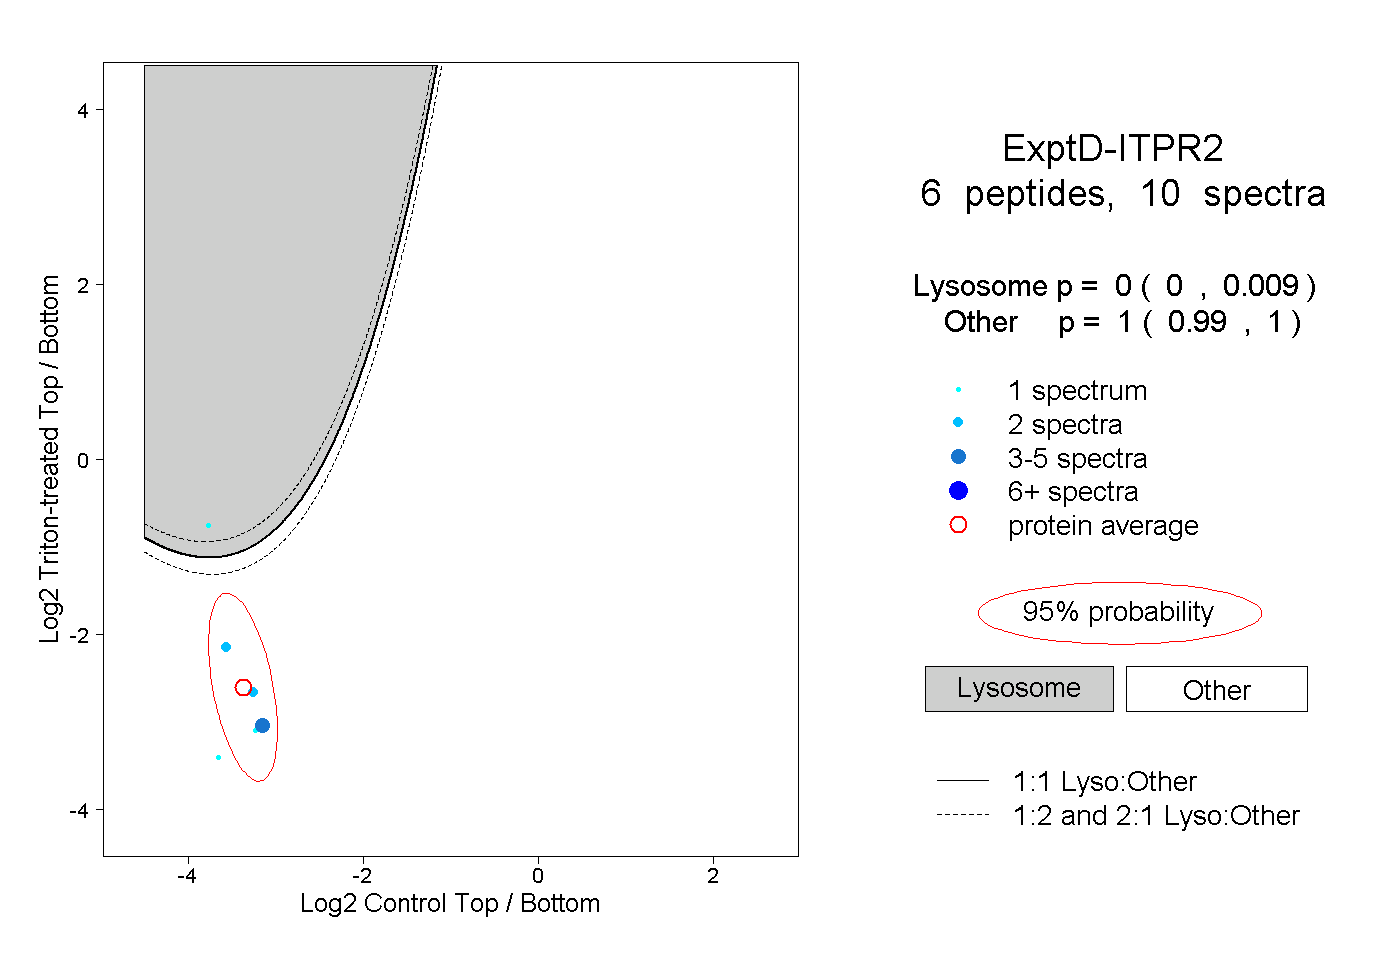
| Expt D |
6
peptides |
10
spectra |
 |
|
0.000
0.000 | 0.009 |
|
|
|
|
|
|
|
1.000
0.990 | 1.000 |