 12
12peptides
spectra
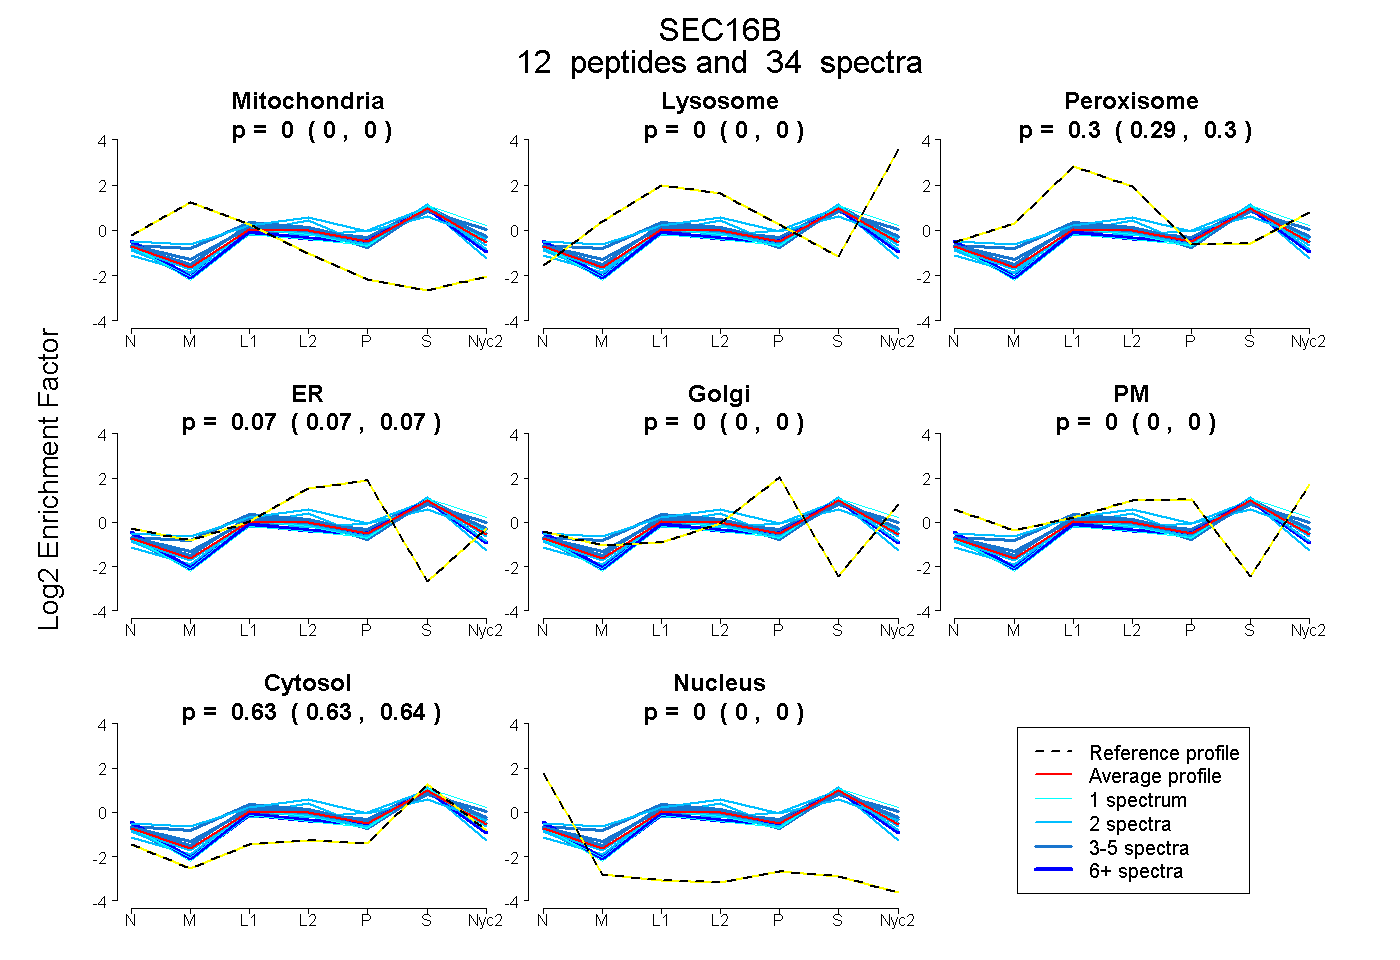
0.000 | 0.000
0.000 | 0.000
0.291 | 0.302
0.066 | 0.075
0.000 | 0.000
0.000 | 0.000
0.628 | 0.636
0.000 | 0.000
9peptides
spectra
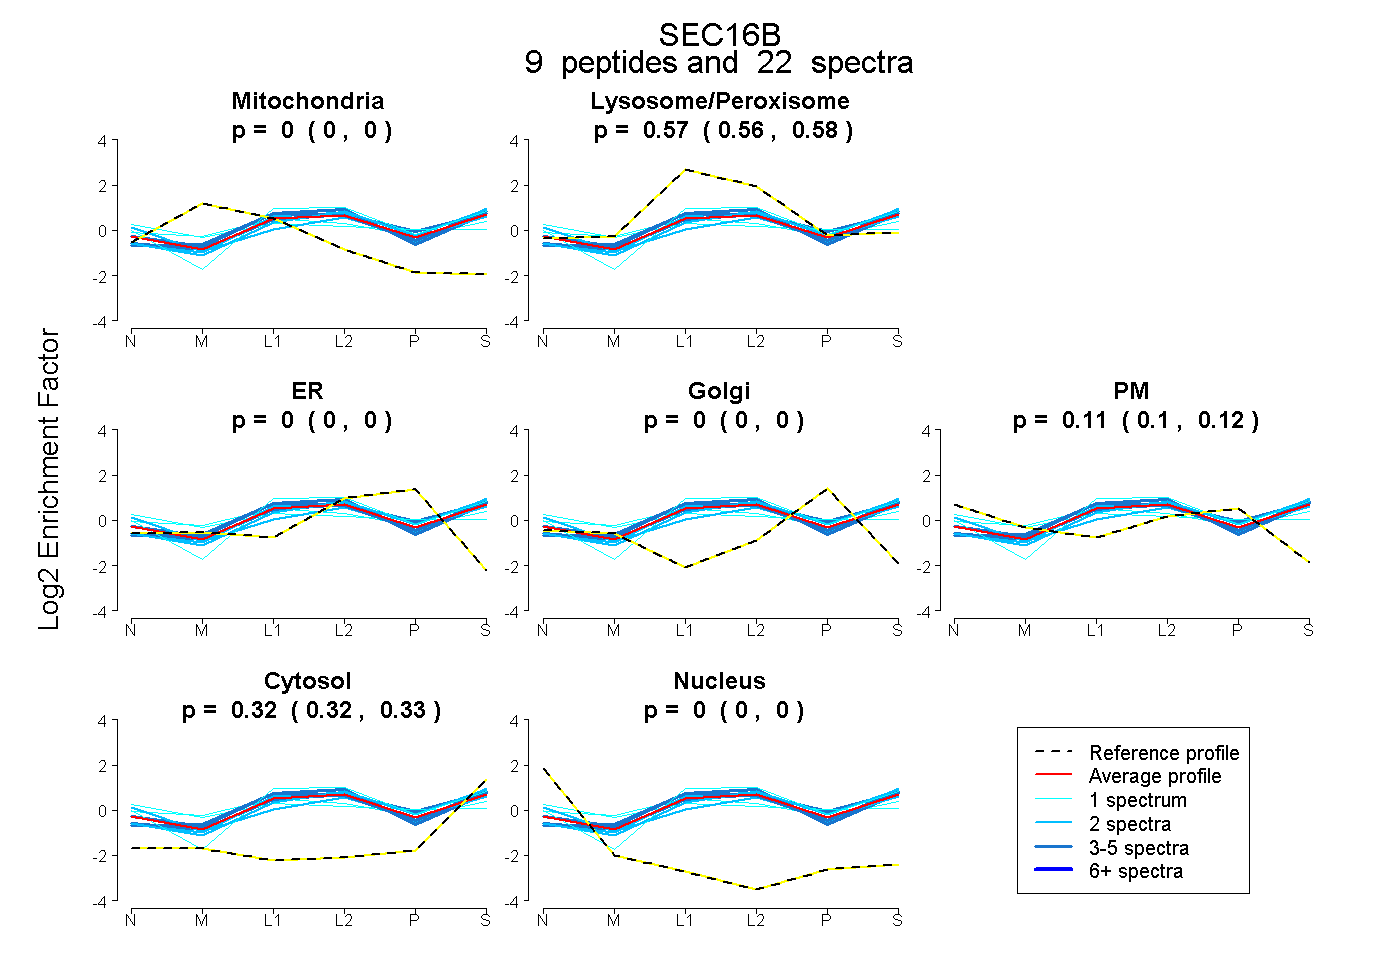
0.000 | 0.000
0.561 | 0.576
0.000 | 0.000
0.000 | 0.000
0.098 | 0.117
0.316 | 0.328
0.000 | 0.000
10peptides
spectra
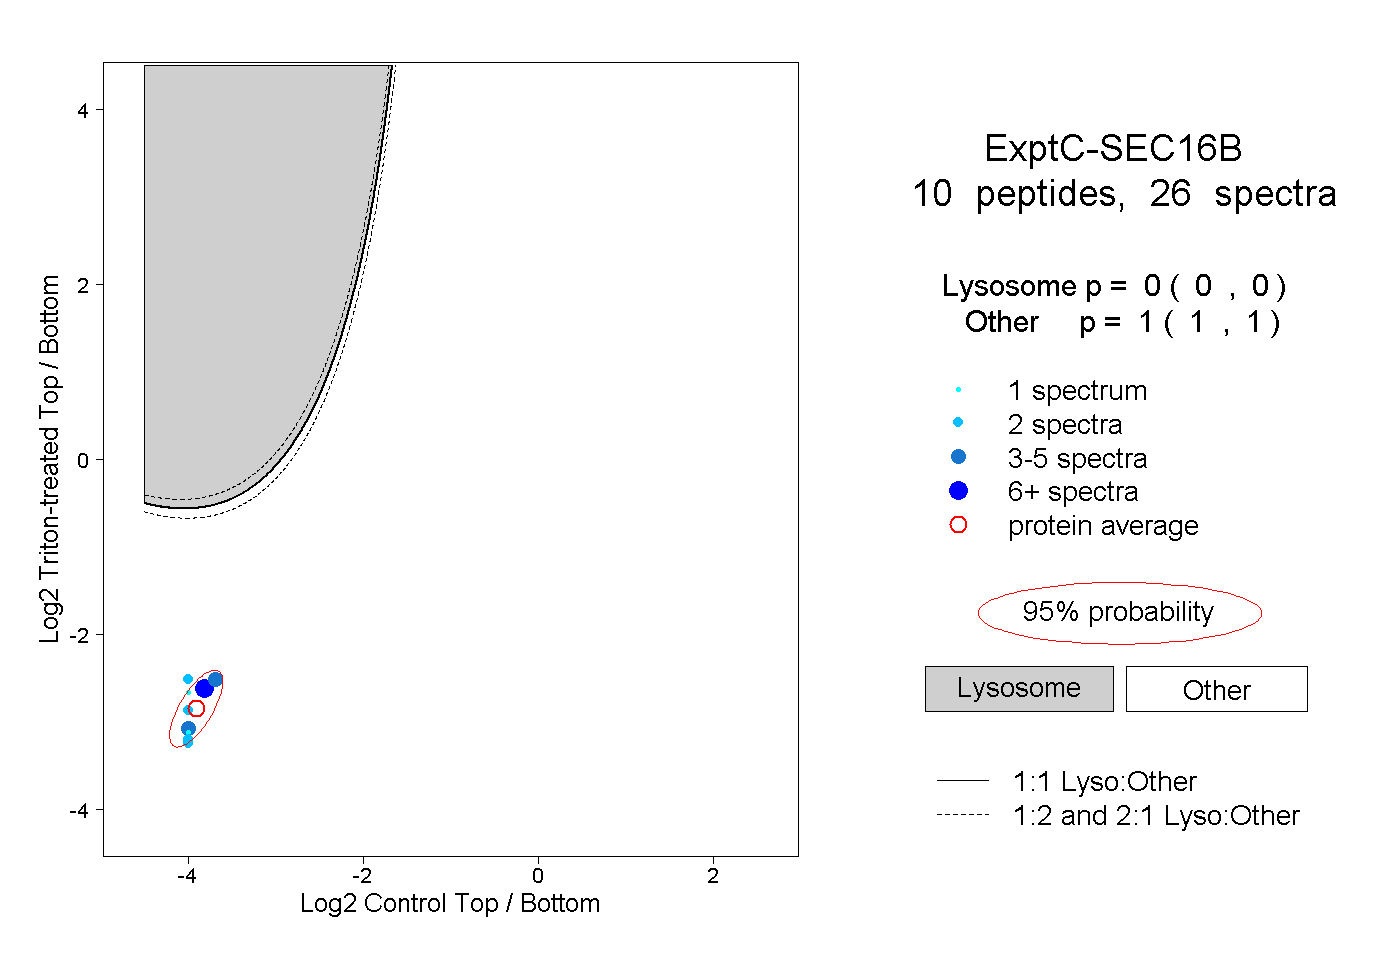
0.000 | 0.000
1.000 | 1.000
3peptides
spectra
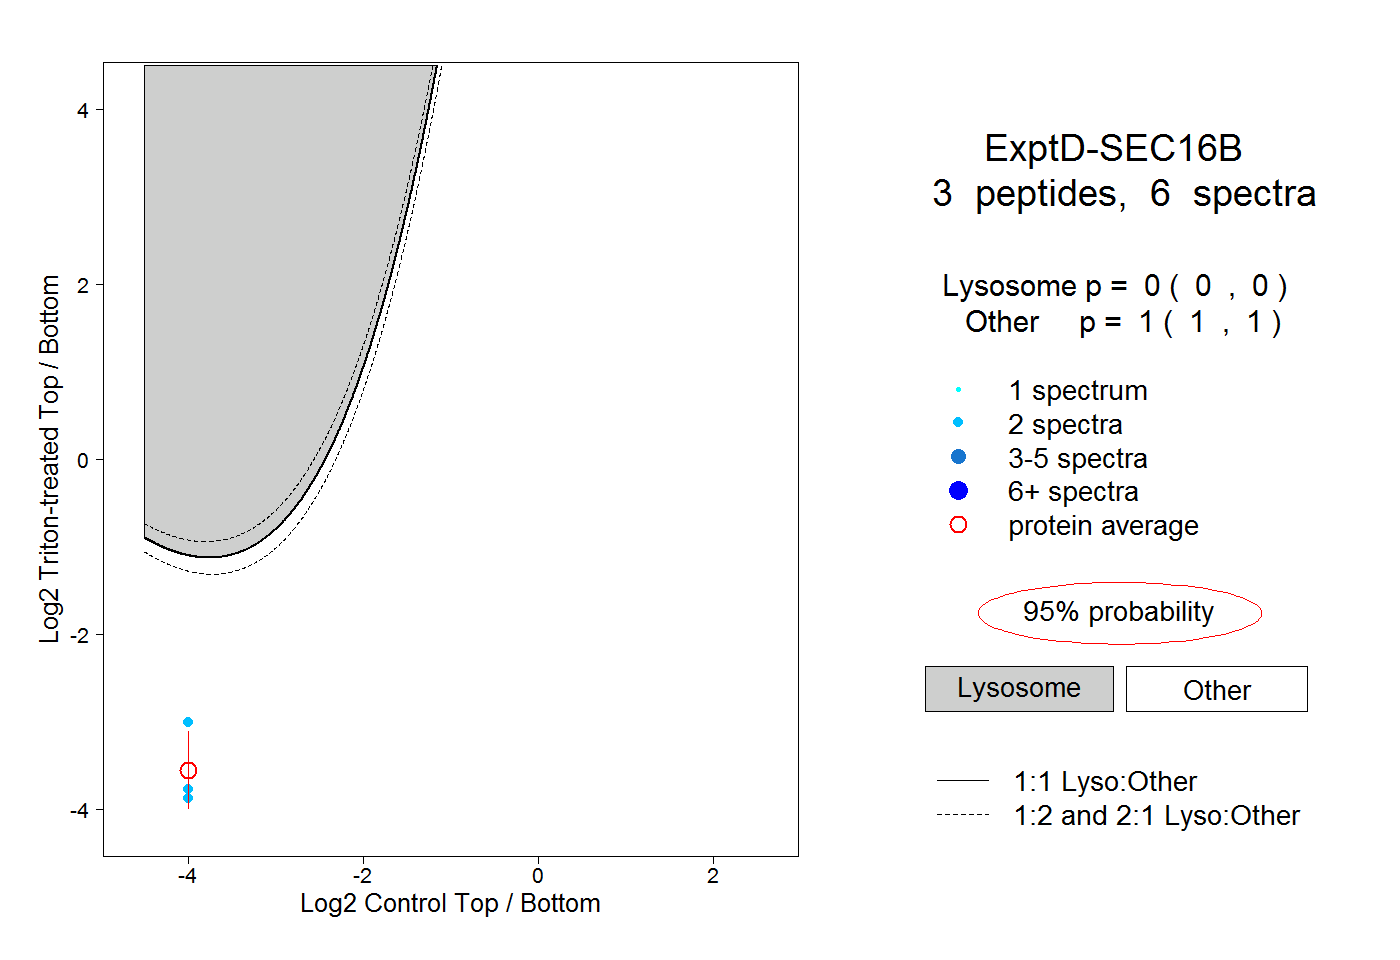
0.000 | 0.000
1.000 | 1.000