 12
12peptides
spectra
0.000 | 0.000
0.000 | 0.000
0.291 | 0.302
0.066 | 0.075
0.000 | 0.000
0.000 | 0.000
0.628 | 0.636
0.000 | 0.000
| Plot | Mito | Lyso | Perox | ER | Golgi | PM | Cytosol | Nucleus | |||||
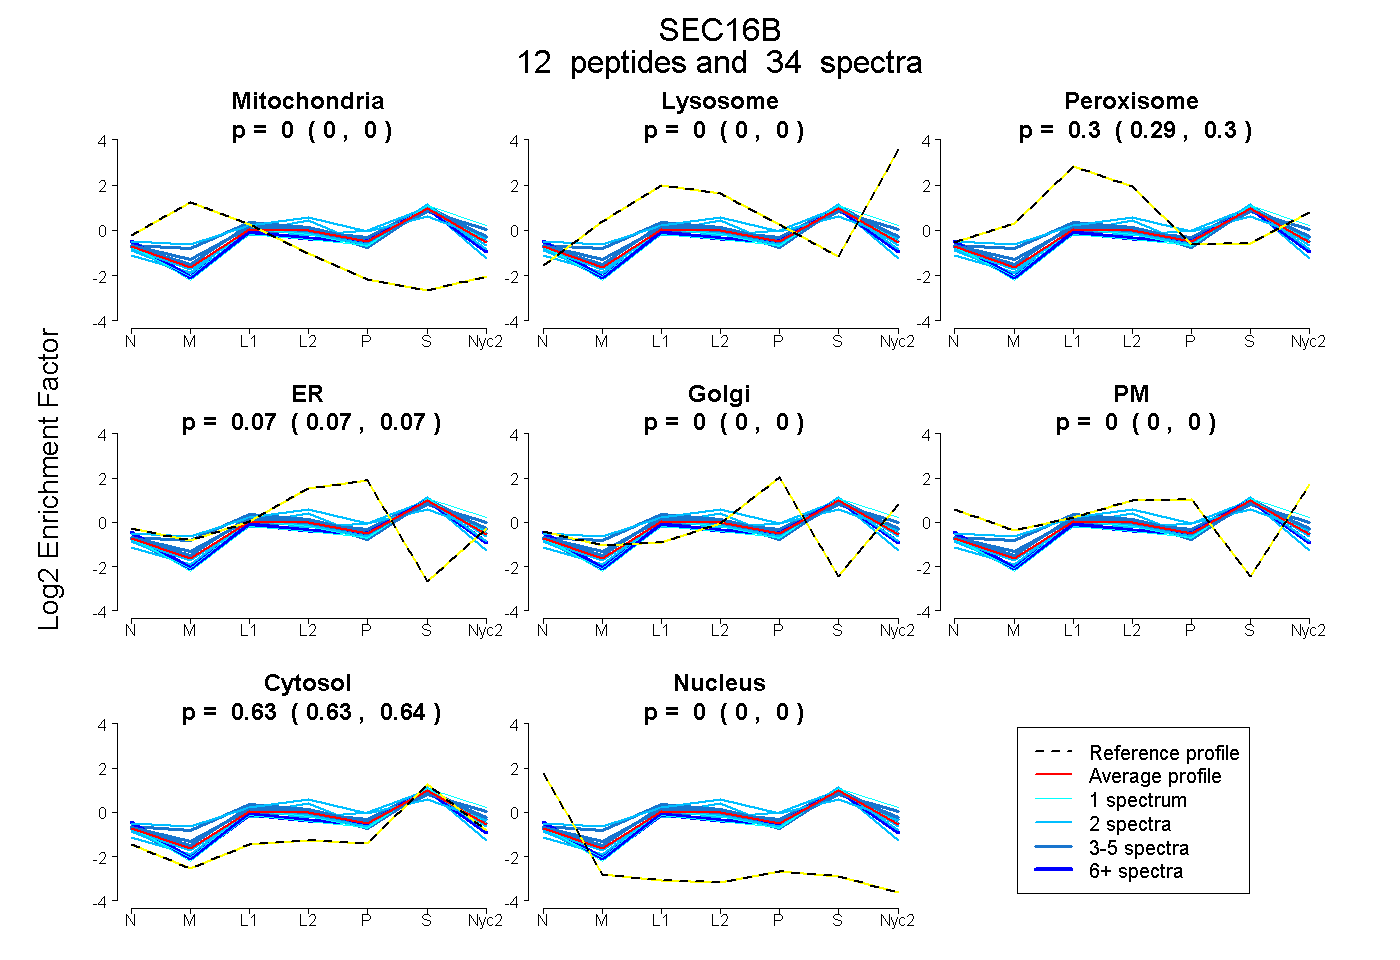
| Expt A |
12 peptides |
34 spectra |
|
0.000 0.000 | 0.000 |
0.000 0.000 | 0.000 |
0.297 0.291 | 0.302 |
0.071 0.066 | 0.075 |
0.000 0.000 | 0.000 |
0.000 0.000 | 0.000 |
0.632 0.628 | 0.636 |
0.000 0.000 | 0.000 |
| 2 spectra, EALEWAMK | 0.000 | 0.000 | 0.137 | 0.182 | 0.000 | 0.000 | 0.681 | 0.000 | ||
| 4 spectra, FTNLLYYGR | 0.000 | 0.000 | 0.432 | 0.000 | 0.024 | 0.032 | 0.512 | 0.000 | ||
| 2 spectra, ELEQTR | 0.000 | 0.000 | 0.315 | 0.060 | 0.000 | 0.000 | 0.625 | 0.000 | ||
| 4 spectra, AFPGPLIR | 0.000 | 0.000 | 0.248 | 0.093 | 0.000 | 0.000 | 0.659 | 0.000 | ||
| 3 spectra, IIYASR | 0.000 | 0.000 | 0.378 | 0.002 | 0.000 | 0.000 | 0.620 | 0.000 | ||
| 1 spectrum, SETPGSR | 0.000 | 0.000 | 0.222 | 0.047 | 0.000 | 0.000 | 0.731 | 0.000 | ||
| 2 spectra, AIVSMGDTLAGK | 0.000 | 0.000 | 0.266 | 0.036 | 0.000 | 0.000 | 0.698 | 0.000 | ||
| 2 spectra, NHLWGHALFLASK | 0.000 | 0.000 | 0.377 | 0.177 | 0.000 | 0.000 | 0.446 | 0.000 | ||
| 2 spectra, LSDPLVLESR | 0.000 | 0.000 | 0.287 | 0.039 | 0.000 | 0.000 | 0.674 | 0.000 | ||
| 3 spectra, VLEPDWLVQLR | 0.000 | 0.000 | 0.354 | 0.032 | 0.029 | 0.000 | 0.586 | 0.000 | ||
| 8 spectra, GTTDTPYR | 0.000 | 0.000 | 0.209 | 0.093 | 0.000 | 0.000 | 0.685 | 0.012 | ||
| 1 spectrum, SFIPSFQVYK | 0.000 | 0.086 | 0.234 | 0.000 | 0.000 | 0.011 | 0.670 | 0.000 |
| Plot | Mito | Lyso or Perox | ER | Golgi | PM | Cytosol | Nucleus | ||||||
| Expt B |
9 peptides |
22 spectra |
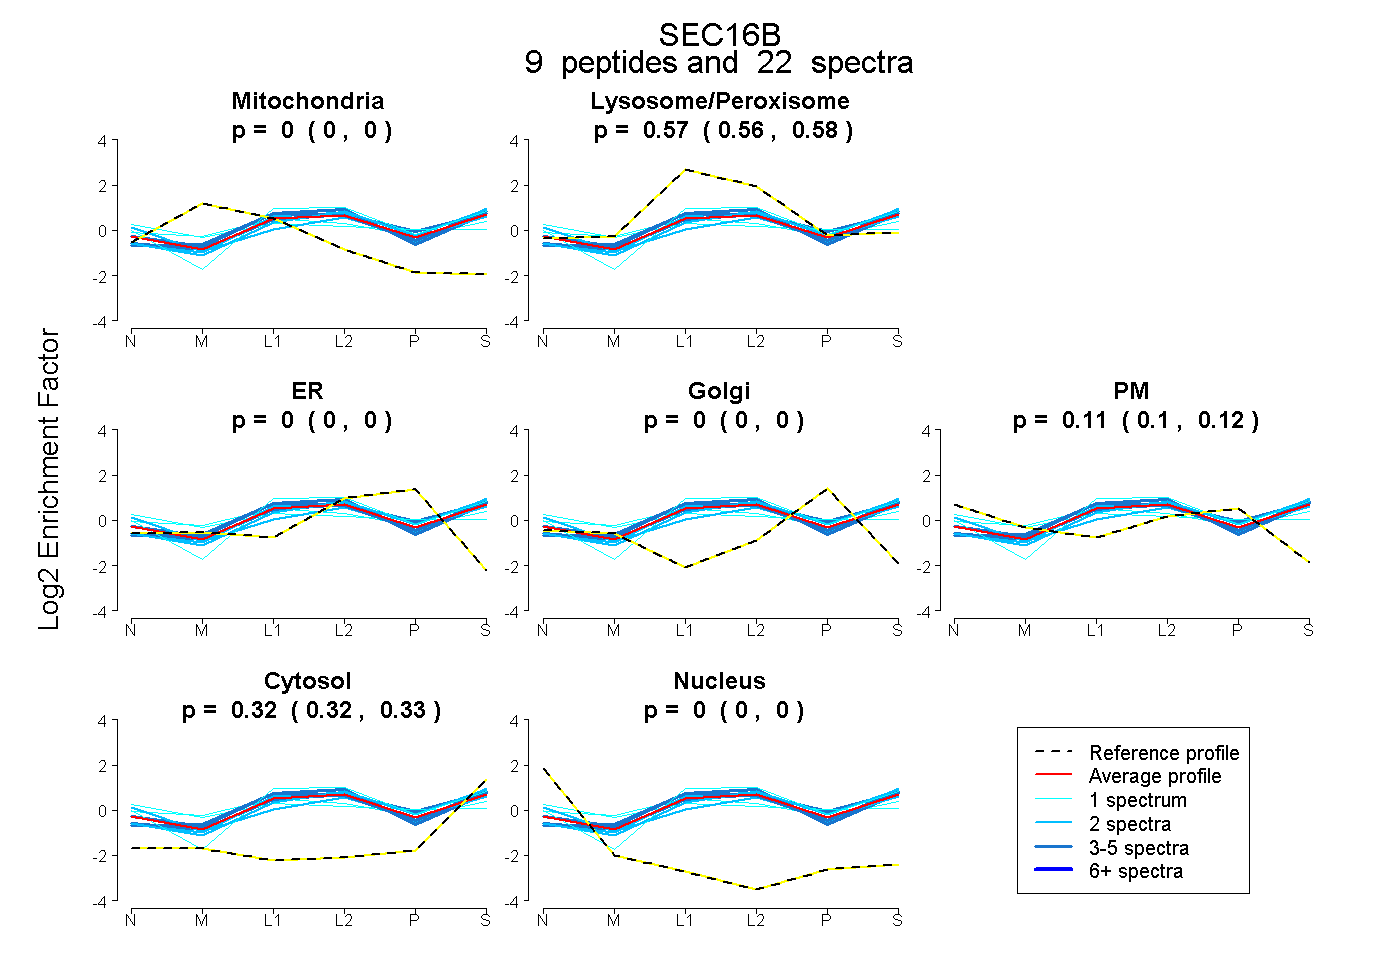 |
0.000 0.000 | 0.000 |
0.569 0.561 | 0.576 |
0.000 0.000 | 0.000 |
0.000 0.000 | 0.000 |
0.108 0.098 | 0.117 |
0.323 0.316 | 0.328 |
0.000 0.000 | 0.000 |
|||
| Plot | Lyso | Other | |||||||||||
| Expt C |
10 peptides |
26 spectra |
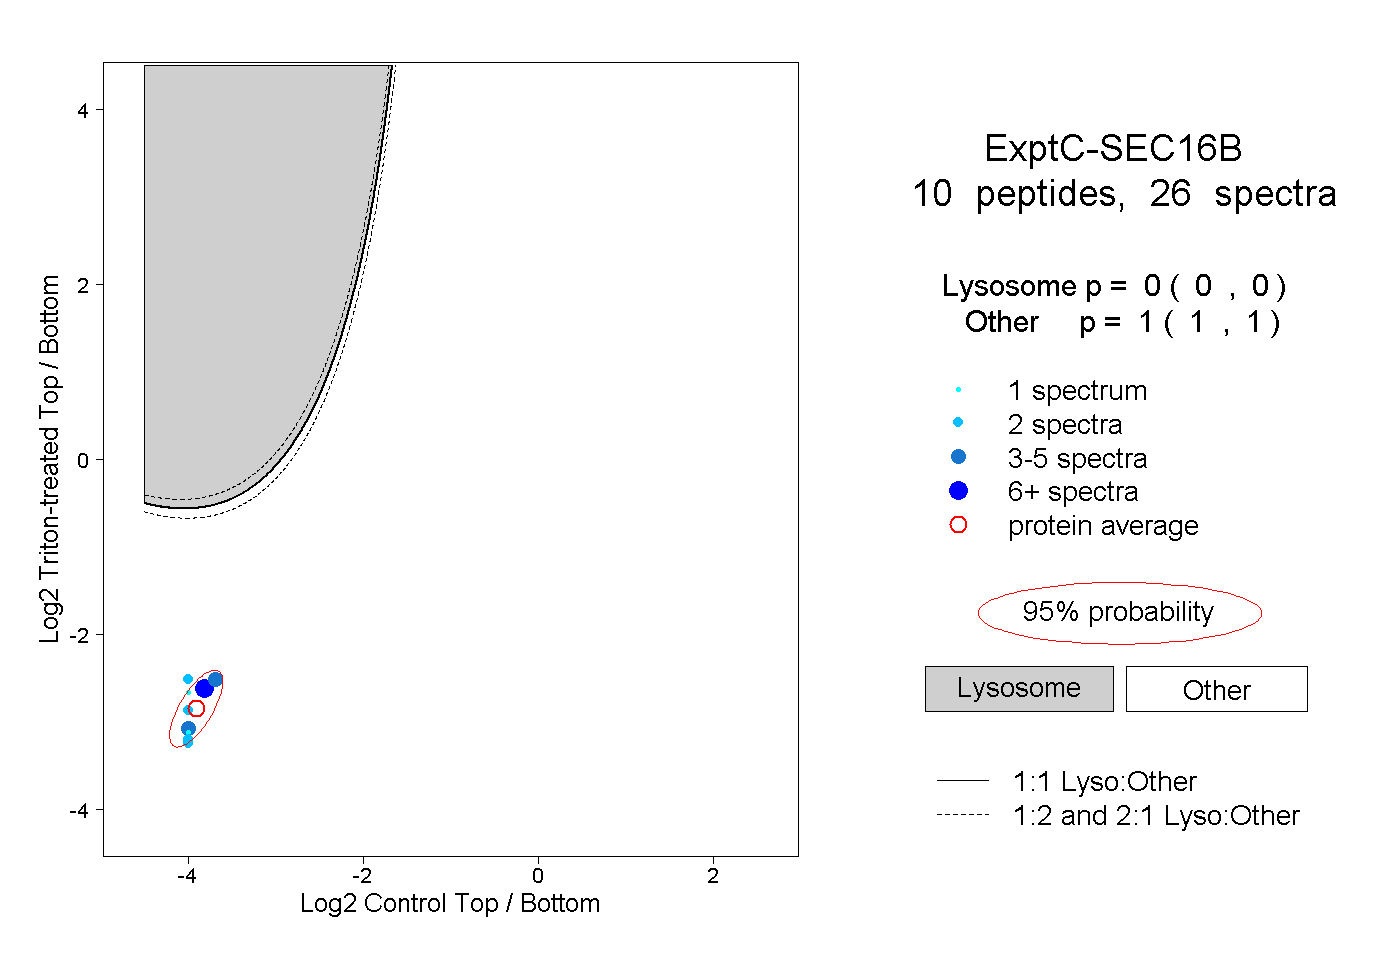 |
0.000 0.000 | 0.000 |
1.000 1.000 | 1.000 |
||||||||
| Plot | Lyso | Other | |||||||||||
| Expt D |
3 peptides |
6 spectra |
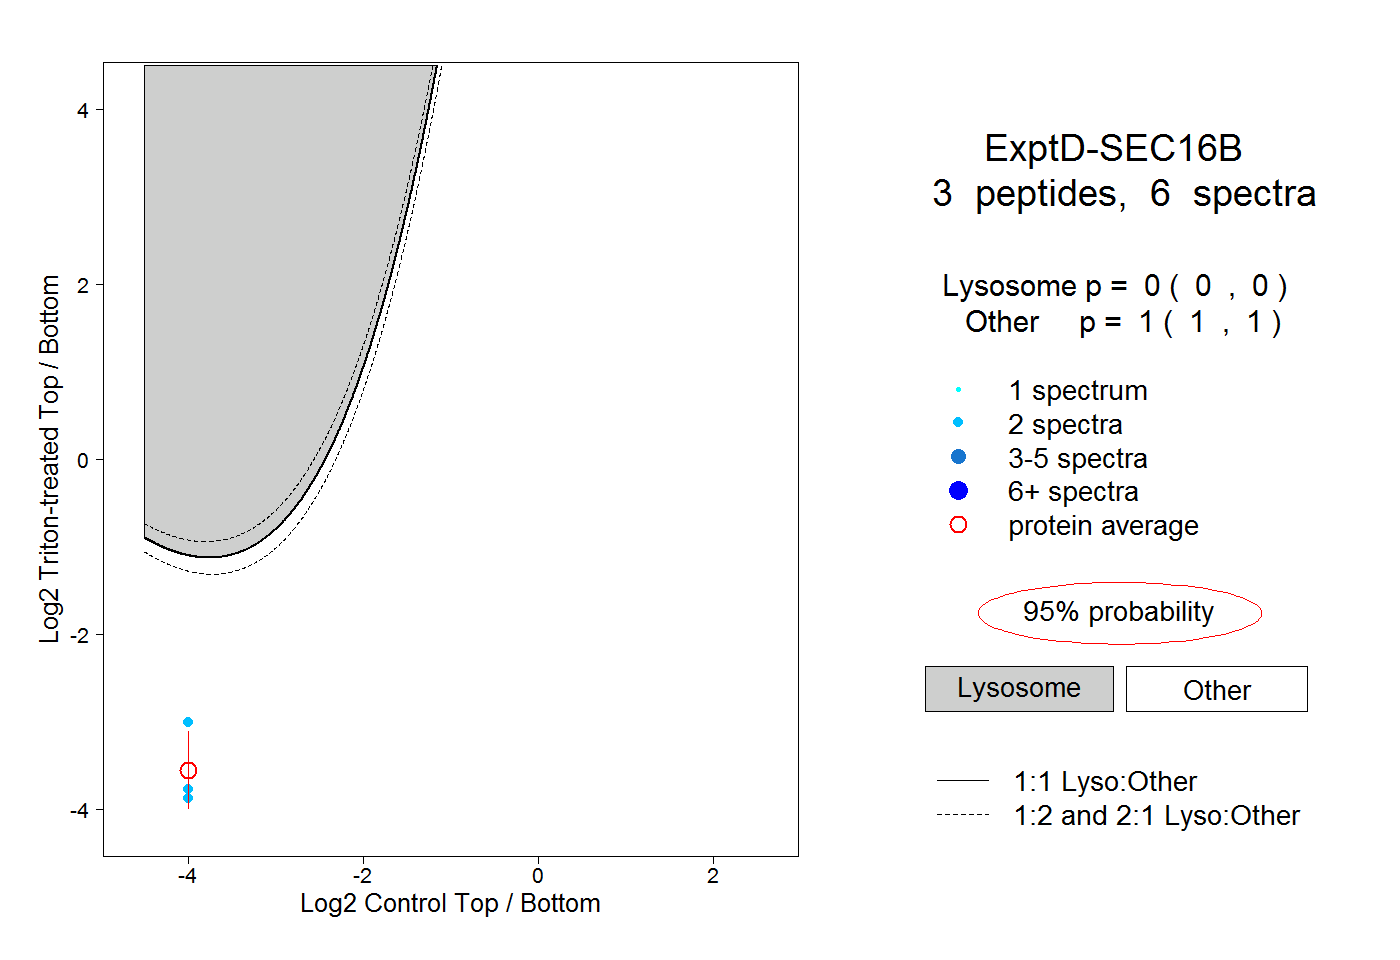 |
0.000 0.000 | 0.000 |
1.000 1.000 | 1.000 |