SEC16B
[ENSRNOP00000046286]
Main page
| | | Plot |
Mito |
Lyso |
|
Perox |
ER |
Golgi |
PM |
Cytosol |
Nucleus |
|
| Expt A |
 12
12
peptides |
34
spectra |
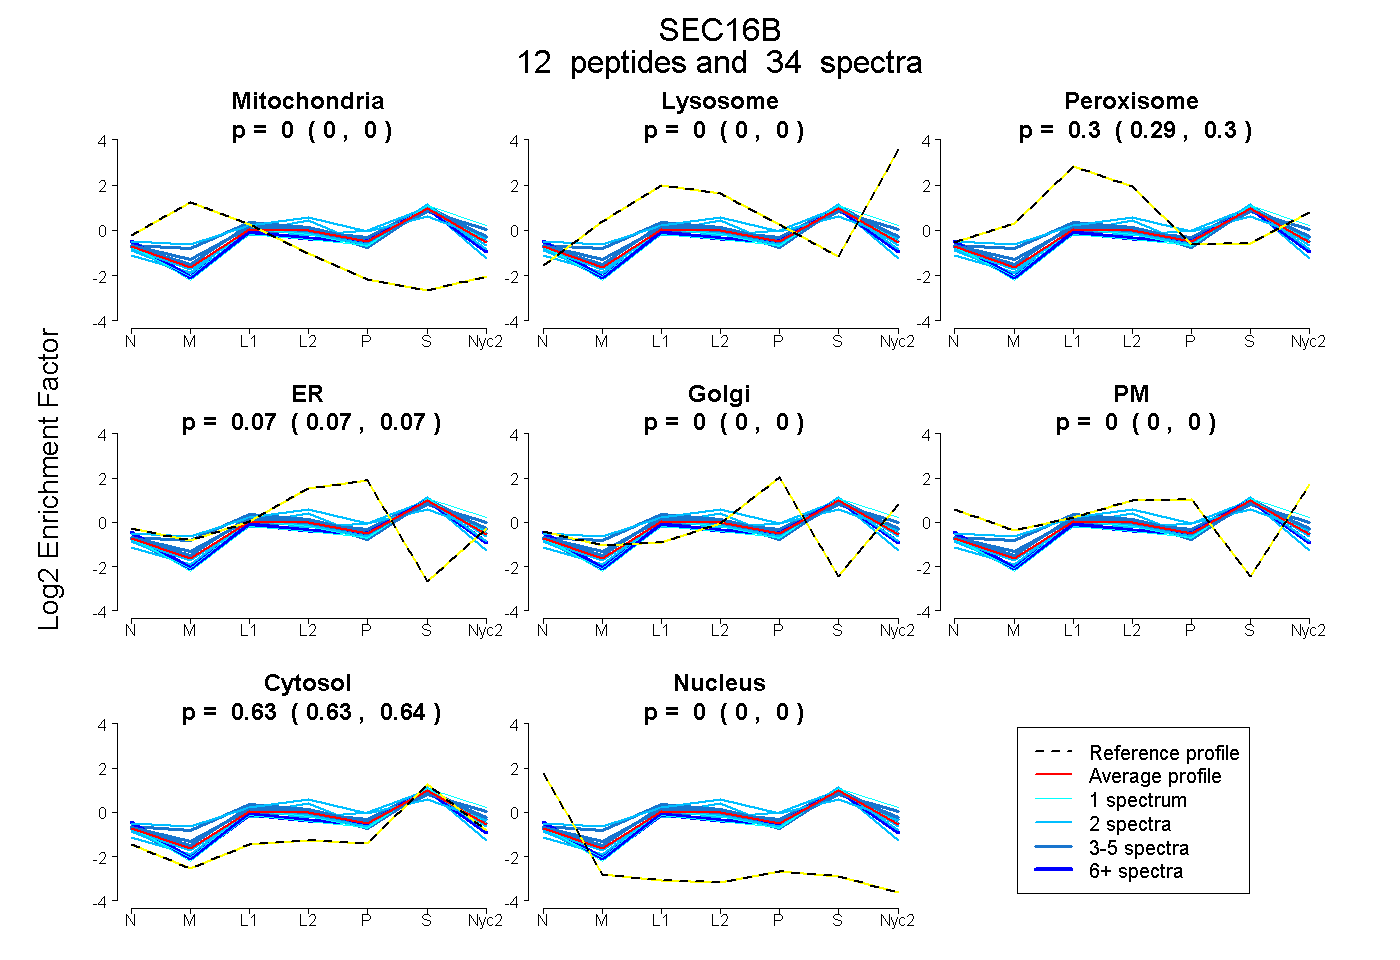 |
0.000
0.000 | 0.000 |
0.000
0.000 | 0.000 |
|
0.297
0.291 | 0.302 |
0.071
0.066 | 0.075 |
0.000
0.000 | 0.000 |
0.000
0.000 | 0.000 |
0.632
0.628 | 0.636 |
0.000
0.000 | 0.000 |
|
| | | Plot |
Mito |
|
Lyso or Perox |
|
ER |
Golgi |
PM |
Cytosol |
Nucleus |
|
| Expt B |
9
peptides |
22
spectra |
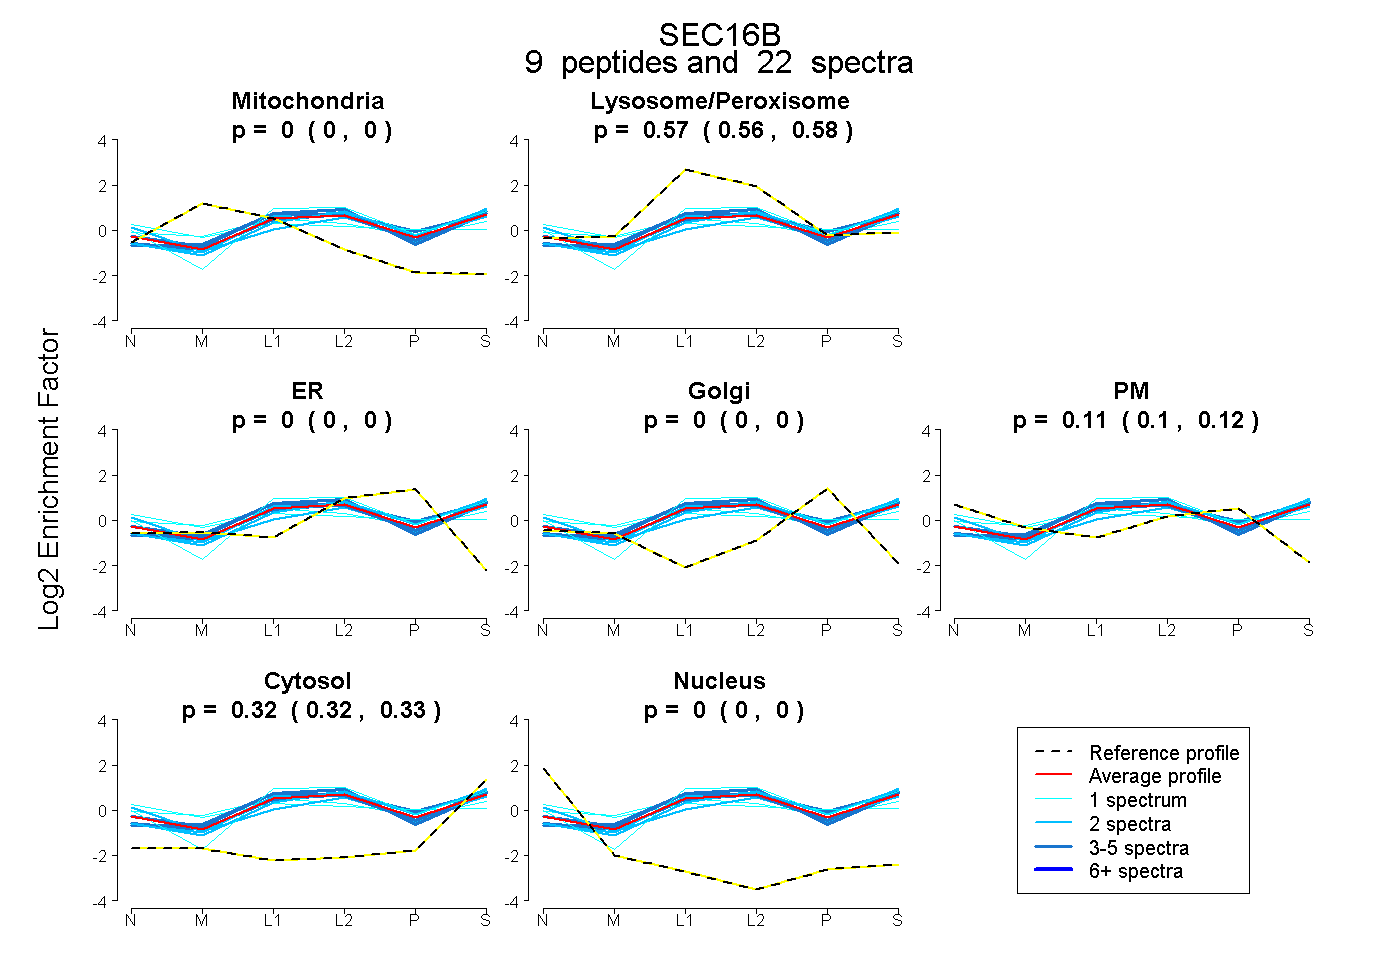 |
0.000
0.000 | 0.000 |
|
0.569
0.561 | 0.576 |
|
0.000
0.000 | 0.000 |
0.000
0.000 | 0.000 |
0.108
0.098 | 0.117 |
0.323
0.316 | 0.328 |
0.000
0.000 | 0.000 |
|
| 4 spectra, FTNLLYYGR |
0.000 |
|
0.644 |
|
0.000 |
0.000 |
0.042 |
0.314 |
0.000 |
|
| 1 spectrum, DDHQQPHYVPR |
0.000 |
|
0.389 |
|
0.000 |
0.000 |
0.396 |
0.215 |
0.000 |
|
| 2 spectra, LSDPLVLESR |
0.000 |
|
0.561 |
|
0.075 |
0.000 |
0.000 |
0.364 |
0.000 |
|
| 2 spectra, FATIEAIQR |
0.000 |
|
0.626 |
|
0.000 |
0.000 |
0.000 |
0.374 |
0.000 |
|
| 5 spectra, AFPGPLIR |
0.000 |
|
0.593 |
|
0.000 |
0.095 |
0.000 |
0.311 |
0.000 |
|
| 4 spectra, IIYASR |
0.000 |
|
0.639 |
|
0.000 |
0.010 |
0.000 |
0.351 |
0.000 |
|
| 1 spectrum, VLEPDWLVQLR |
0.000 |
|
0.664 |
|
0.000 |
0.000 |
0.039 |
0.297 |
0.000 |
|
| 2 spectra, GTTDTPYR |
0.000 |
|
0.441 |
|
0.000 |
0.000 |
0.243 |
0.315 |
0.000 |
|
| 1 spectrum, AAQCLK |
0.000 |
|
0.493 |
|
0.000 |
0.000 |
0.229 |
0.277 |
0.000 |
|
| | | Plot |
|
Lyso |
|
|
|
|
|
|
|
Other |
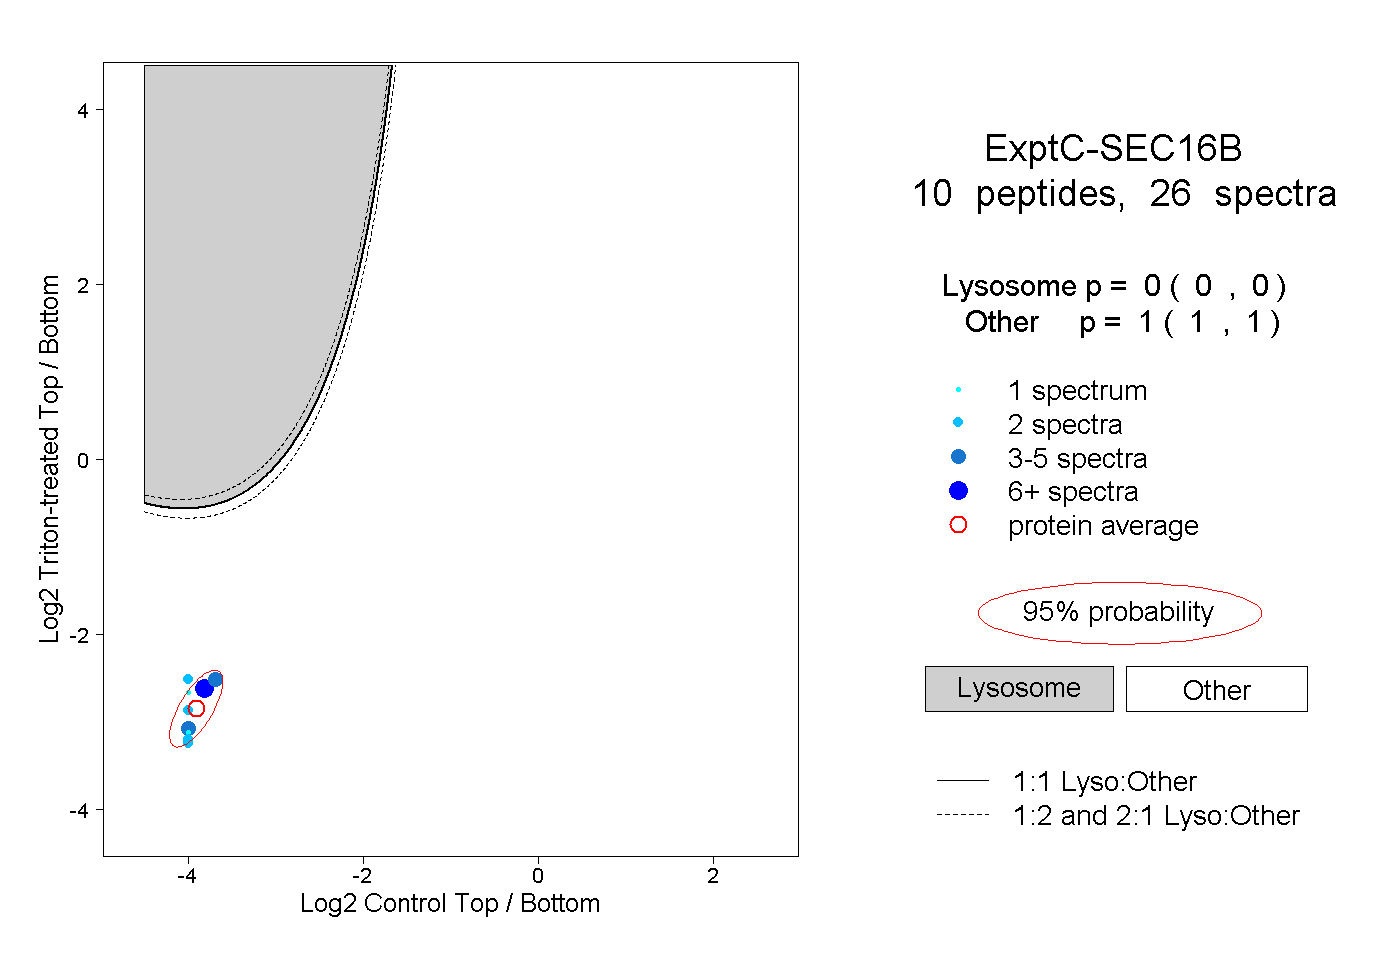
| Expt C |
10
peptides |
26
spectra |
 |
|
0.000
0.000 | 0.000 |
|
|
|
|
|
|
|
1.000
1.000 | 1.000 |
| | | Plot |
|
Lyso |
|
|
|
|
|
|
|
Other |
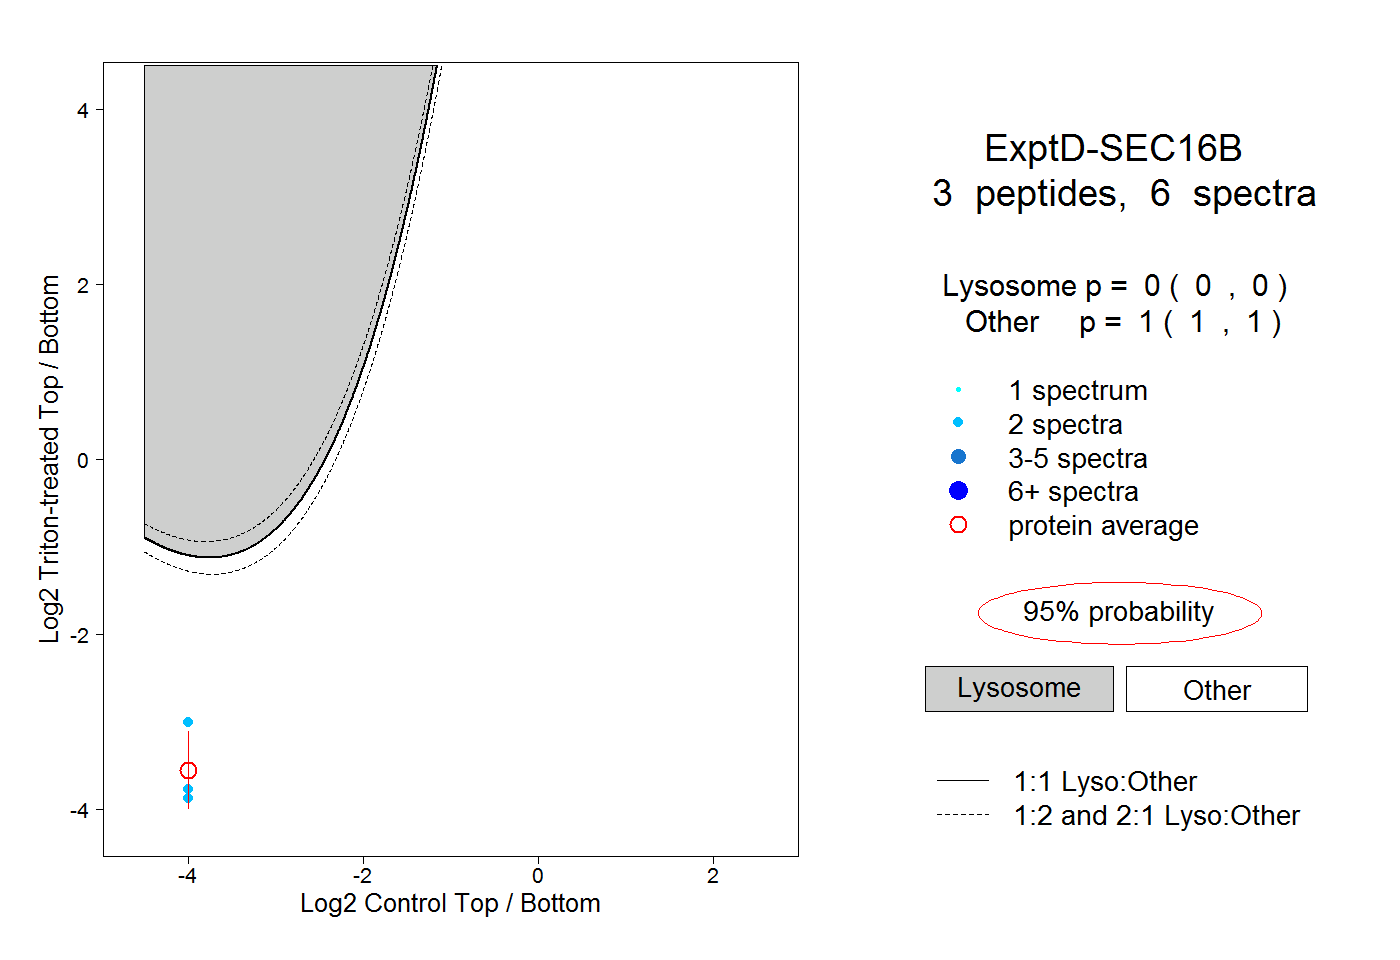
| Expt D |
3
peptides |
6
spectra |
 |
|
0.000
0.000 | 0.000 |
|
|
|
|
|
|
|
1.000
1.000 | 1.000 |