 7
7peptides
spectra
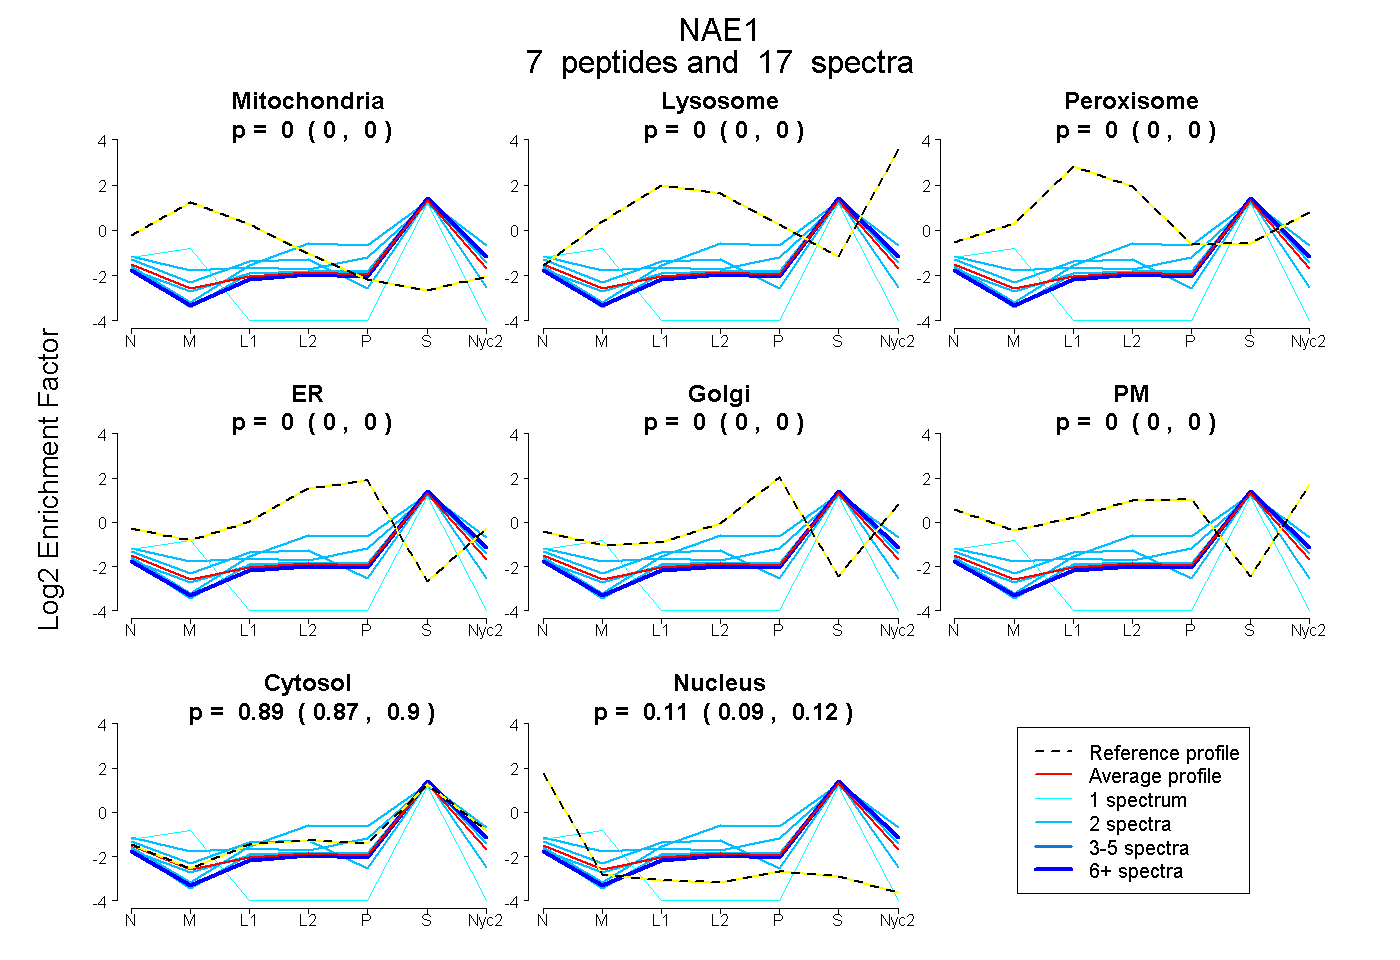
0.000 | 0.000
0.000 | 0.000
0.000 | 0.000
0.000 | 0.000
0.000 | 0.000
0.000 | 0.000
0.874 | 0.905
0.092 | 0.124
2peptides
spectra
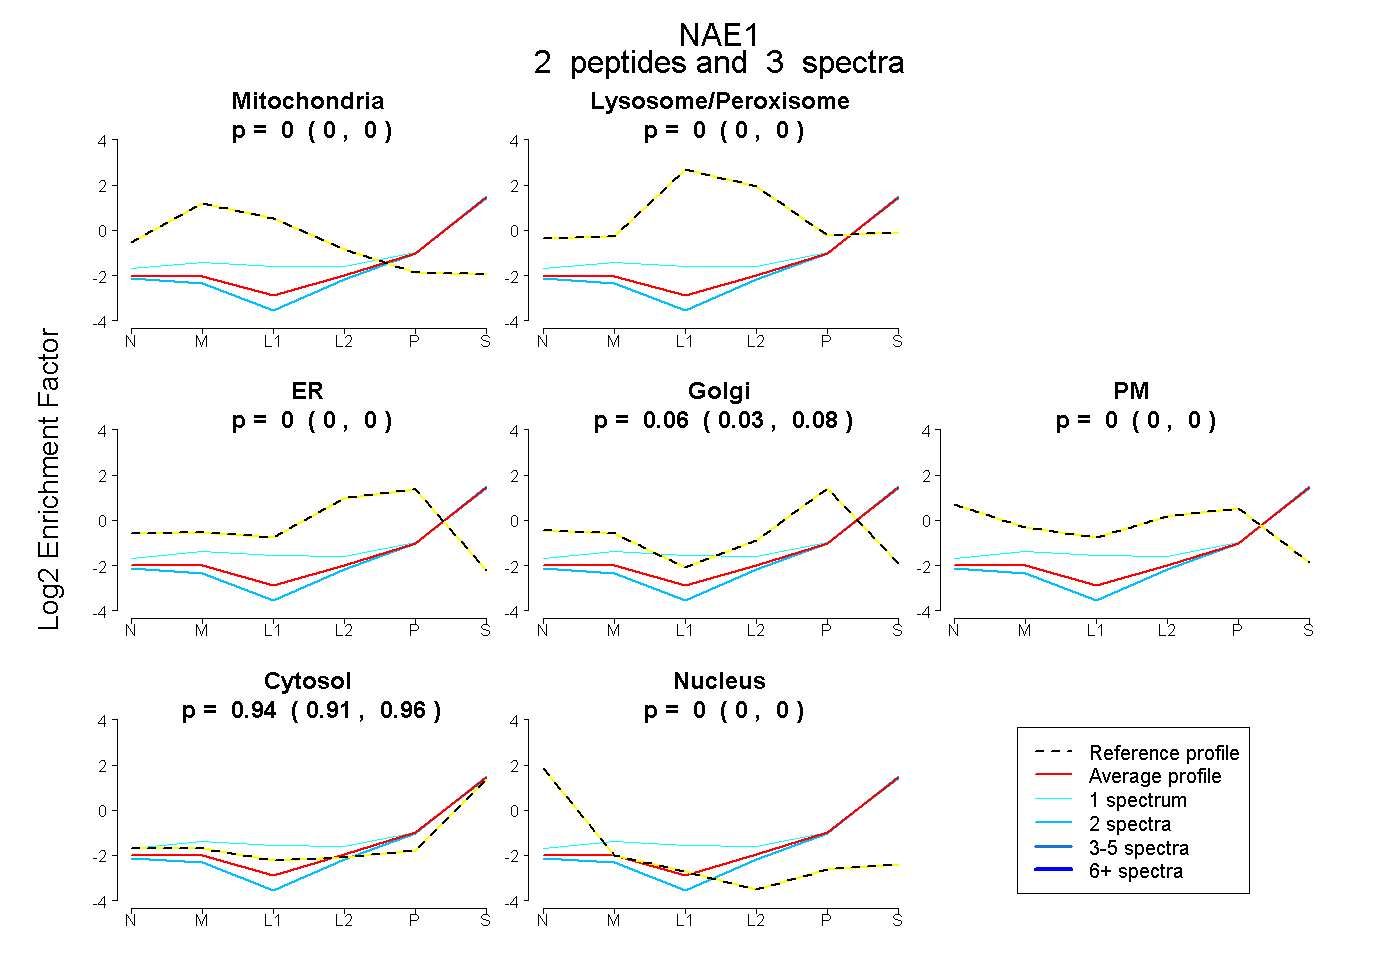
0.000 | 0.000
0.000 | 0.000
0.000 | 0.000
0.025 | 0.083
0.000 | 0.000
0.911 | 0.962
0.000 | 0.000
5peptides
spectra
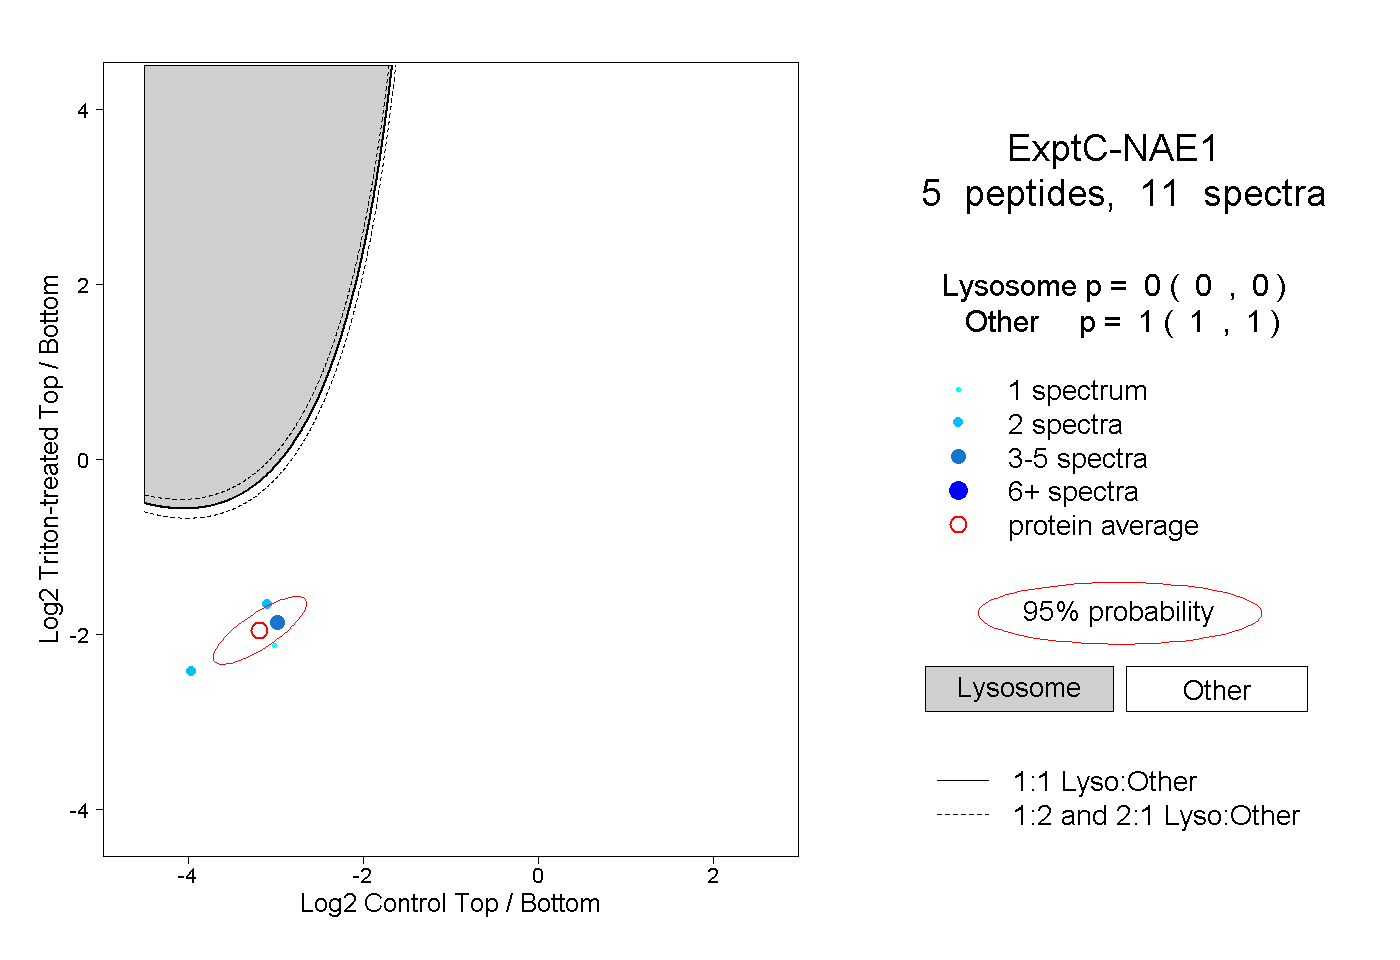
0.000 | 0.000
1.000 | 1.000