NAE1
[ENSRNOP00000045593]
Main page
| | | Plot |
Mito |
Lyso |
|
Perox |
ER |
Golgi |
PM |
Cytosol |
Nucleus |
|
| Expt A |
 7
7
peptides |
17
spectra |
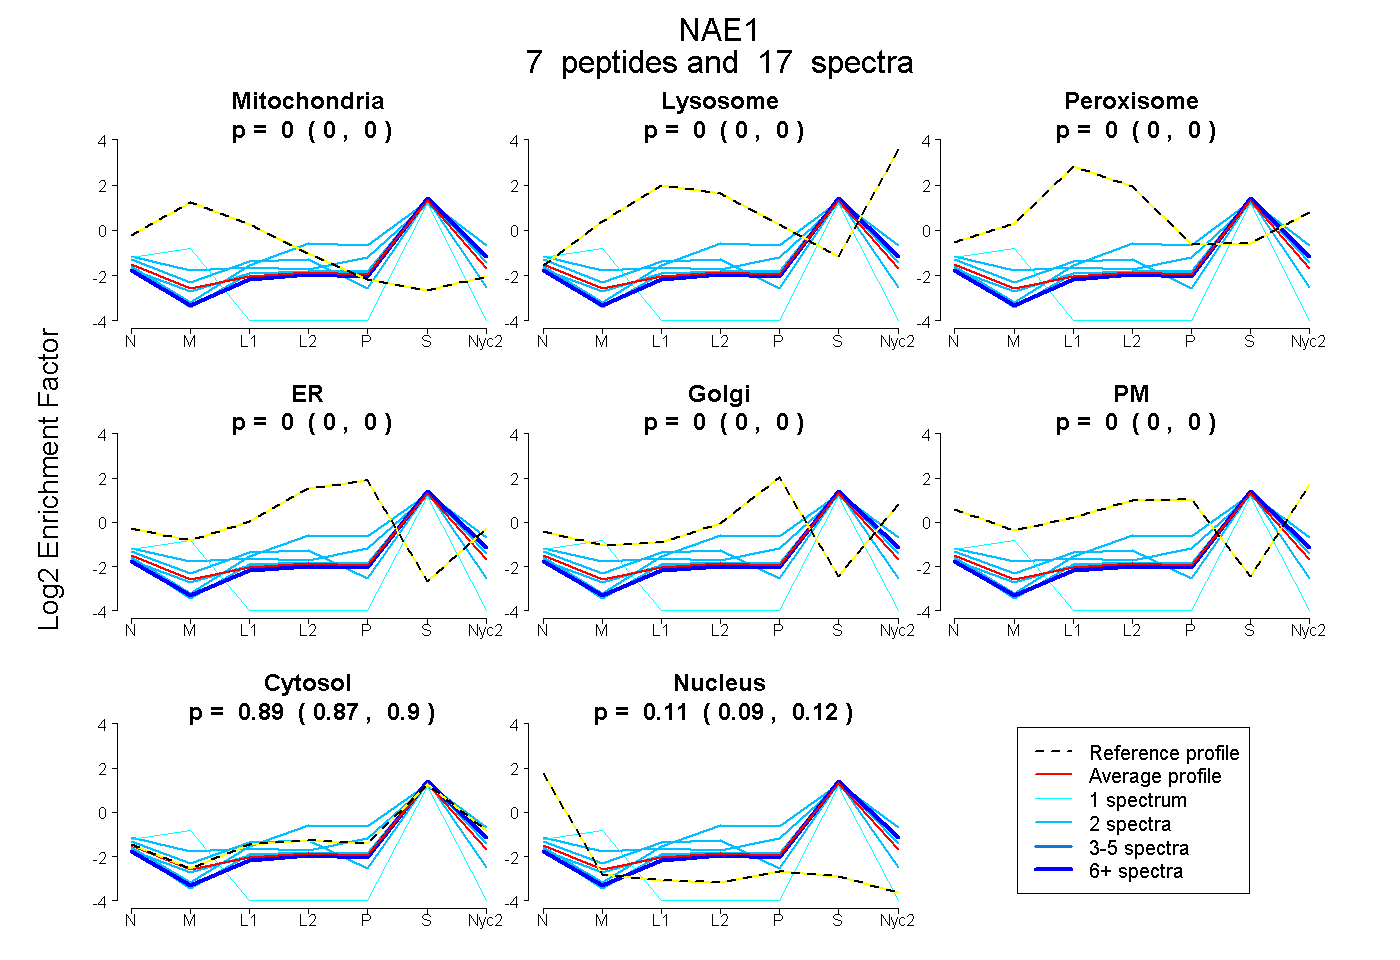 |
0.000
0.000 | 0.000 |
0.000
0.000 | 0.000 |
|
0.000
0.000 | 0.000 |
0.000
0.000 | 0.000 |
0.000
0.000 | 0.000 |
0.000
0.000 | 0.000 |
0.890
0.874 | 0.905 |
0.110
0.092 | 0.124 |
|
| | | Plot |
Mito |
|
Lyso or Perox |
|
ER |
Golgi |
PM |
Cytosol |
Nucleus |
|
| Expt B |
2
peptides |
3
spectra |
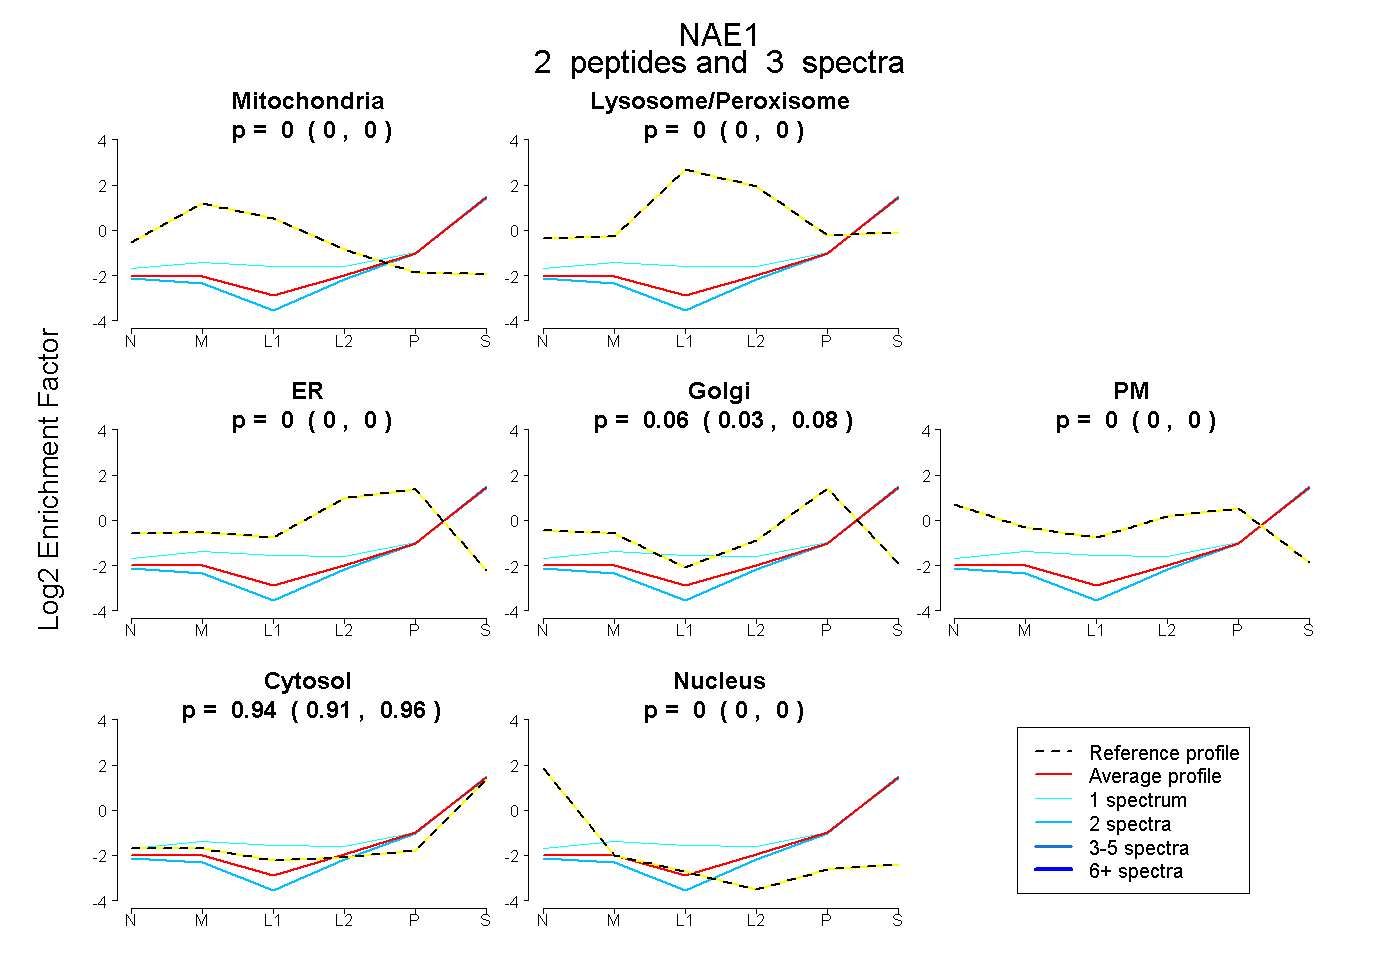 |
0.000
0.000 | 0.000 |
|
0.000
0.000 | 0.000 |
|
0.000
0.000 | 0.000 |
0.060
0.025 | 0.083 |
0.000
0.000 | 0.000 |
0.940
0.911 | 0.962 |
0.000
0.000 | 0.000 |
|
| 1 spectrum, EGQGNLPVR |
0.000 |
|
0.118 |
|
0.000 |
0.057 |
0.000 |
0.825 |
0.000 |
|
| 2 spectra, LLCSNSAFLR |
0.000 |
|
0.000 |
|
0.000 |
0.018 |
0.000 |
0.982 |
0.000 |
|
| | | Plot |
|
Lyso |
|
|
|
|
|
|
|
Other |
| Expt C |
5
peptides |
11
spectra |
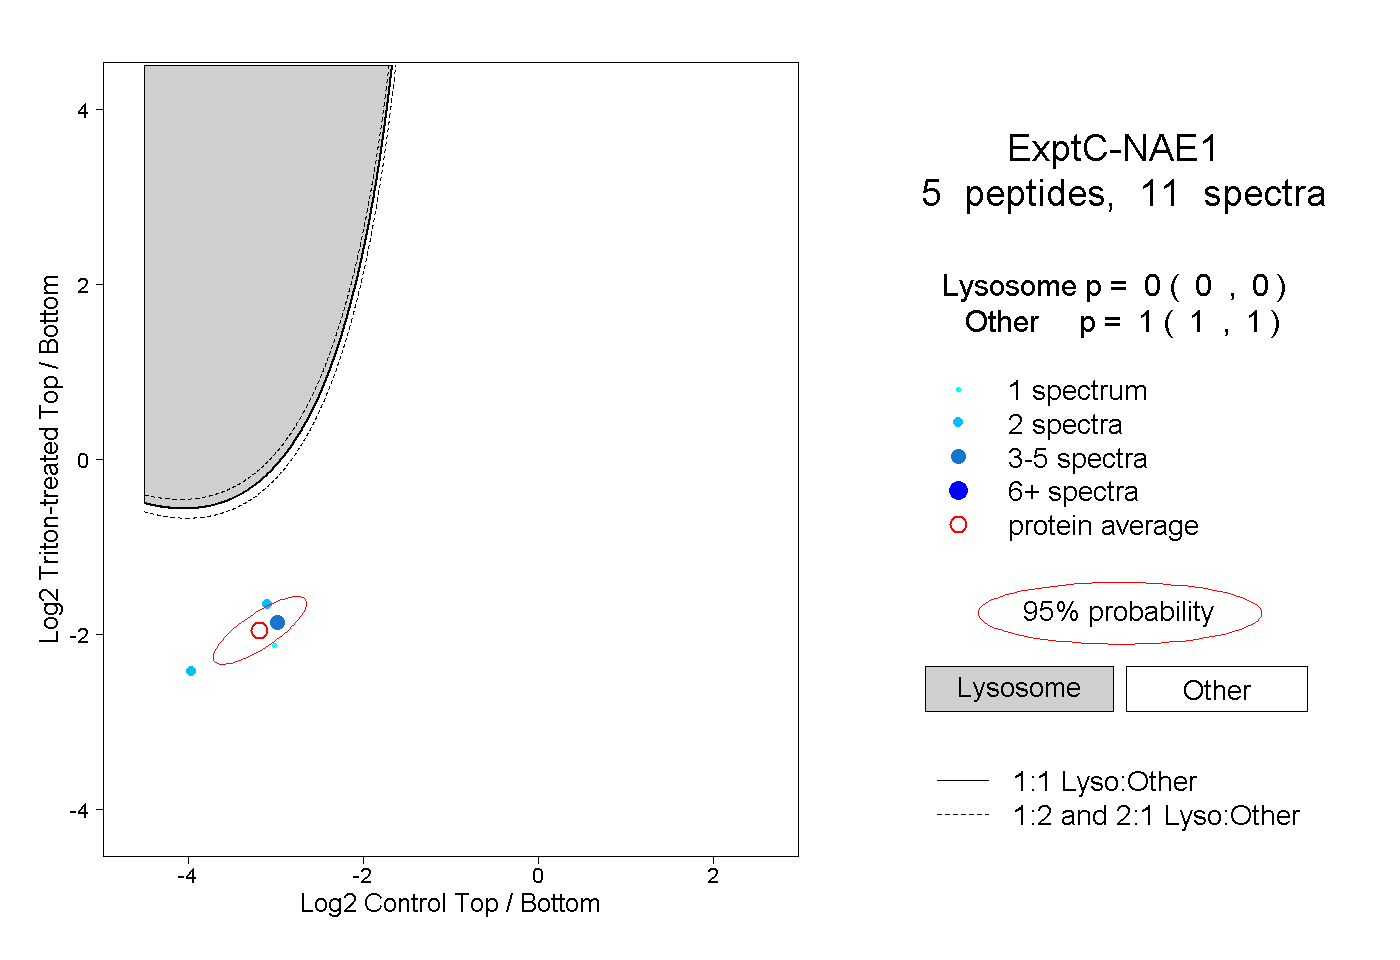 |
|
0.000
0.000 | 0.000 |
|
|
|
|
|
|
|
1.000
1.000 | 1.000 |