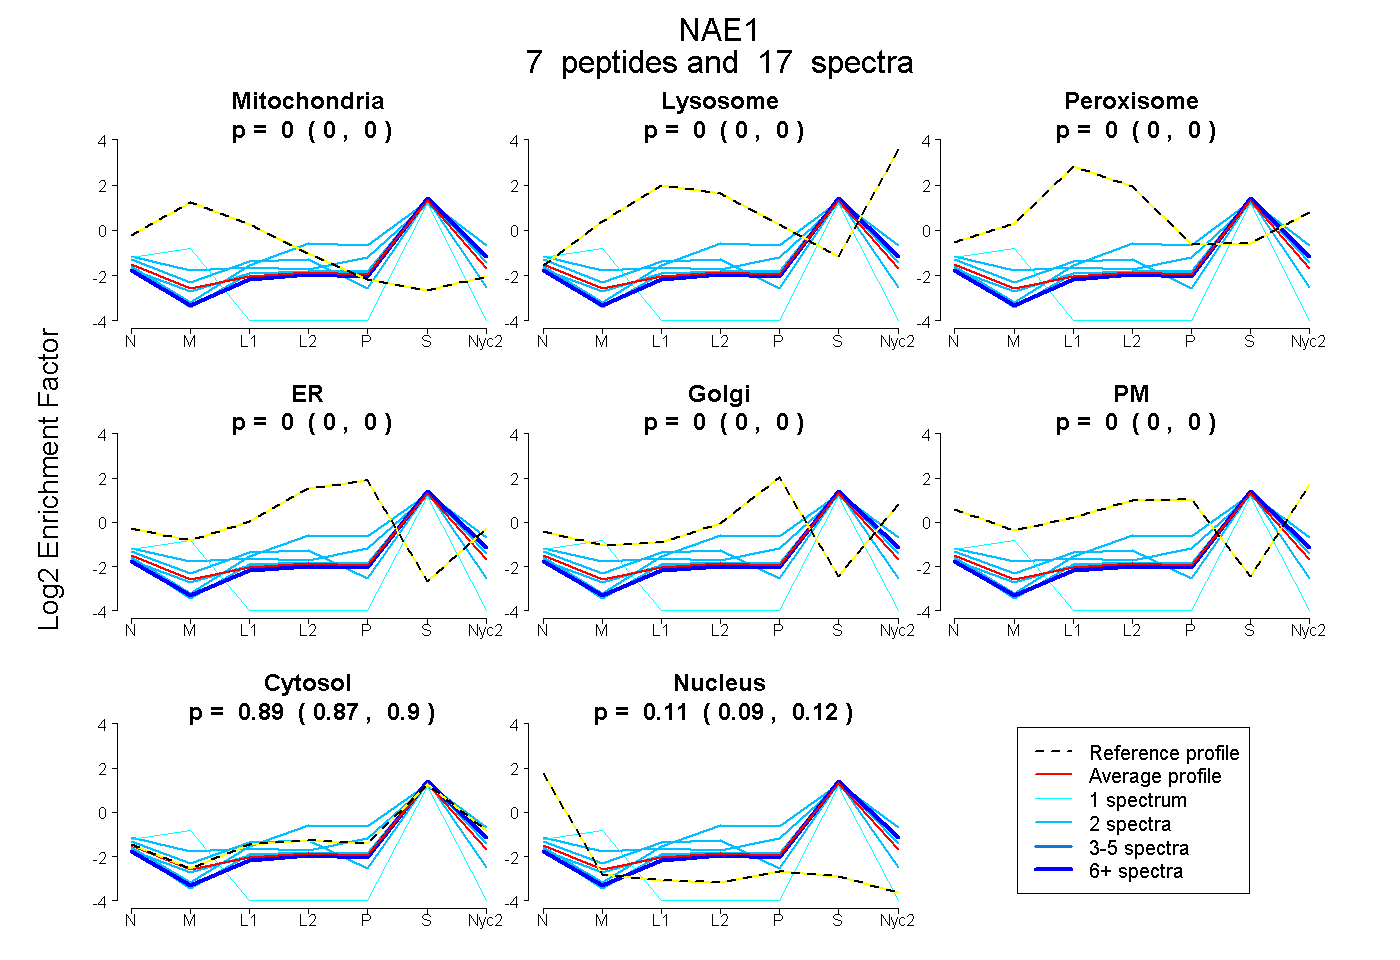
 7
7peptides
spectra
0.000 | 0.000
0.000 | 0.000
0.000 | 0.000
0.000 | 0.000
0.000 | 0.000
0.000 | 0.000
0.874 | 0.905
0.092 | 0.124
| Plot | Mito | Lyso | Perox | ER | Golgi | PM | Cytosol | Nucleus | |||||
| Expt A |
7 peptides |
17 spectra |
|
0.000 0.000 | 0.000 |
0.000 0.000 | 0.000 |
0.000 0.000 | 0.000 |
0.000 0.000 | 0.000 |
0.000 0.000 | 0.000 |
0.000 0.000 | 0.000 |
0.890 0.874 | 0.905 |
0.110 0.092 | 0.124 |
| 1 spectrum, EHPVIESHPDNALEDLR | 0.000 | 0.000 | 0.000 | 0.000 | 0.000 | 0.000 | 0.489 | 0.511 | ||
| 2 spectra, GTIPDMIADSSK | 0.044 | 0.000 | 0.000 | 0.000 | 0.000 | 0.000 | 0.953 | 0.003 | ||
| 2 spectra, CINITK | 0.075 | 0.000 | 0.000 | 0.000 | 0.000 | 0.000 | 0.899 | 0.026 | ||
| 6 spectra, QTPSFWILAR | 0.000 | 0.000 | 0.000 | 0.000 | 0.000 | 0.000 | 0.937 | 0.063 | ||
| 2 spectra, LDKPFPELR | 0.000 | 0.000 | 0.000 | 0.065 | 0.000 | 0.000 | 0.935 | 0.000 | ||
| 2 spectra, LLCSNSAFLR | 0.000 | 0.000 | 0.000 | 0.000 | 0.000 | 0.000 | 0.869 | 0.131 | ||
| 2 spectra, DAAAVGNHVAK | 0.000 | 0.000 | 0.000 | 0.000 | 0.000 | 0.000 | 0.934 | 0.066 |
| Plot | Mito | Lyso or Perox | ER | Golgi | PM | Cytosol | Nucleus | ||||||
| Expt B |
2 peptides |
3 spectra |
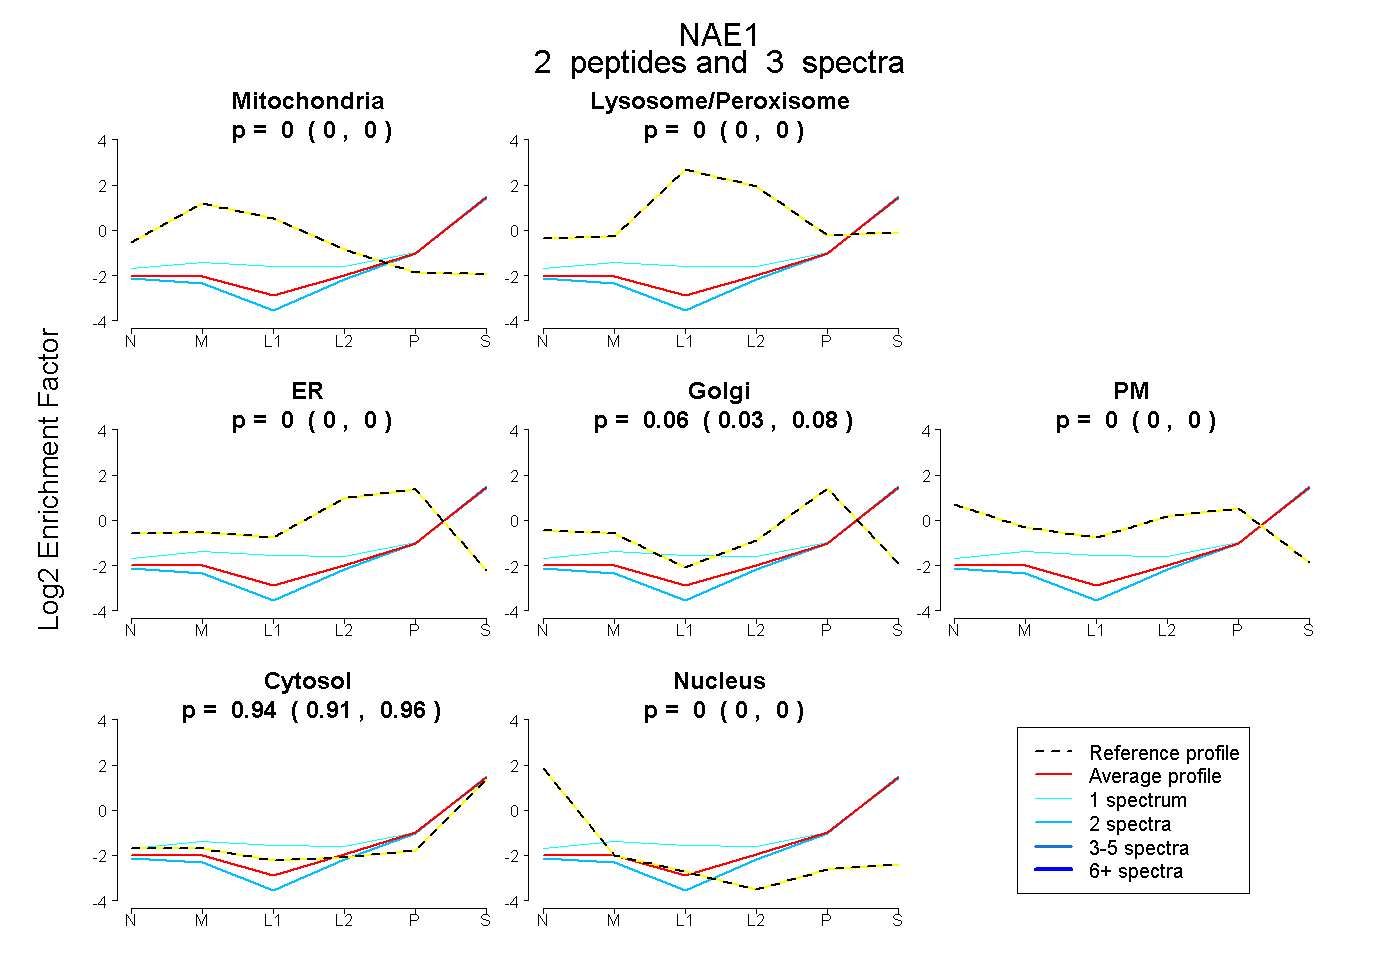 |
0.000 0.000 | 0.000 |
0.000 0.000 | 0.000 |
0.000 0.000 | 0.000 |
0.060 0.025 | 0.083 |
0.000 0.000 | 0.000 |
0.940 0.911 | 0.962 |
0.000 0.000 | 0.000 |
|||
| Plot | Lyso | Other | |||||||||||
| Expt C |
5 peptides |
11 spectra |
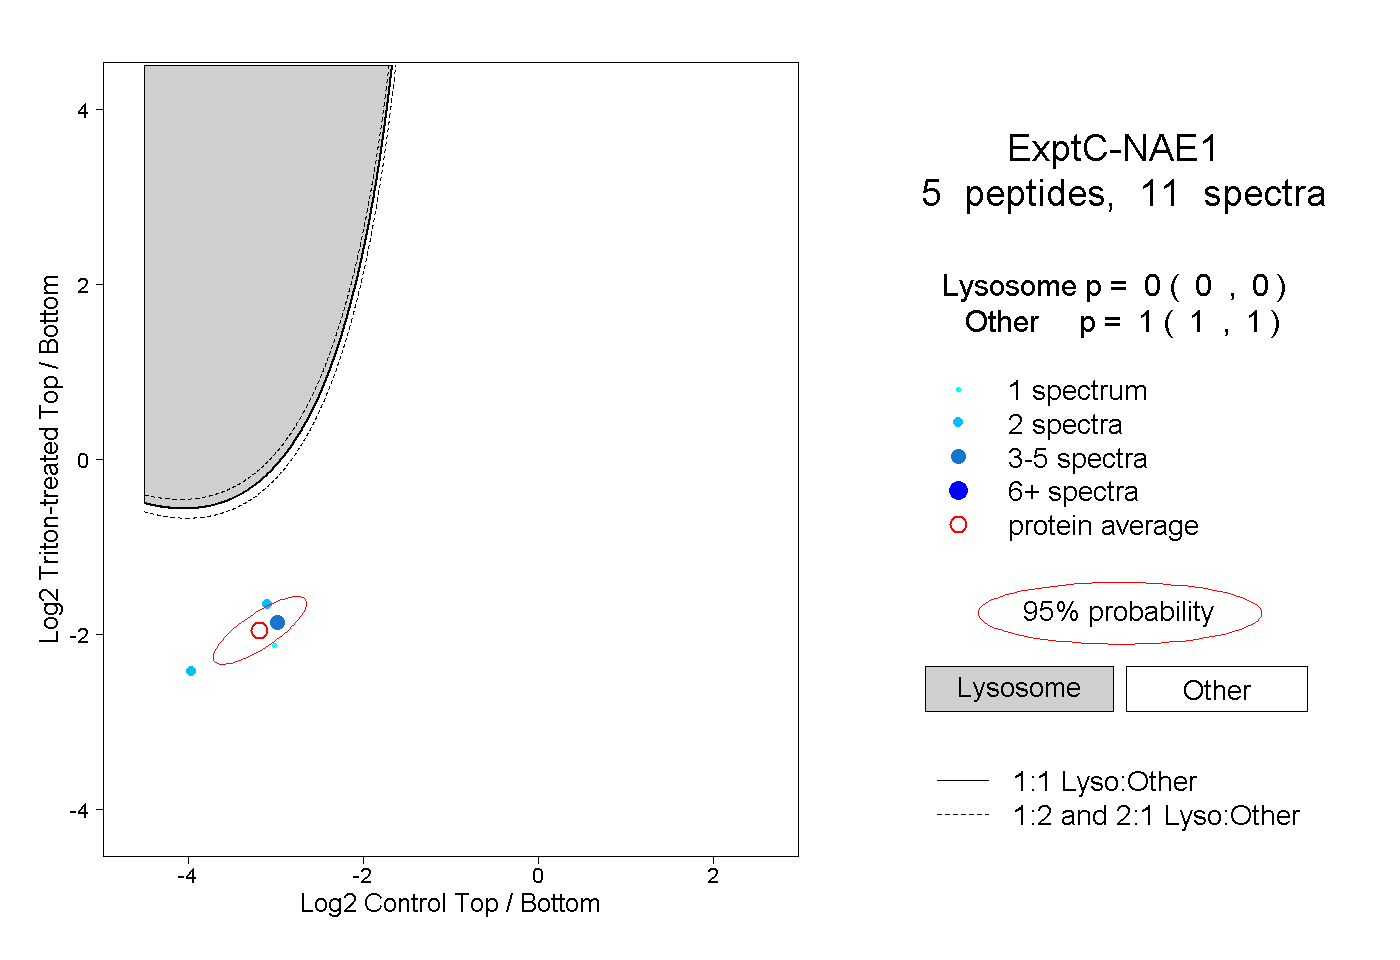 |
0.000 0.000 | 0.000 |
1.000 1.000 | 1.000 |