 12
12peptides
spectra
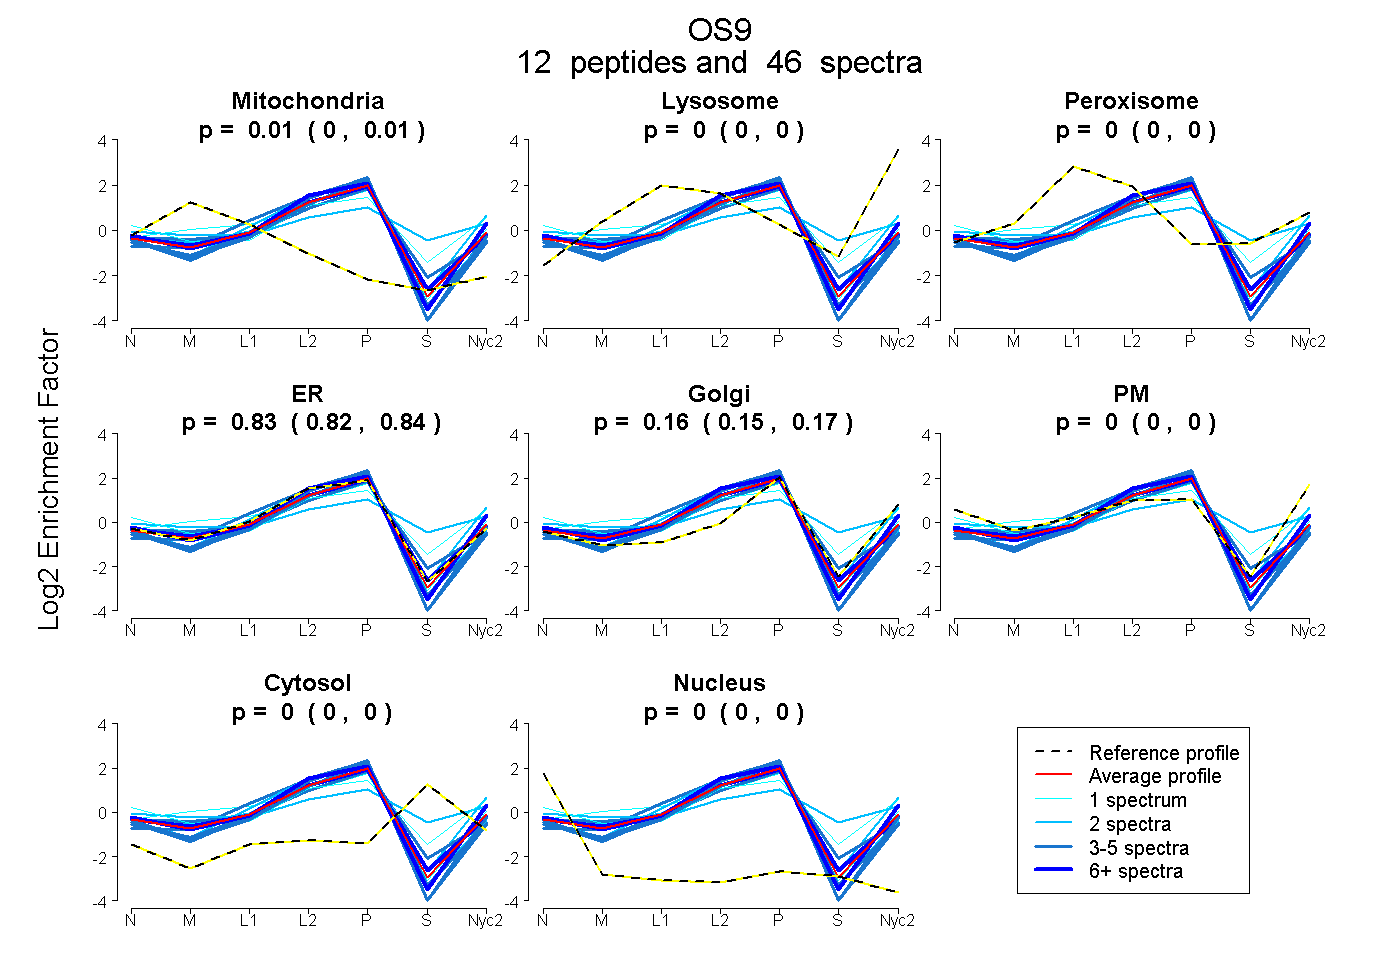
0.001 | 0.011
0.000 | 0.000
0.000 | 0.000
0.819 | 0.842
0.149 | 0.173
0.000 | 0.000
0.000 | 0.000
0.000 | 0.000
3peptides
spectra
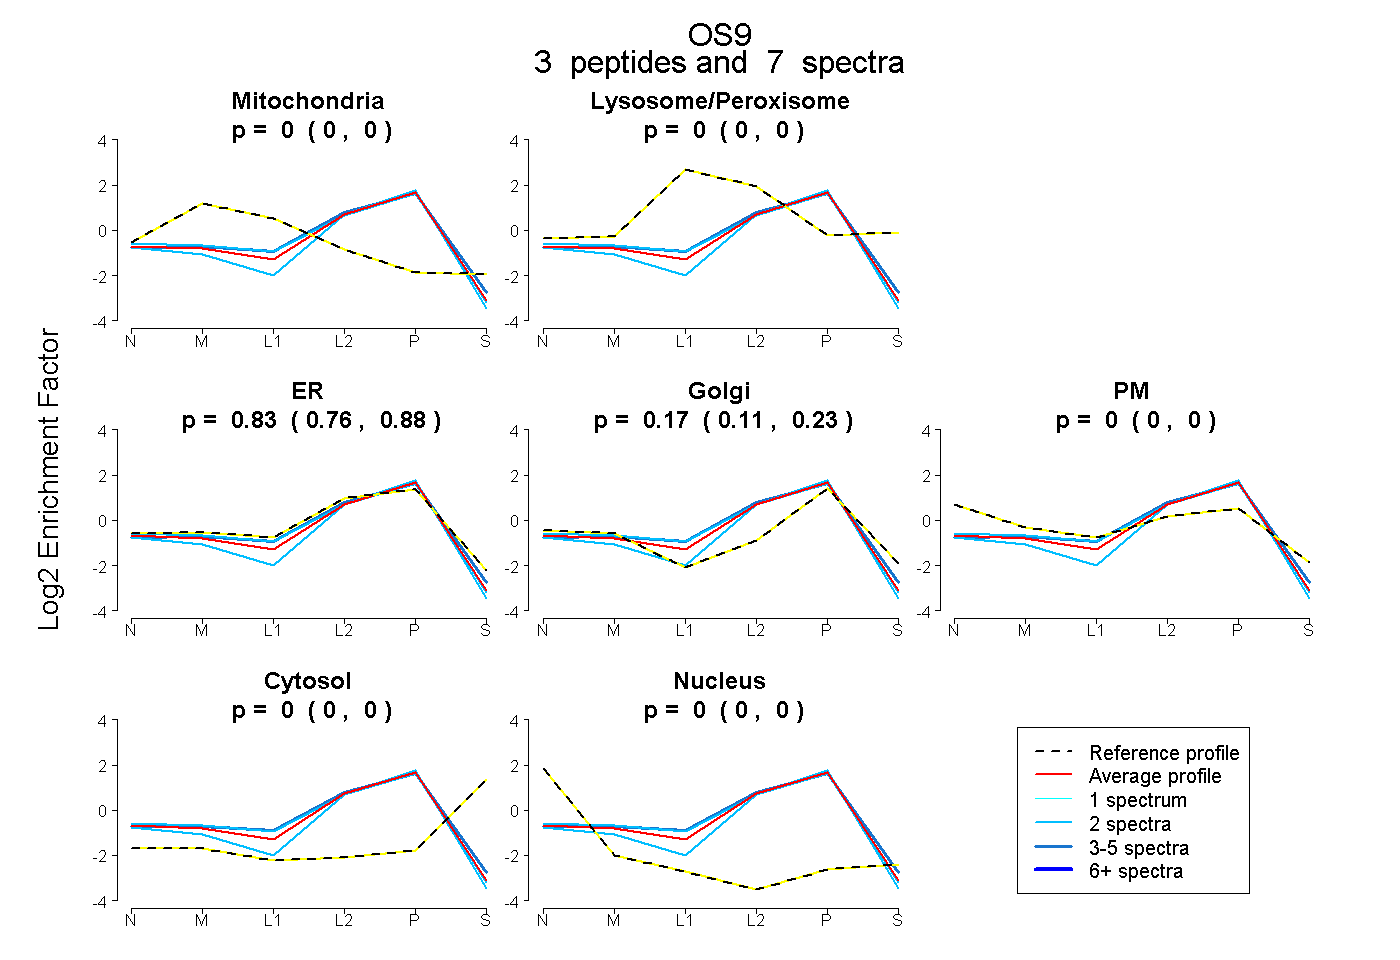
0.000 | 0.000
0.000 | 0.000
0.762 | 0.880
0.108 | 0.226
0.000 | 0.000
0.000 | 0.000
0.000 | 0.000
10peptides
spectra
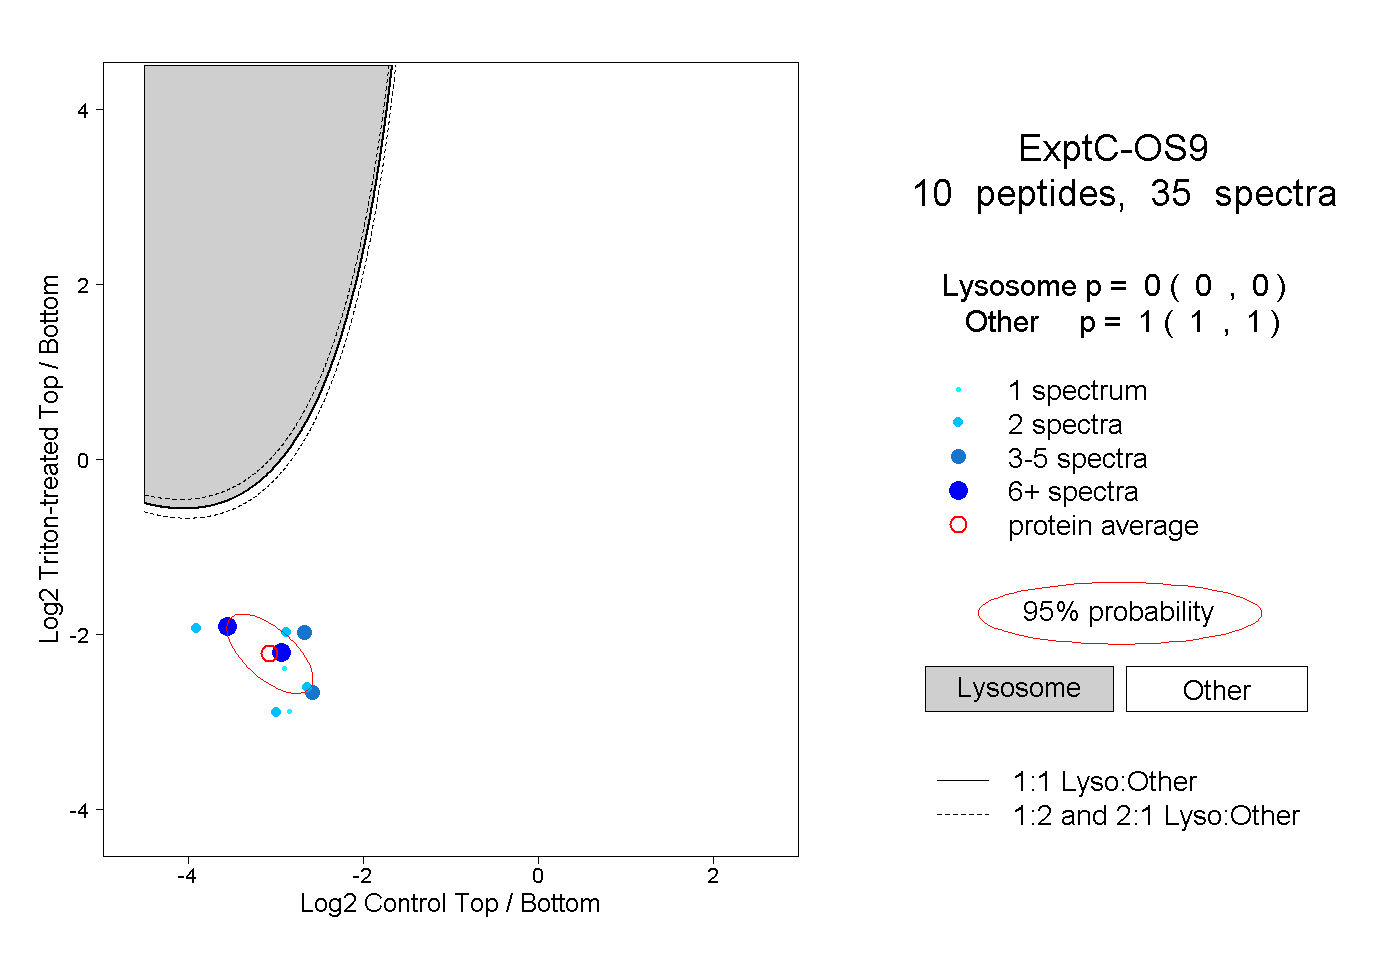
0.000 | 0.000
1.000 | 1.000
6peptides
spectra
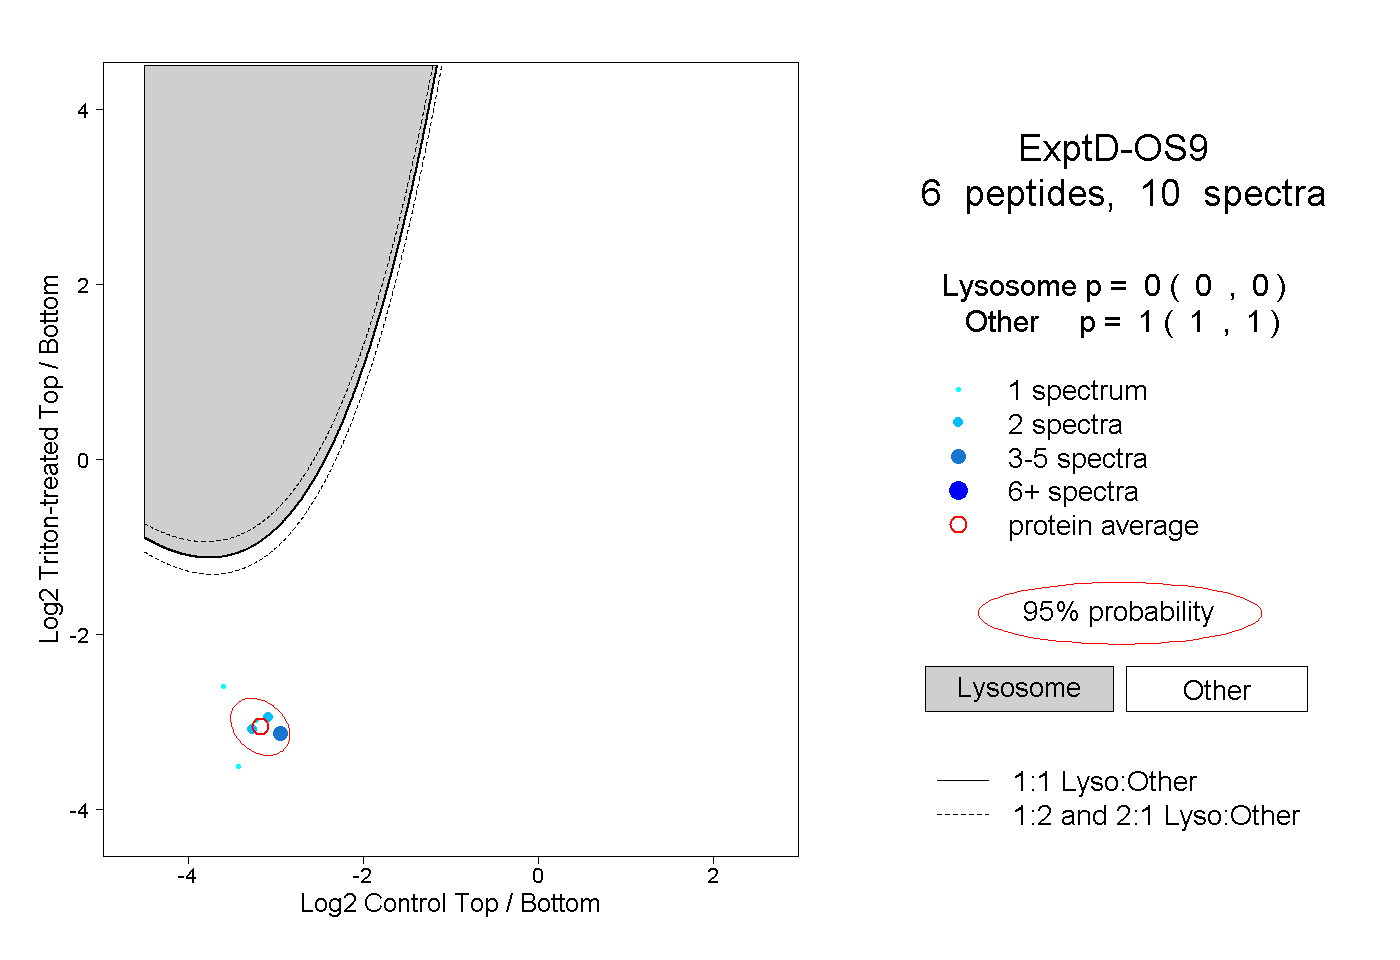
0.000 | 0.000
1.000 | 1.000