OS9
[ENSRNOP00000044914]
Main page
| | | Plot |
Mito |
Lyso |
|
Perox |
ER |
Golgi |
PM |
Cytosol |
Nucleus |
|
| Expt A |
 12
12
peptides |
46
spectra |
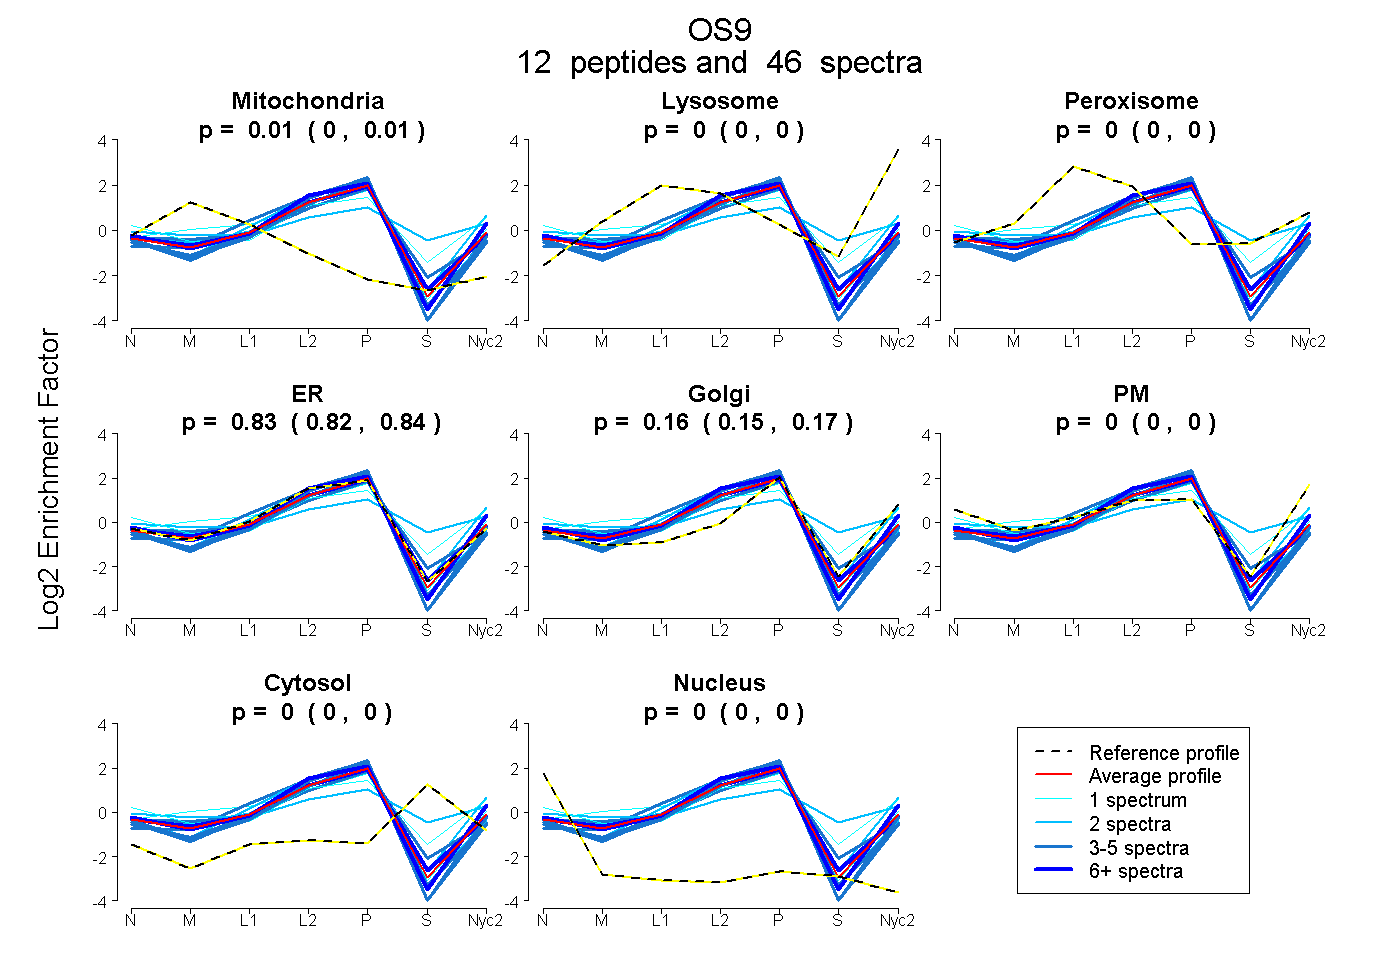 |
0.007
0.001 | 0.011 |
0.000
0.000 | 0.000 |
|
0.000
0.000 | 0.000 |
0.831
0.819 | 0.842 |
0.162
0.149 | 0.173 |
0.000
0.000 | 0.000 |
0.000
0.000 | 0.000 |
0.000
0.000 | 0.000 |
|
| | | Plot |
Mito |
|
Lyso or Perox |
|
ER |
Golgi |
PM |
Cytosol |
Nucleus |
|
| Expt B |
3
peptides |
7
spectra |
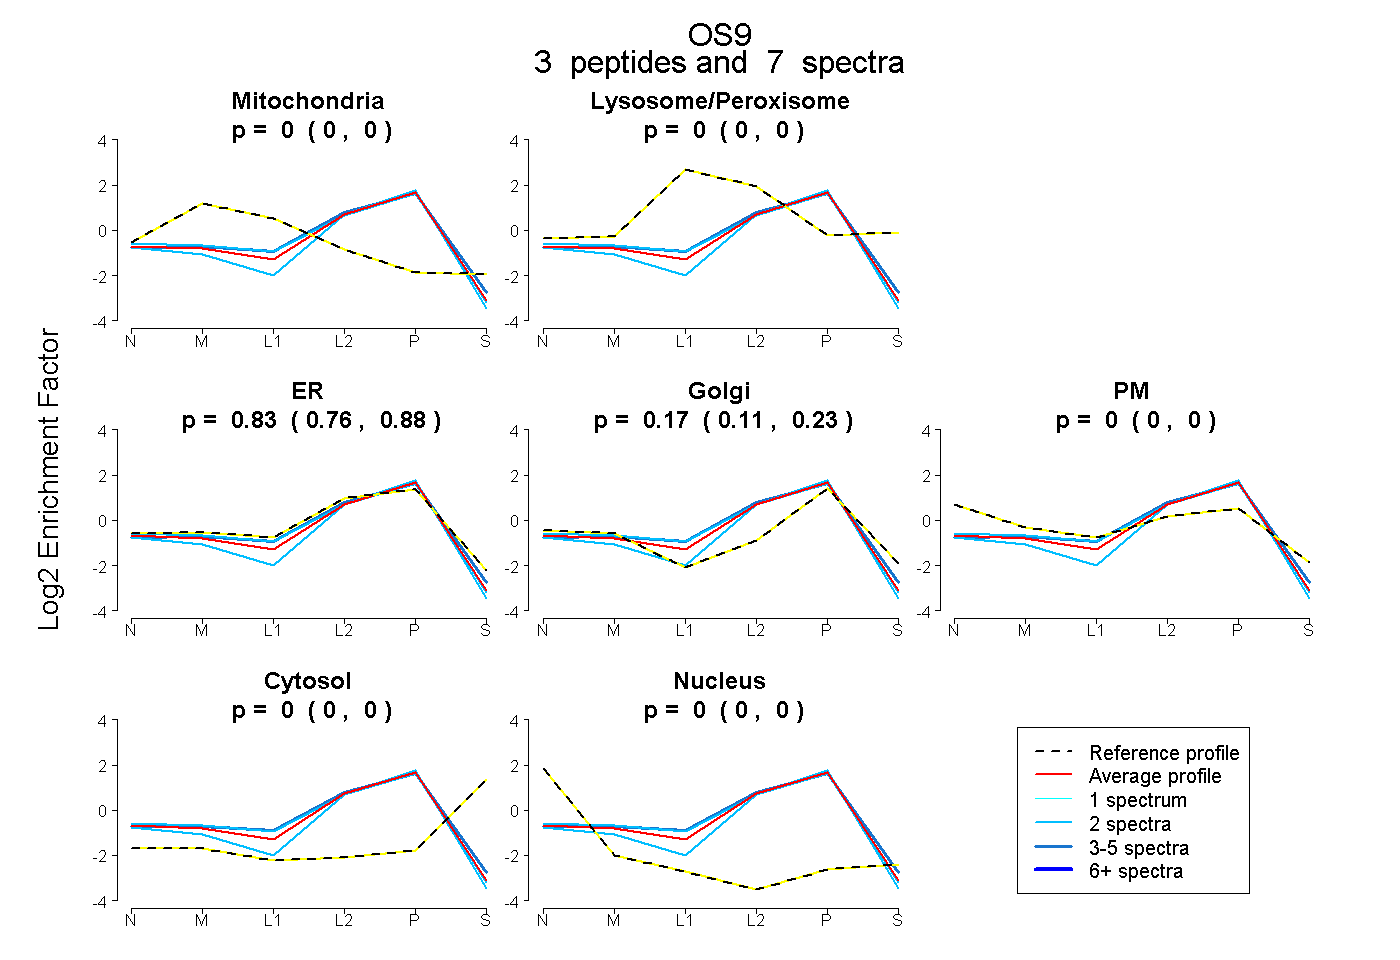 |
0.000
0.000 | 0.000 |
|
0.000
0.000 | 0.000 |
|
0.827
0.762 | 0.880 |
0.173
0.108 | 0.226 |
0.000
0.000 | 0.000 |
0.000
0.000 | 0.000 |
0.000
0.000 | 0.000 |
|
| 2 spectra, SPADLIR |
0.000 |
|
0.000 |
|
0.897 |
0.103 |
0.000 |
0.000 |
0.000 |
|
| 3 spectra, LPAGAIHFQR |
0.000 |
|
0.000 |
|
0.923 |
0.077 |
0.000 |
0.000 |
0.000 |
|
| 2 spectra, QSELESNYR |
0.000 |
|
0.000 |
|
0.656 |
0.344 |
0.000 |
0.000 |
0.000 |
|
| | | Plot |
|
Lyso |
|
|
|
|
|
|
|
Other |
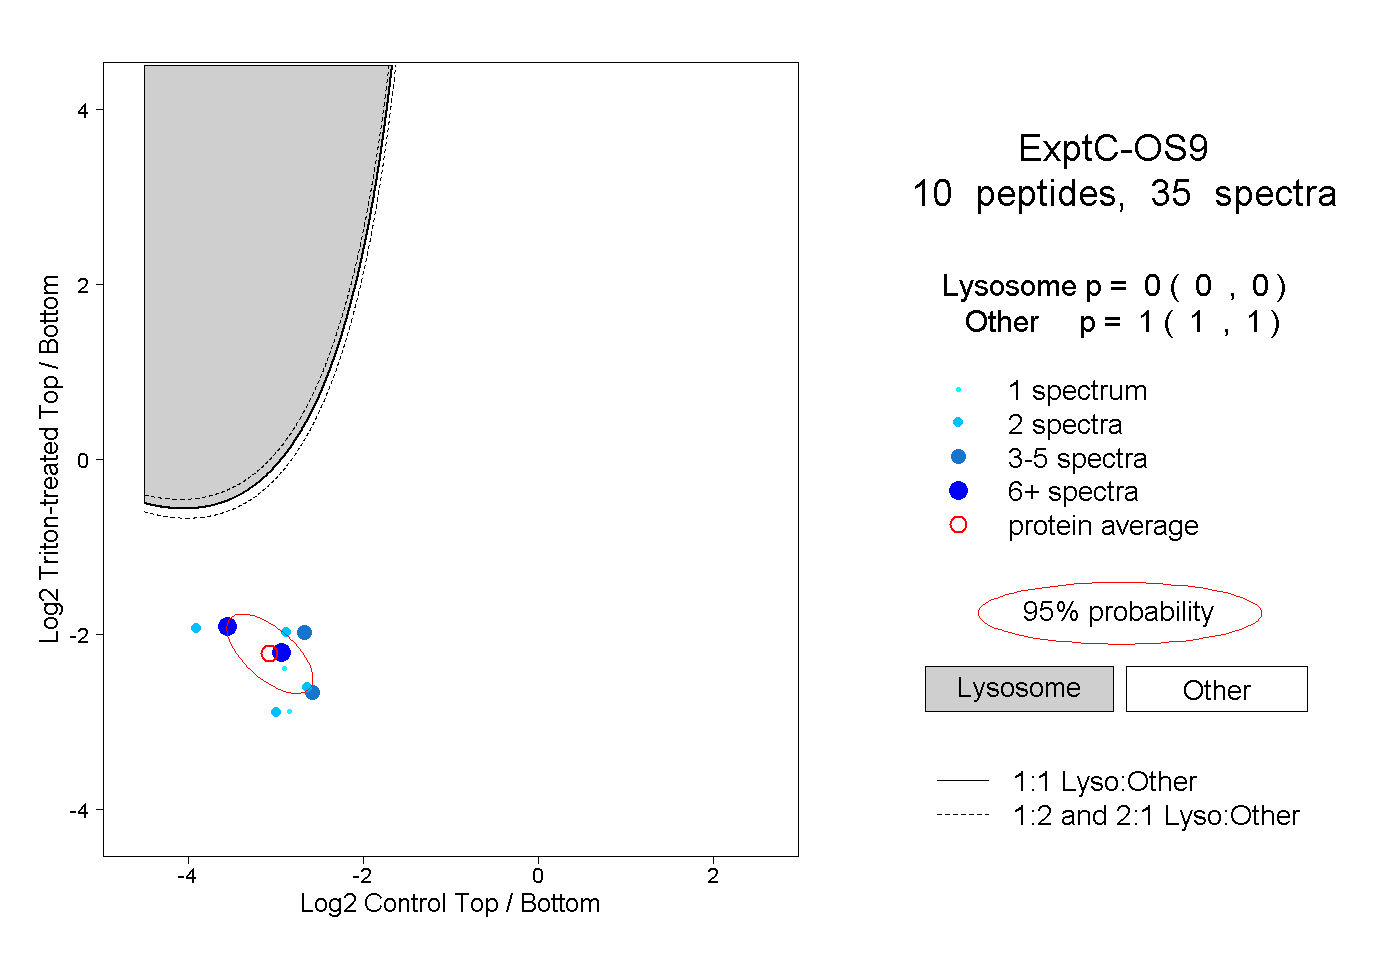
| Expt C |
10
peptides |
35
spectra |
 |
|
0.000
0.000 | 0.000 |
|
|
|
|
|
|
|
1.000
1.000 | 1.000 |
| | | Plot |
|
Lyso |
|
|
|
|
|
|
|
Other |
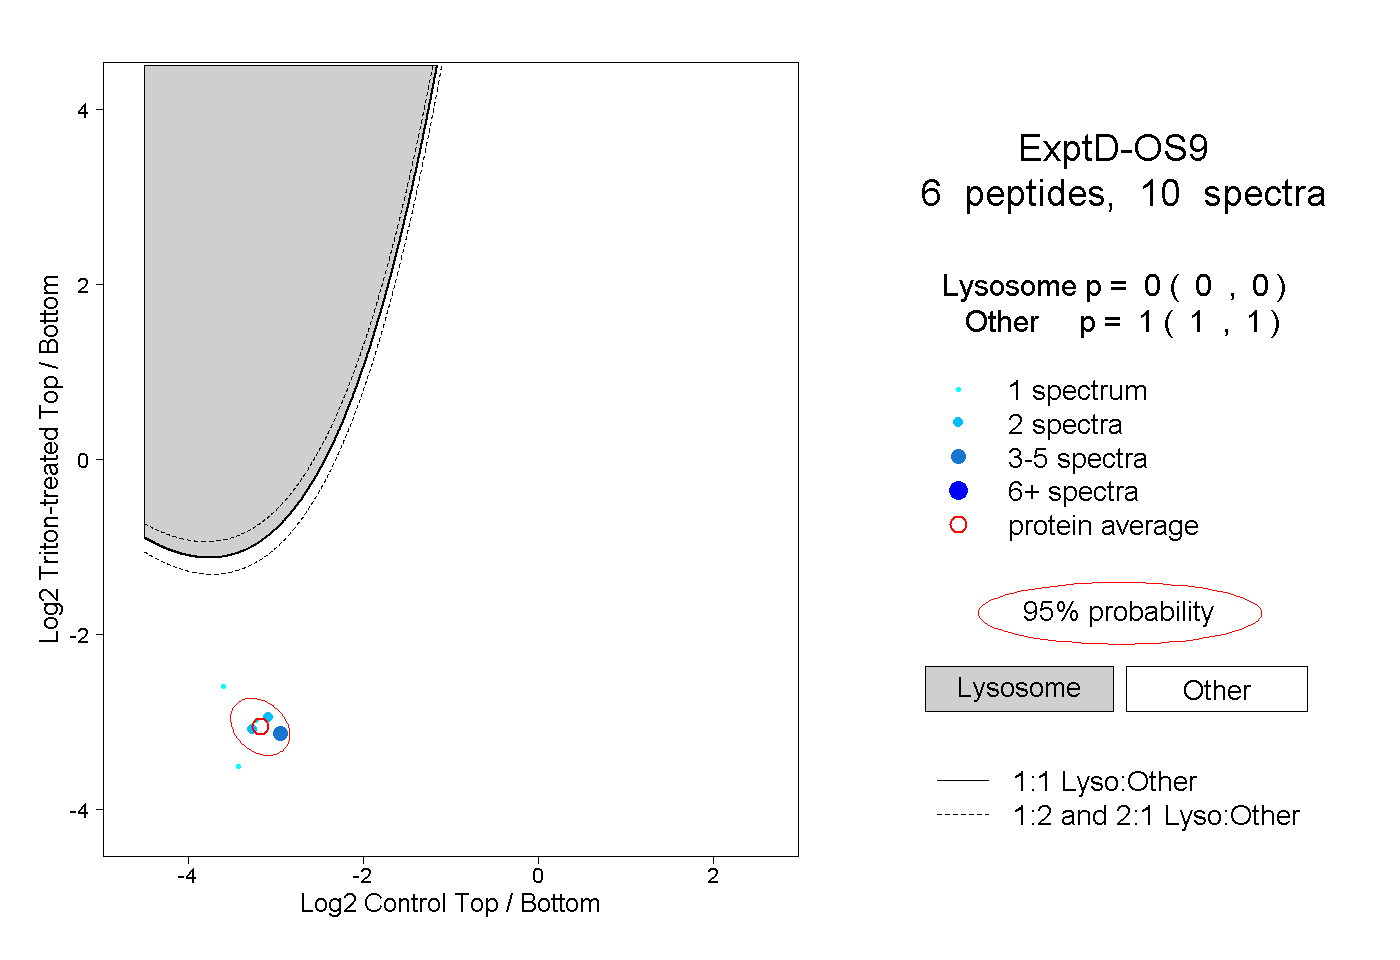
| Expt D |
6
peptides |
10
spectra |
 |
|
0.000
0.000 | 0.000 |
|
|
|
|
|
|
|
1.000
1.000 | 1.000 |