 12
12peptides
spectra
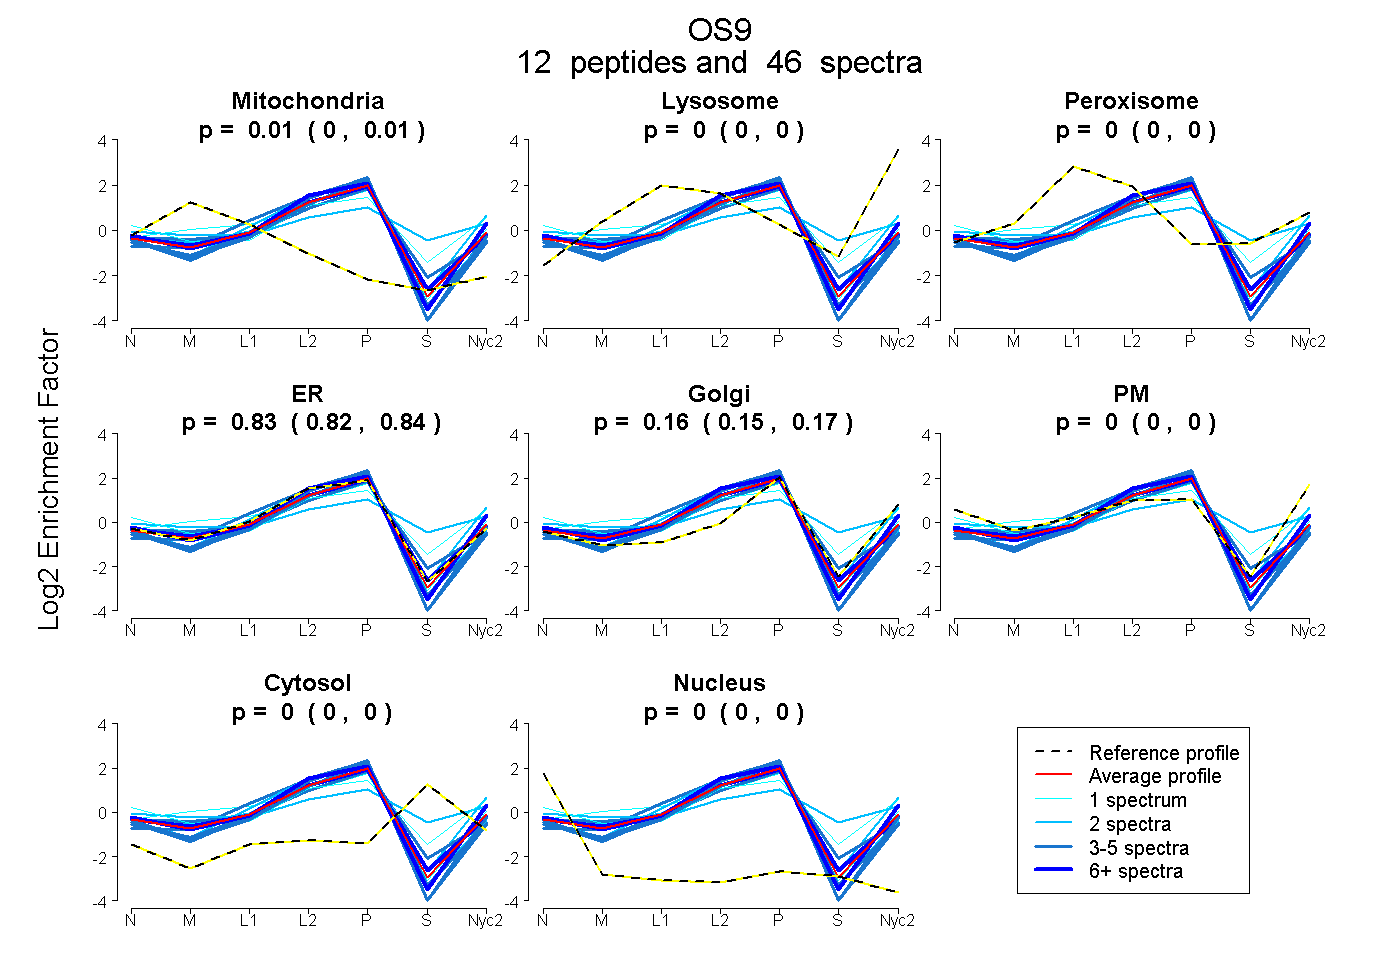
0.001 | 0.011
0.000 | 0.000
0.000 | 0.000
0.819 | 0.842
0.149 | 0.173
0.000 | 0.000
0.000 | 0.000
0.000 | 0.000
| Plot | Mito | Lyso | Perox | ER | Golgi | PM | Cytosol | Nucleus | |||||
| Expt A |
12 peptides |
46 spectra |
|
0.007 0.001 | 0.011 |
0.000 0.000 | 0.000 |
0.000 0.000 | 0.000 |
0.831 0.819 | 0.842 |
0.162 0.149 | 0.173 |
0.000 0.000 | 0.000 |
0.000 0.000 | 0.000 |
0.000 0.000 | 0.000 |
| 2 spectra, HGGPNQDLTVLEMNR | 0.000 | 0.000 | 0.225 | 0.123 | 0.284 | 0.147 | 0.220 | 0.000 | ||
| 4 spectra, SPADLIR | 0.000 | 0.000 | 0.000 | 0.928 | 0.072 | 0.000 | 0.000 | 0.000 | ||
| 9 spectra, WLTDEDTR | 0.000 | 0.000 | 0.000 | 0.803 | 0.082 | 0.115 | 0.000 | 0.000 | ||
| 3 spectra, LQESQSPELVQK | 0.000 | 0.000 | 0.000 | 0.986 | 0.000 | 0.000 | 0.000 | 0.014 | ||
| 2 spectra, FLCDEGAGISGDYIDR | 0.000 | 0.000 | 0.000 | 1.000 | 0.000 | 0.000 | 0.000 | 0.000 | ||
| 4 spectra, ESEFWK | 0.058 | 0.000 | 0.000 | 0.767 | 0.131 | 0.000 | 0.044 | 0.000 | ||
| 2 spectra, ELDPEGLR | 0.000 | 0.071 | 0.000 | 0.583 | 0.201 | 0.145 | 0.000 | 0.000 | ||
| 10 spectra, LPAGAIHFQR | 0.025 | 0.000 | 0.000 | 0.824 | 0.150 | 0.000 | 0.000 | 0.000 | ||
| 1 spectrum, AAGAPPK | 0.094 | 0.027 | 0.000 | 0.683 | 0.070 | 0.125 | 0.000 | 0.000 | ||
| 4 spectra, ELEGMLLPSDR | 0.000 | 0.000 | 0.000 | 1.000 | 0.000 | 0.000 | 0.000 | 0.000 | ||
| 1 spectrum, HIQQYHMEDSEIK | 0.000 | 0.000 | 0.000 | 0.374 | 0.027 | 0.463 | 0.135 | 0.000 | ||
| 4 spectra, QSELESNYR | 0.000 | 0.000 | 0.000 | 0.851 | 0.117 | 0.000 | 0.000 | 0.031 |
| Plot | Mito | Lyso or Perox | ER | Golgi | PM | Cytosol | Nucleus | ||||||
| Expt B |
3 peptides |
7 spectra |
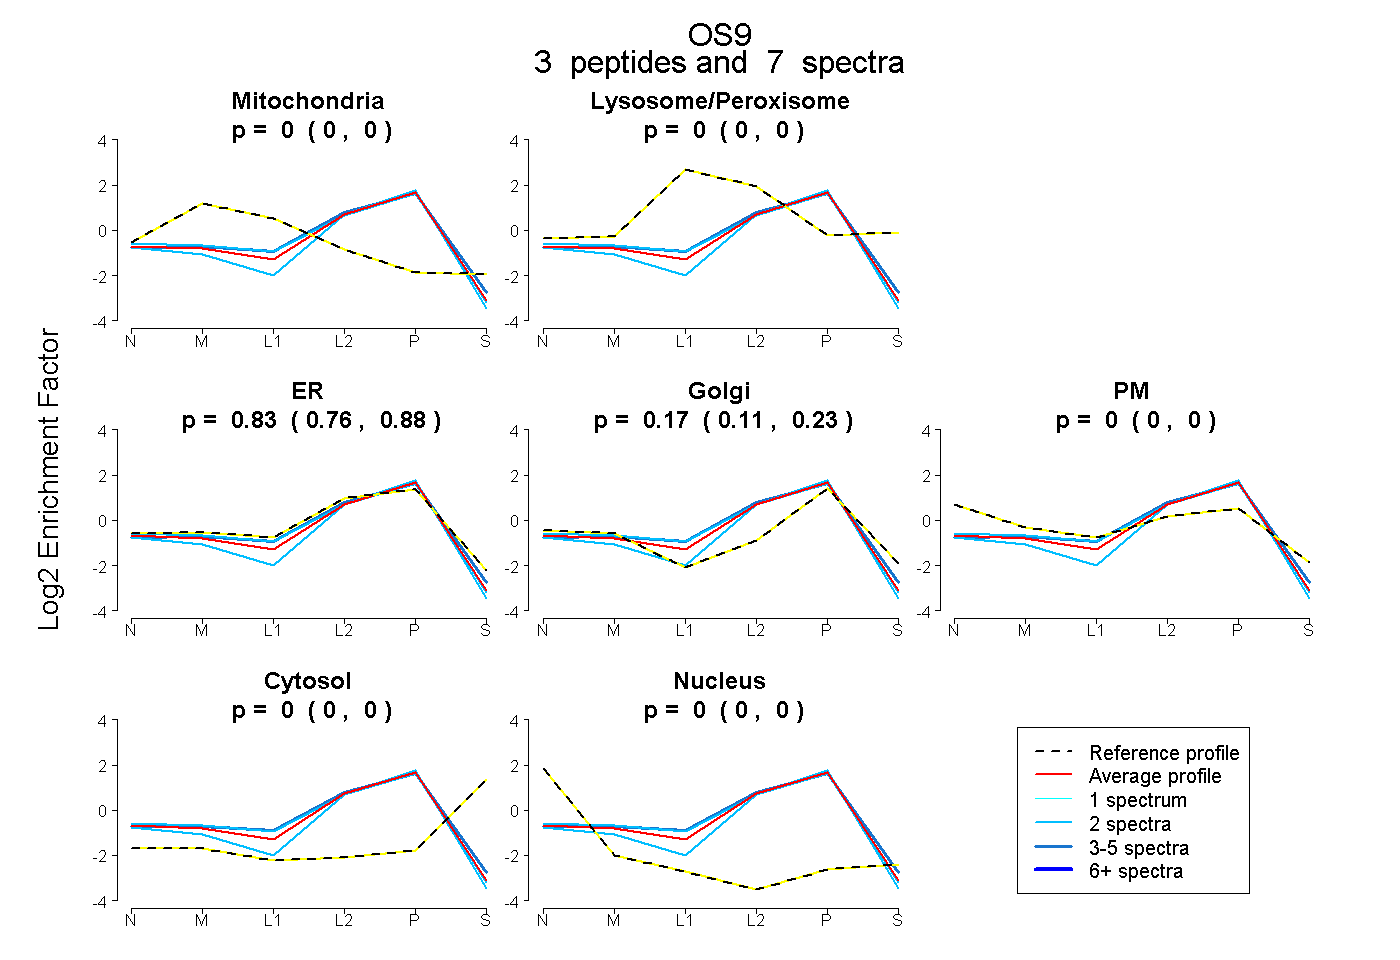 |
0.000 0.000 | 0.000 |
0.000 0.000 | 0.000 |
0.827 0.762 | 0.880 |
0.173 0.108 | 0.226 |
0.000 0.000 | 0.000 |
0.000 0.000 | 0.000 |
0.000 0.000 | 0.000 |
|||
| Plot | Lyso | Other | |||||||||||
| Expt C |
10 peptides |
35 spectra |
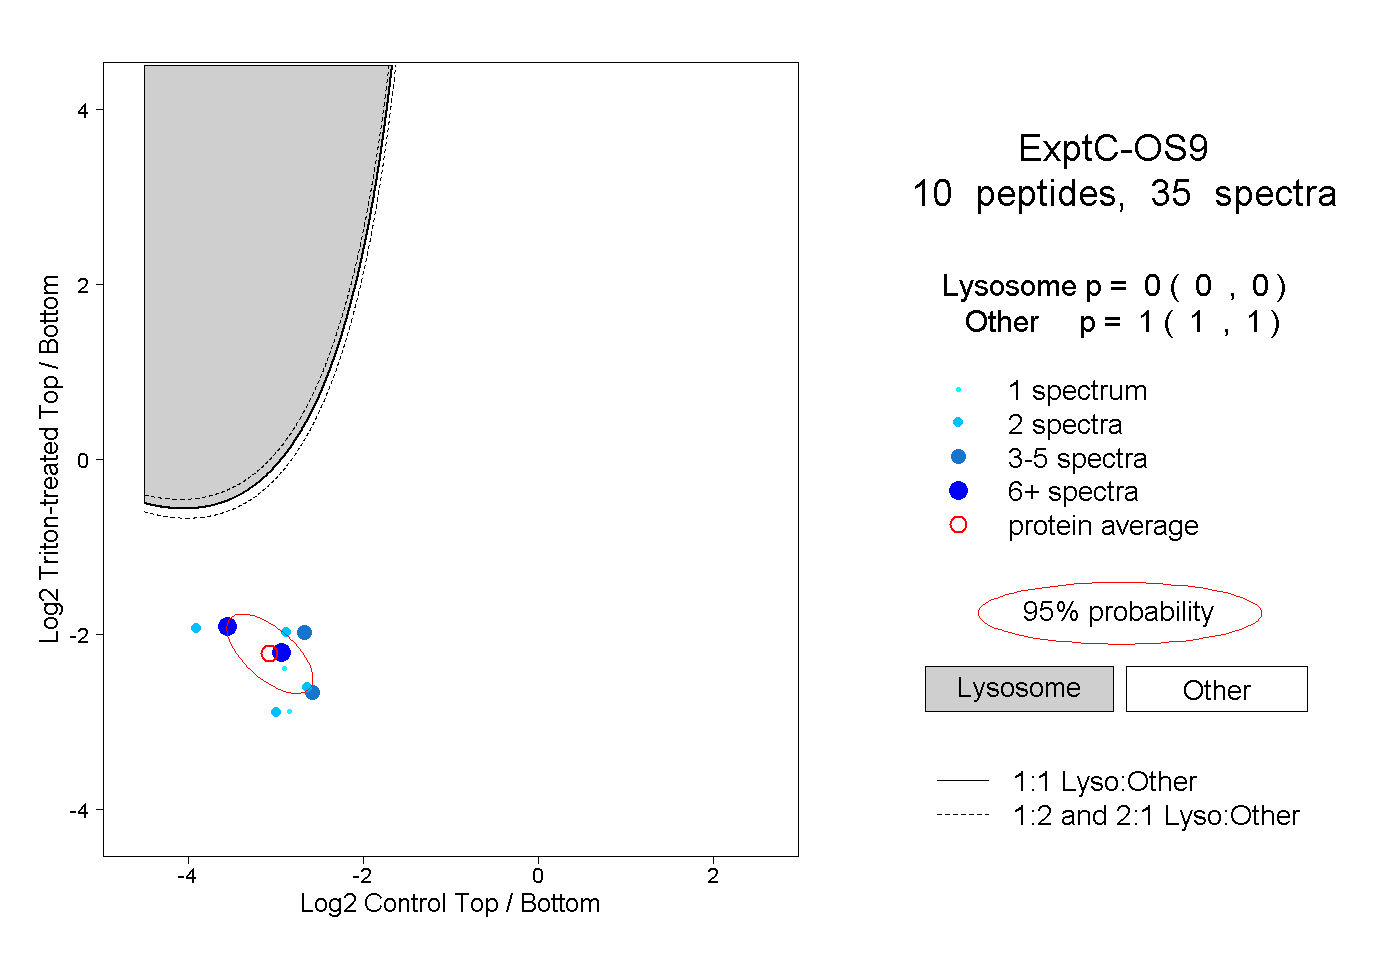 |
0.000 0.000 | 0.000 |
1.000 1.000 | 1.000 |
||||||||
| Plot | Lyso | Other | |||||||||||
| Expt D |
6 peptides |
10 spectra |
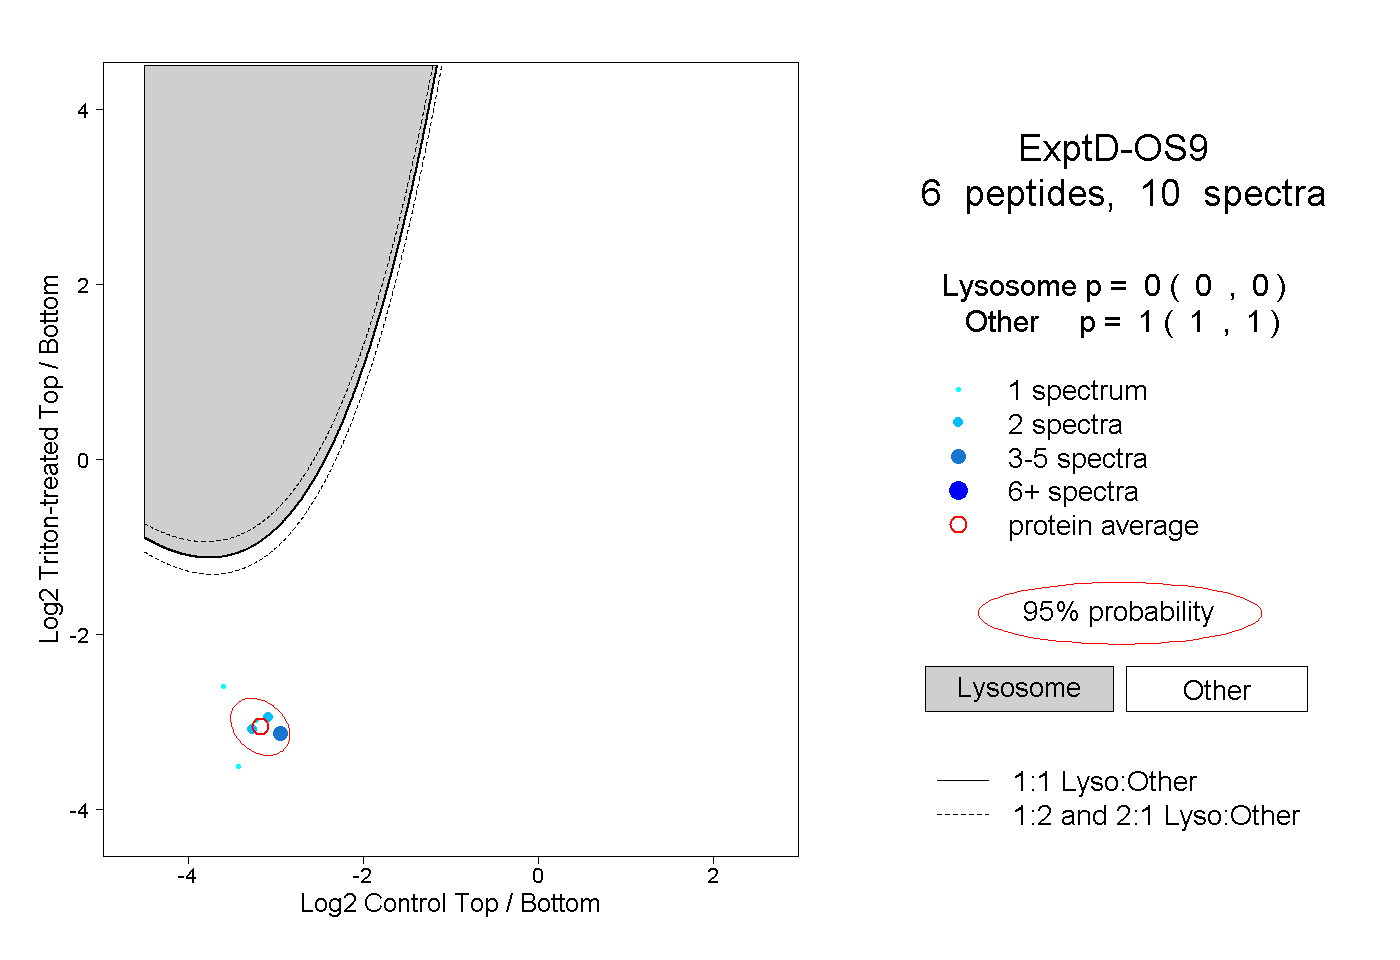 |
0.000 0.000 | 0.000 |
1.000 1.000 | 1.000 |