 8
8peptides
spectra
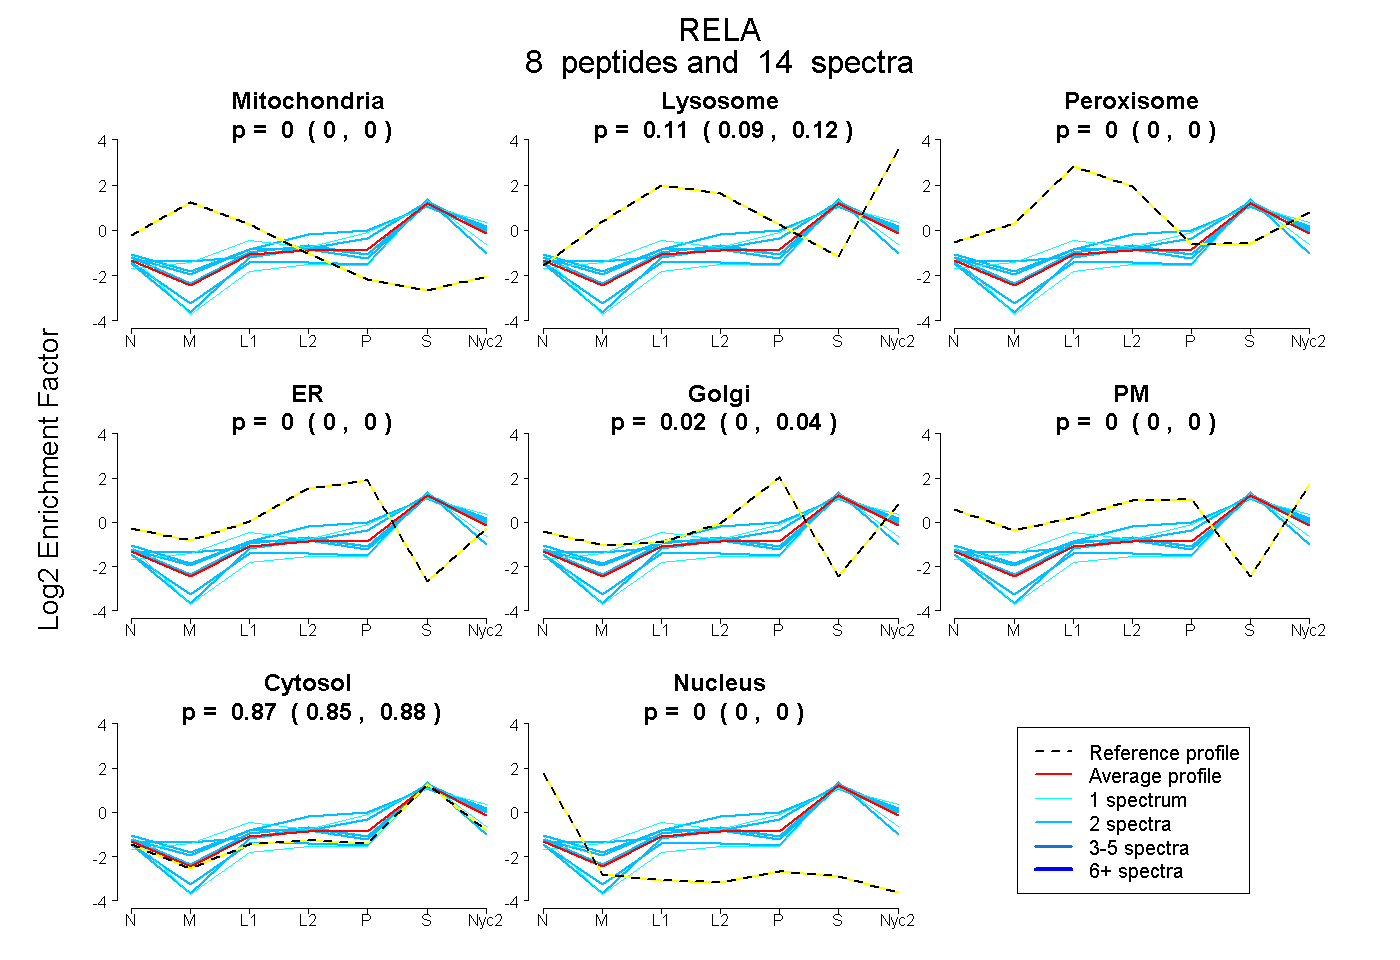
0.000 | 0.000
0.092 | 0.123
0.000 | 0.000
0.000 | 0.000
0.001 | 0.038
0.000 | 0.000
0.854 | 0.884
0.000 | 0.000
3peptides
spectra
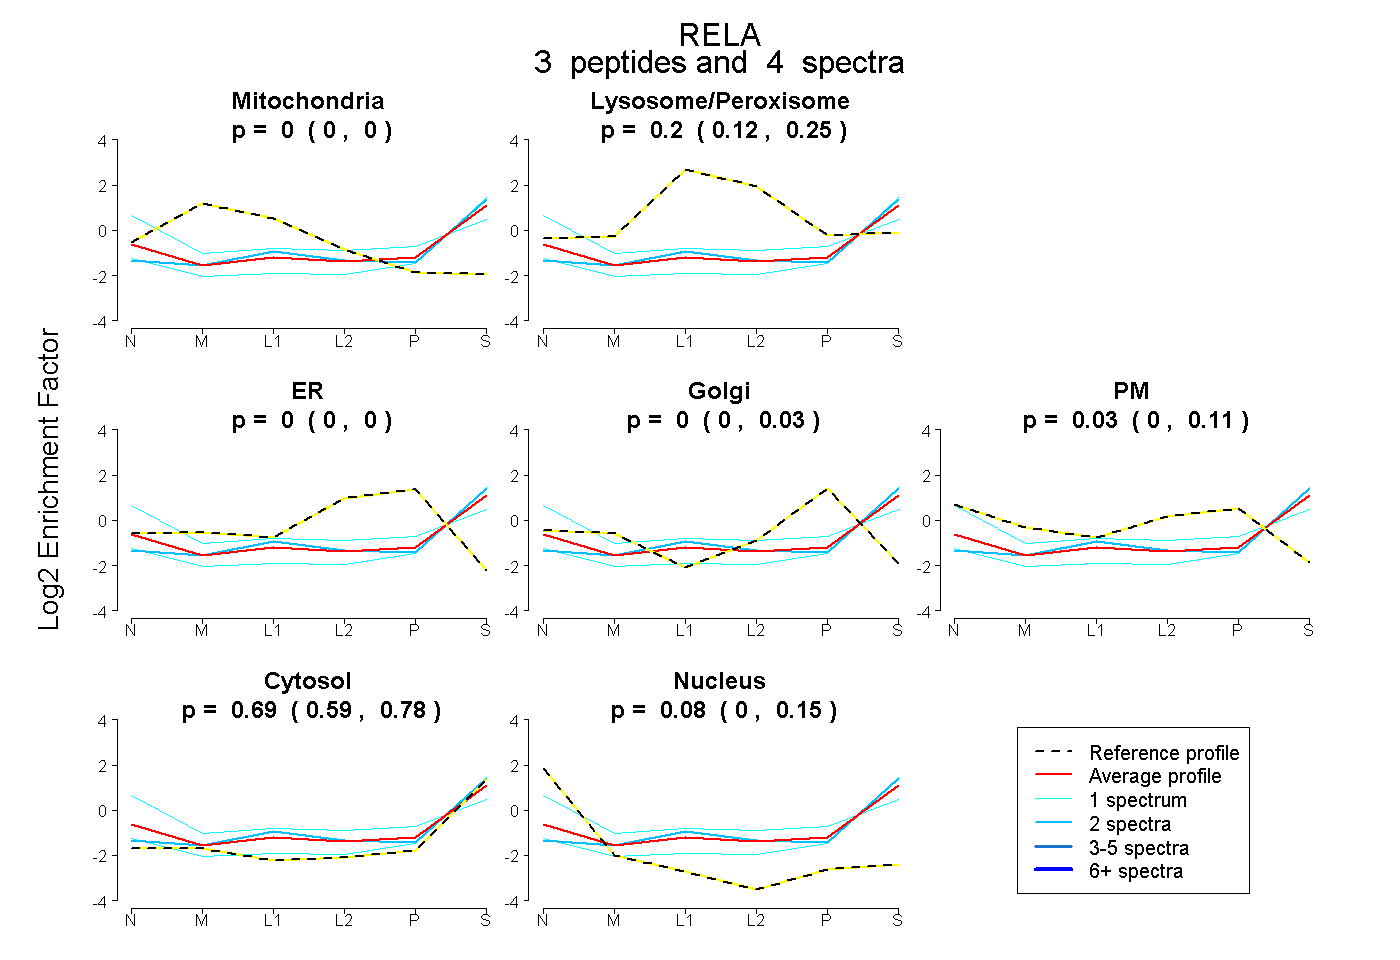
0.000 | 0.000
0.117 | 0.252
0.000 | 0.000
0.000 | 0.029
0.000 | 0.114
0.586 | 0.778
0.000 | 0.151
9peptides
spectra
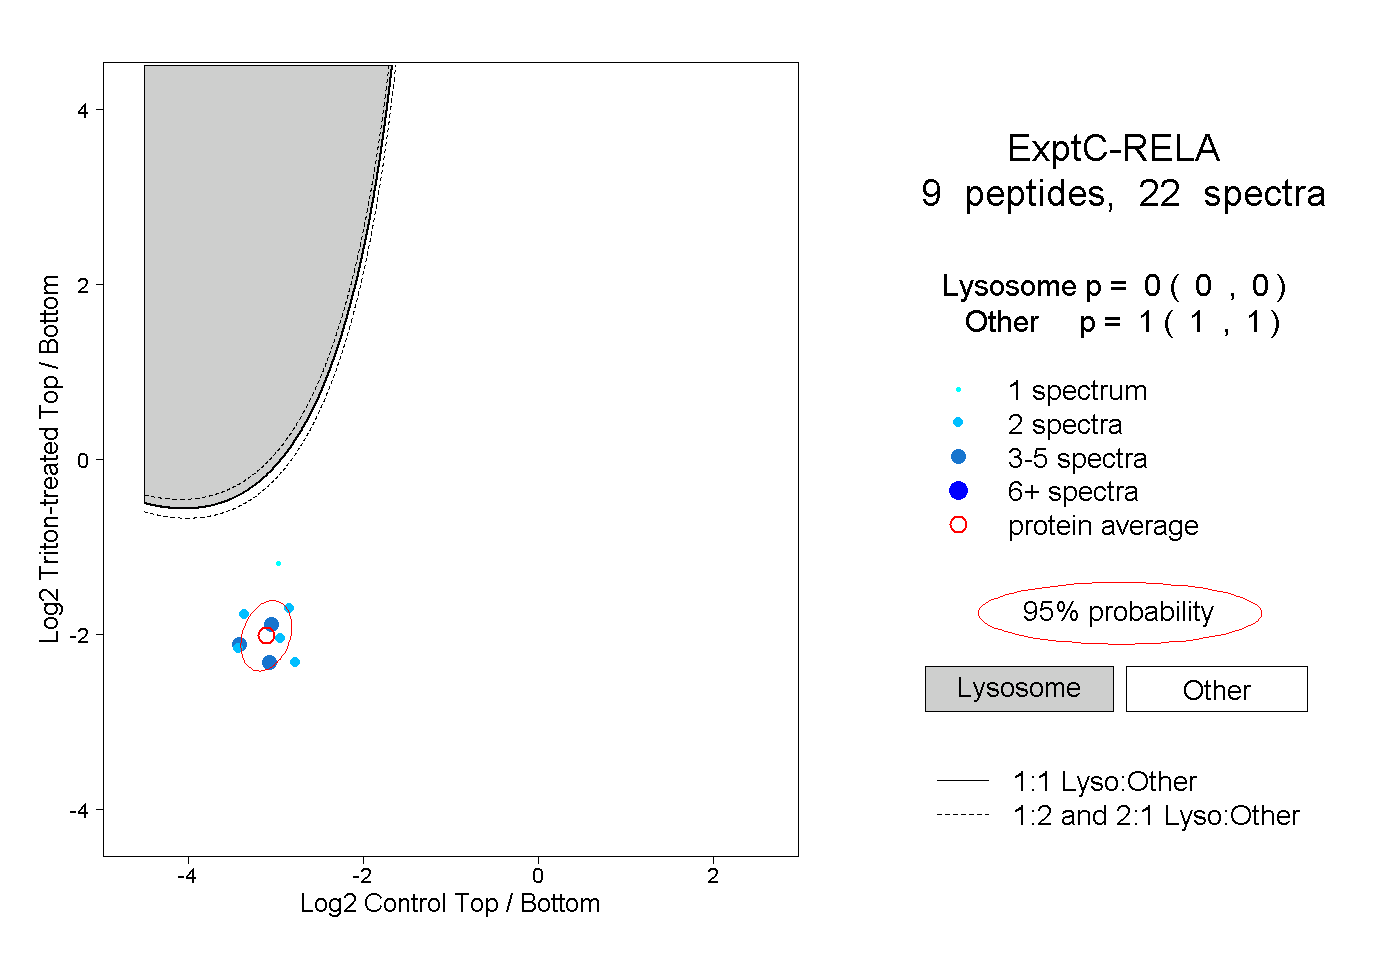
0.000 | 0.000
1.000 | 1.000