RELA
[ENSRNOP00000044552]
Main page
| | | Plot |
Mito |
Lyso |
|
Perox |
ER |
Golgi |
PM |
Cytosol |
Nucleus |
|
| Expt A |
 8
8
peptides |
14
spectra |
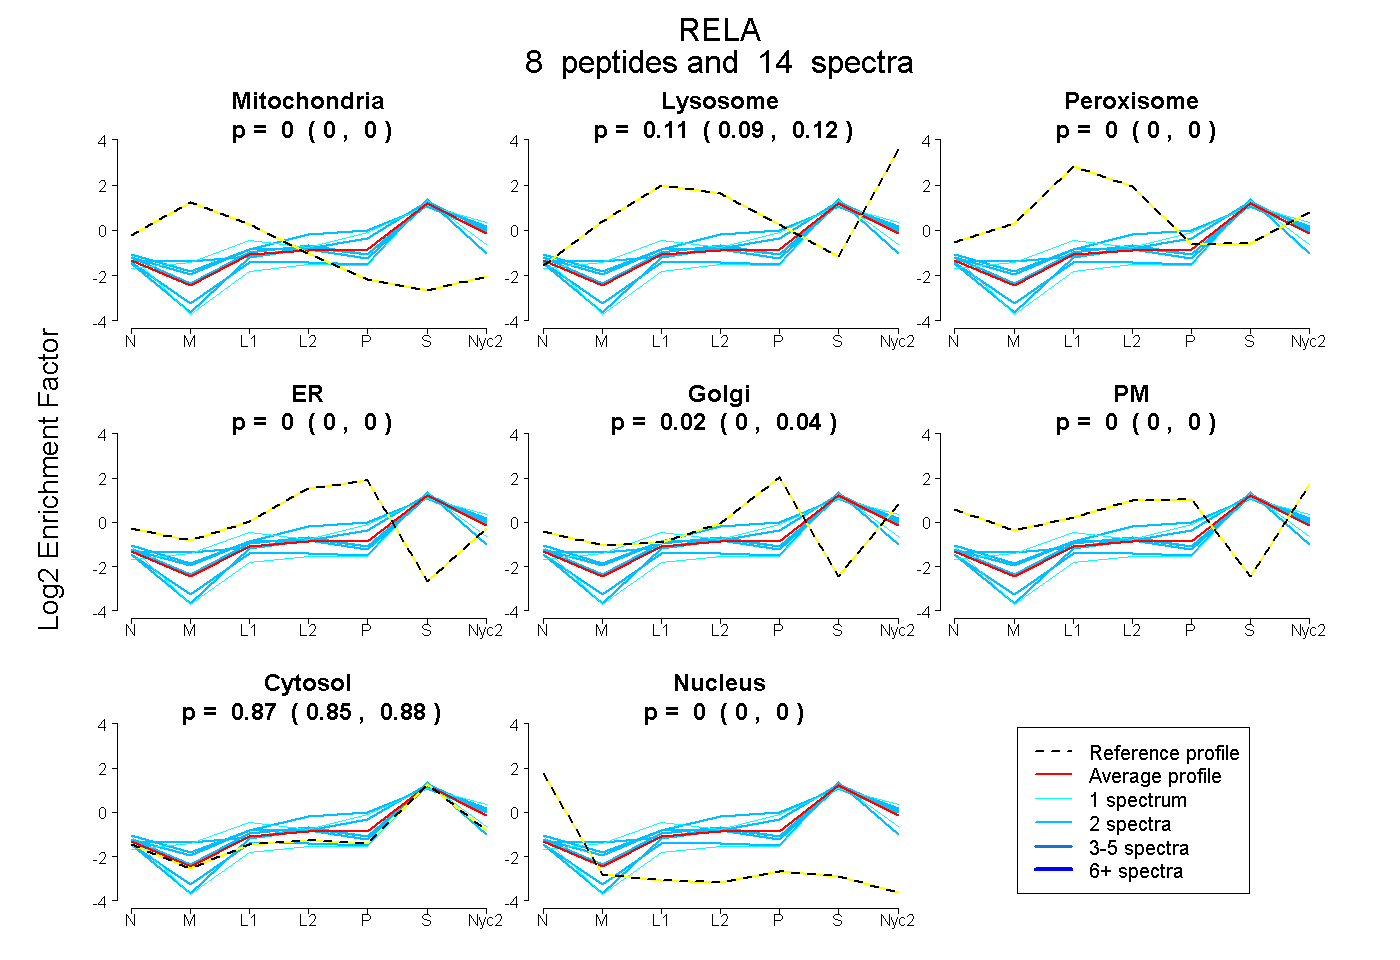 |
0.000
0.000 | 0.000 |
0.108
0.092 | 0.123 |
|
0.000
0.000 | 0.000 |
0.000
0.000 | 0.000 |
0.021
0.001 | 0.038 |
0.000
0.000 | 0.000 |
0.871
0.854 | 0.884 |
0.000
0.000 | 0.000 |
|
| | | Plot |
Mito |
|
Lyso or Perox |
|
ER |
Golgi |
PM |
Cytosol |
Nucleus |
|
| Expt B |
3
peptides |
4
spectra |
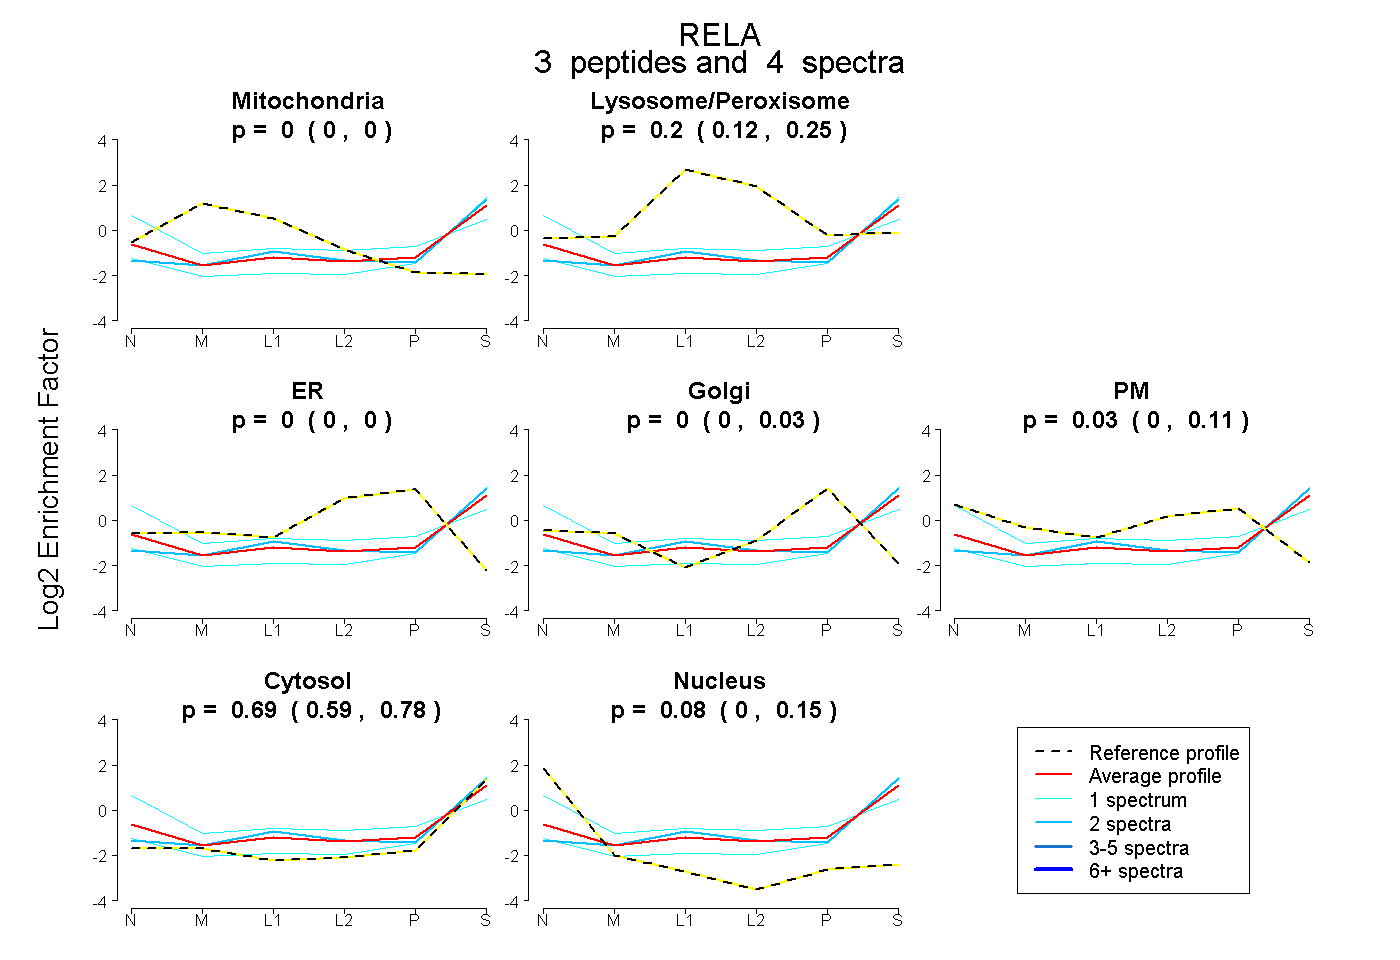 |
0.000
0.000 | 0.000 |
|
0.200
0.117 | 0.252 |
|
0.000
0.000 | 0.000 |
0.000
0.000 | 0.029 |
0.029
0.000 | 0.114 |
0.695
0.586 | 0.778 |
0.077
0.000 | 0.151 |
|
| 1 spectrum, DLEQAISQR |
0.000 |
|
0.053 |
|
0.000 |
0.000 |
0.000 |
0.918 |
0.029 |
|
| 1 spectrum, DGFYEAELCPDR |
0.000 |
|
0.250 |
|
0.000 |
0.000 |
0.224 |
0.360 |
0.167 |
|
| 2 spectra, LTPVLSHPIFDNR |
0.000 |
|
0.214 |
|
0.000 |
0.000 |
0.000 |
0.786 |
0.000 |
|
| | | Plot |
|
Lyso |
|
|
|
|
|
|
|
Other |
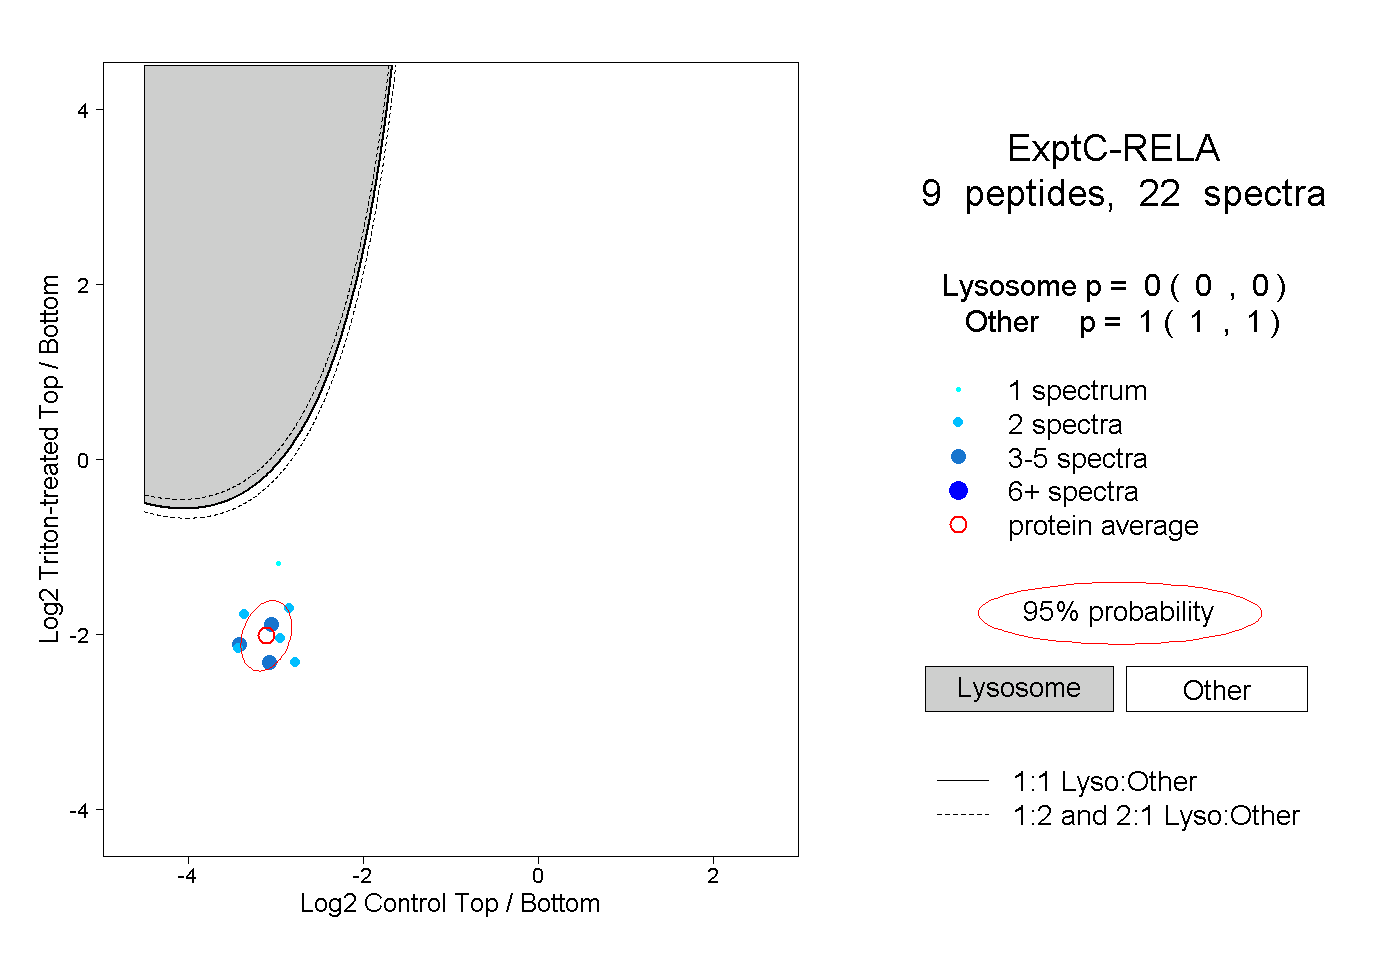
| Expt C |
9
peptides |
22
spectra |
 |
|
0.000
0.000 | 0.000 |
|
|
|
|
|
|
|
1.000
1.000 | 1.000 |