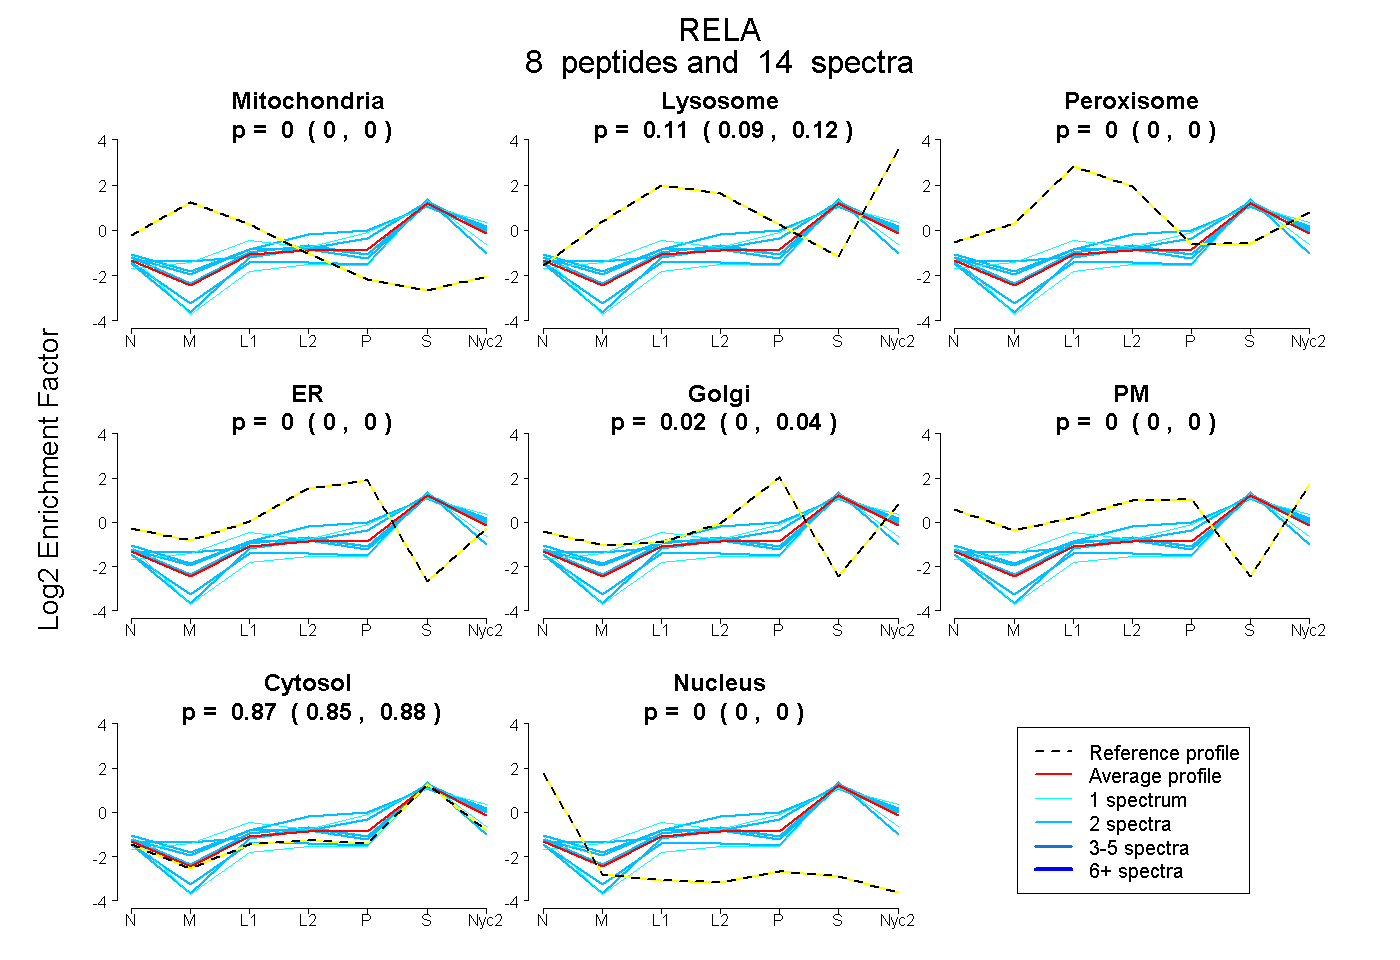
 8
8peptides
spectra
0.000 | 0.000
0.092 | 0.123
0.000 | 0.000
0.000 | 0.000
0.001 | 0.038
0.000 | 0.000
0.854 | 0.884
0.000 | 0.000
| Plot | Mito | Lyso | Perox | ER | Golgi | PM | Cytosol | Nucleus | |||||
| Expt A |
8 peptides |
14 spectra |
|
0.000 0.000 | 0.000 |
0.108 0.092 | 0.123 |
0.000 0.000 | 0.000 |
0.000 0.000 | 0.000 |
0.021 0.001 | 0.038 |
0.000 0.000 | 0.000 |
0.871 0.854 | 0.884 |
0.000 0.000 | 0.000 |
| 2 spectra, IAVPSR | 0.000 | 0.020 | 0.000 | 0.000 | 0.099 | 0.000 | 0.882 | 0.000 | ||
| 1 spectrum, IQTNNNPFQVPIEEQR | 0.000 | 0.000 | 0.000 | 0.000 | 0.000 | 0.000 | 0.958 | 0.042 | ||
| 2 spectra, DGFYEAELCPDR | 0.000 | 0.000 | 0.000 | 0.000 | 0.000 | 0.000 | 0.986 | 0.014 | ||
| 1 spectrum, SPFNGPTEPRPPPR | 0.000 | 0.259 | 0.000 | 0.000 | 0.044 | 0.000 | 0.698 | 0.000 | ||
| 2 spectra, LTPVLSHPIFDNR | 0.000 | 0.149 | 0.000 | 0.000 | 0.000 | 0.000 | 0.851 | 0.000 | ||
| 2 spectra, SAGSIPGER | 0.000 | 0.151 | 0.030 | 0.000 | 0.000 | 0.000 | 0.820 | 0.000 | ||
| 2 spectra, GDYDLNAVR | 0.000 | 0.142 | 0.000 | 0.138 | 0.007 | 0.000 | 0.713 | 0.000 | ||
| 2 spectra, QVAIVFR | 0.004 | 0.195 | 0.000 | 0.000 | 0.000 | 0.000 | 0.801 | 0.000 |
| Plot | Mito | Lyso or Perox | ER | Golgi | PM | Cytosol | Nucleus | ||||||
| Expt B |
3 peptides |
4 spectra |
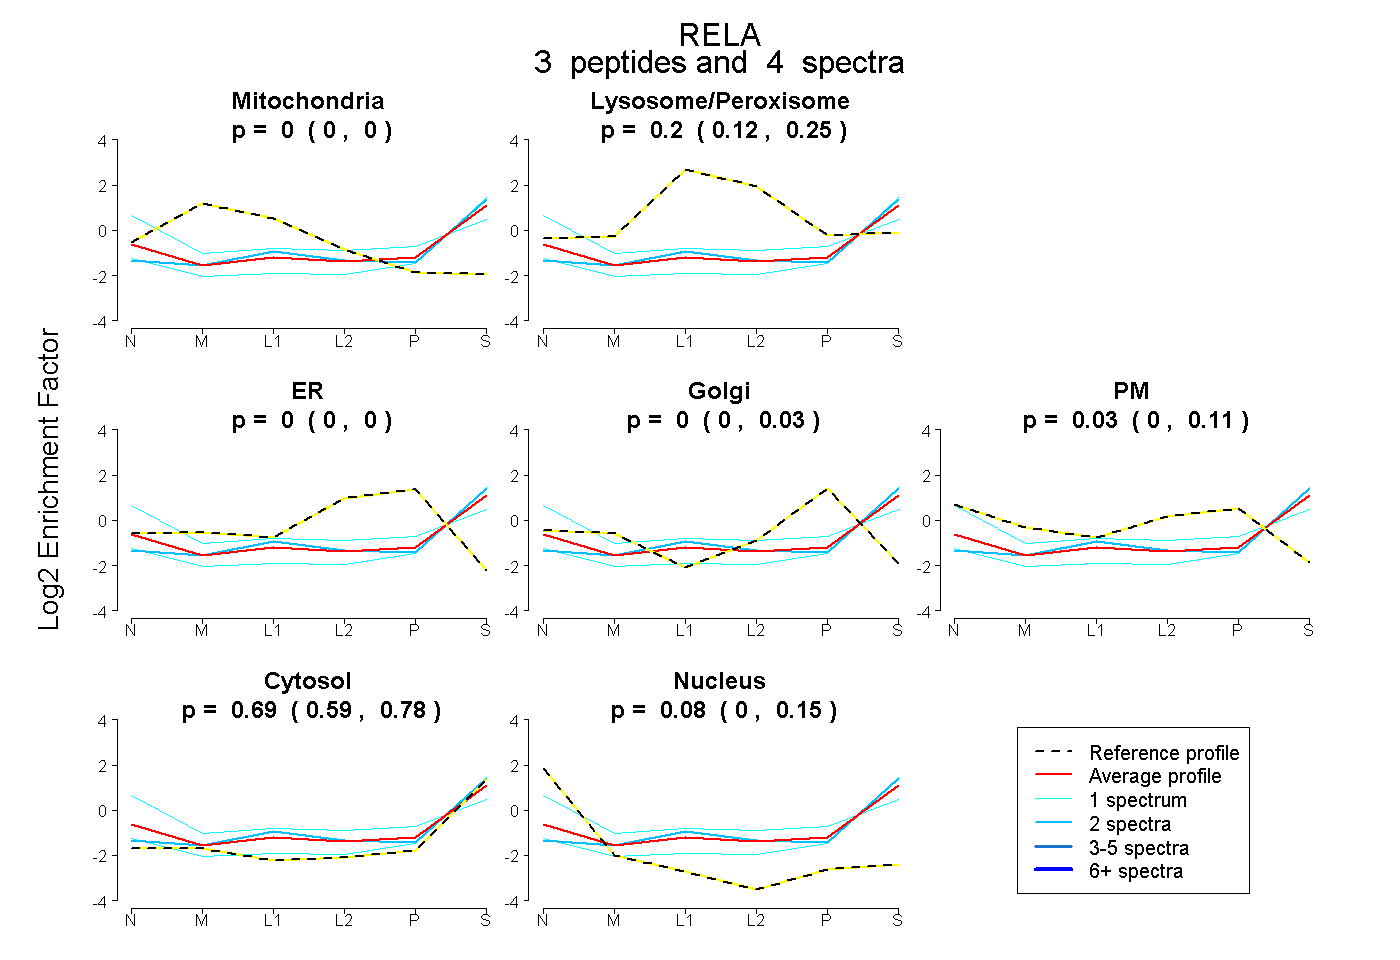 |
0.000 0.000 | 0.000 |
0.200 0.117 | 0.252 |
0.000 0.000 | 0.000 |
0.000 0.000 | 0.029 |
0.029 0.000 | 0.114 |
0.695 0.586 | 0.778 |
0.077 0.000 | 0.151 |
|||
| Plot | Lyso | Other | |||||||||||
| Expt C |
9 peptides |
22 spectra |
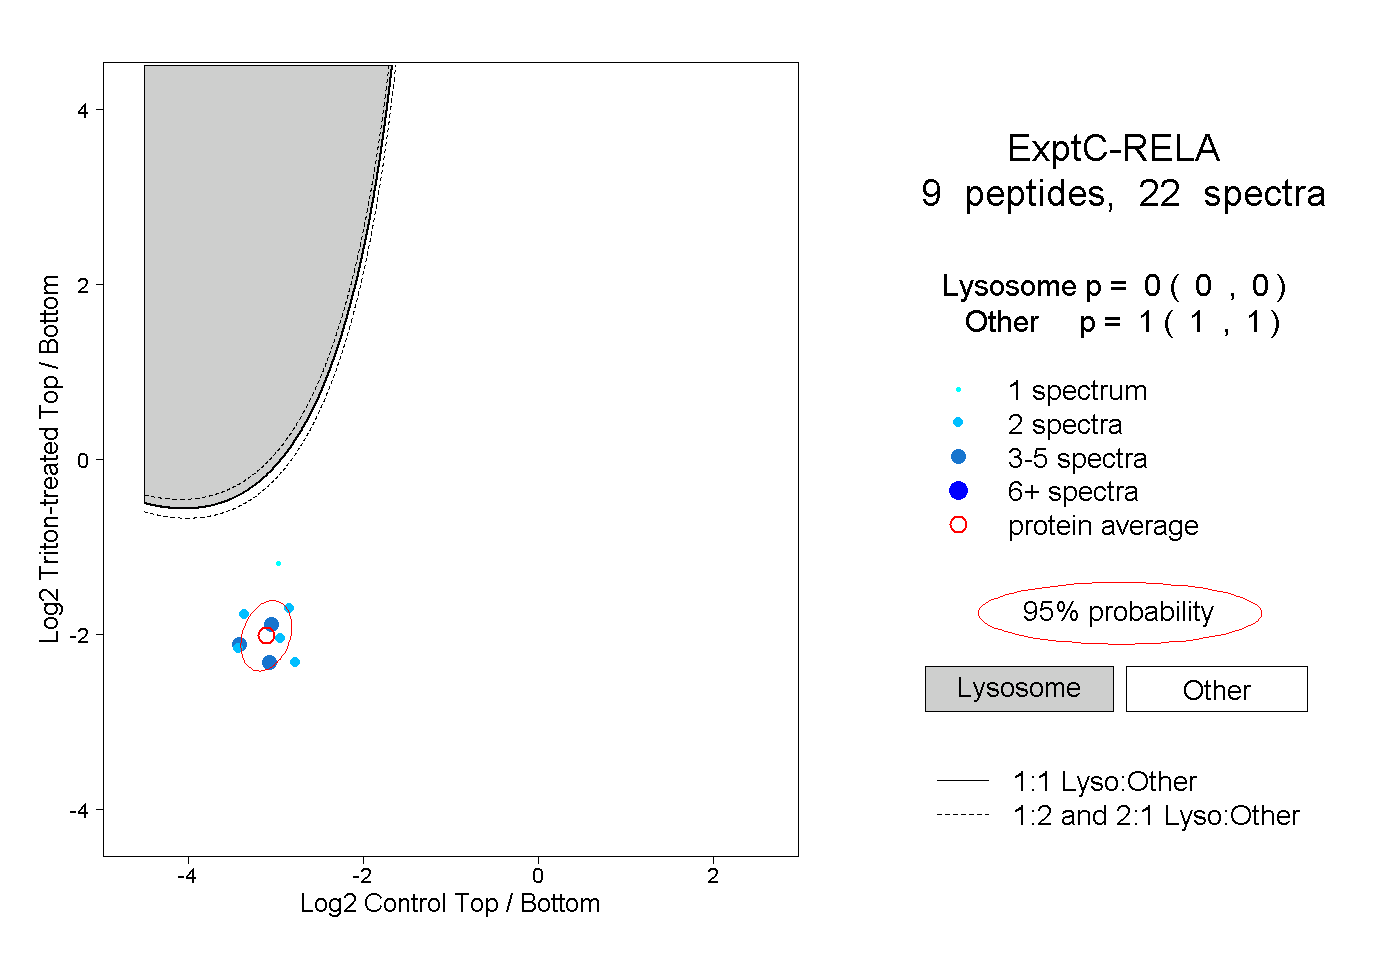 |
0.000 0.000 | 0.000 |
1.000 1.000 | 1.000 |