 6
6peptides
spectra
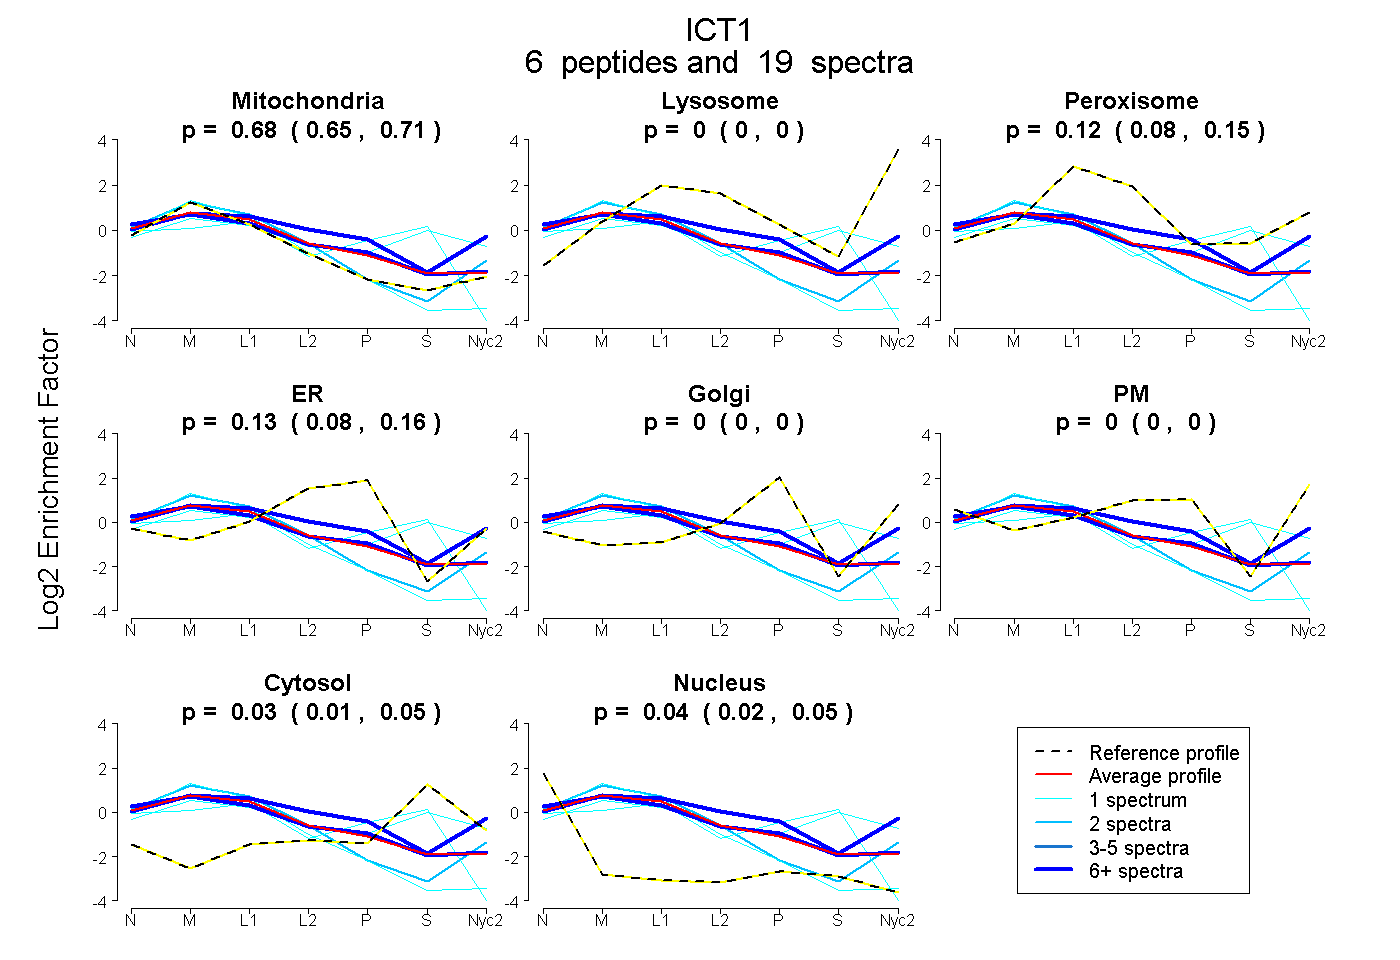
0.652 | 0.708
0.000 | 0.000
0.080 | 0.149
0.083 | 0.158
0.000 | 0.004
0.000 | 0.000
0.006 | 0.052
0.022 | 0.054
3peptides
spectra
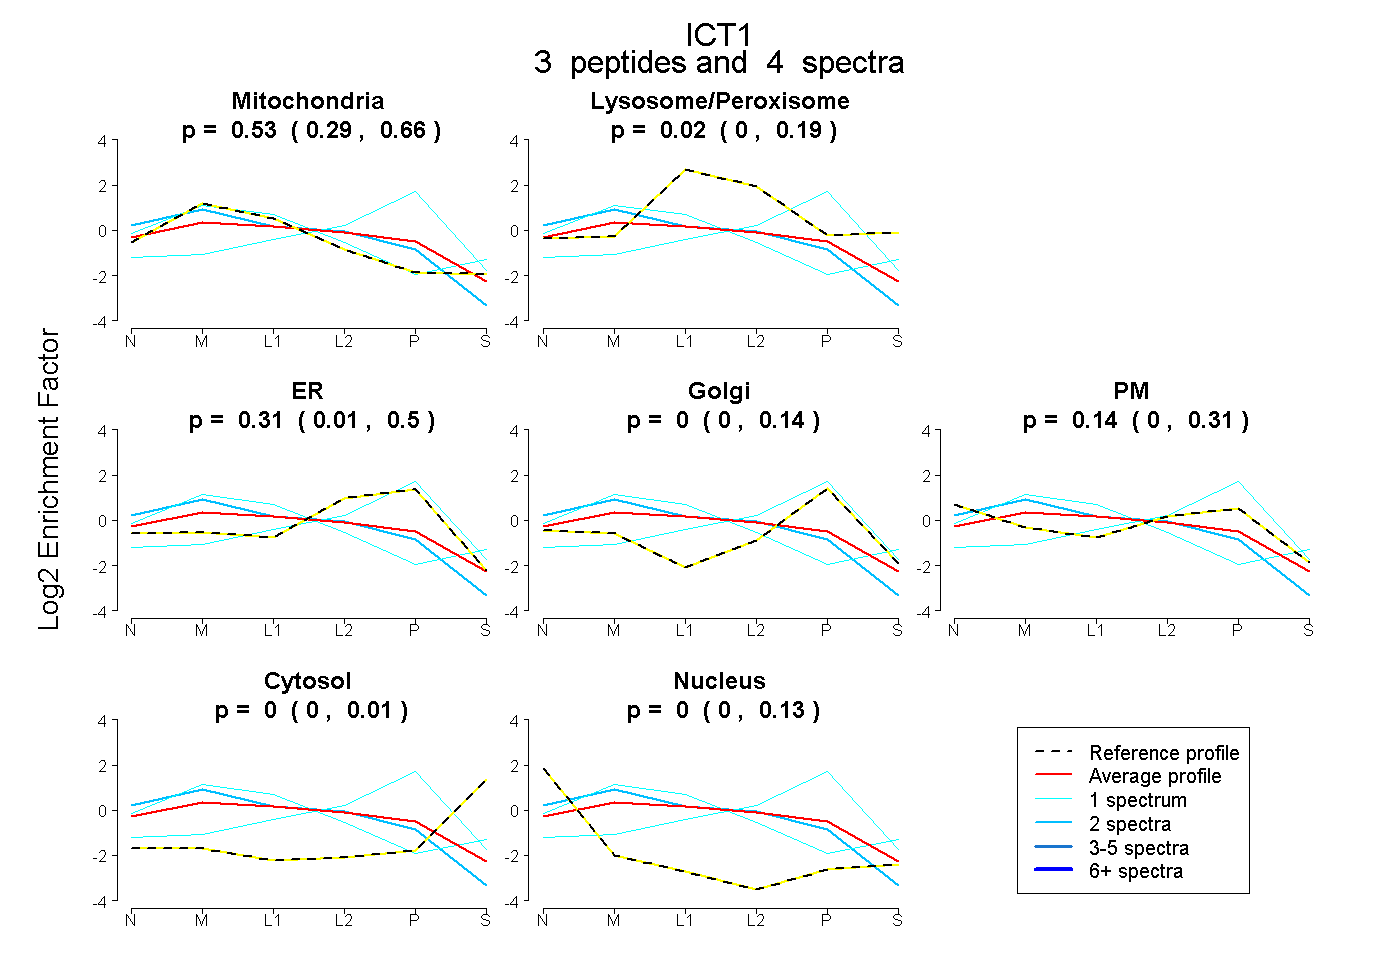
0.286 | 0.663
0.000 | 0.187
0.009 | 0.495
0.000 | 0.135
0.000 | 0.306
0.000 | 0.009
0.000 | 0.126
12peptides
spectra
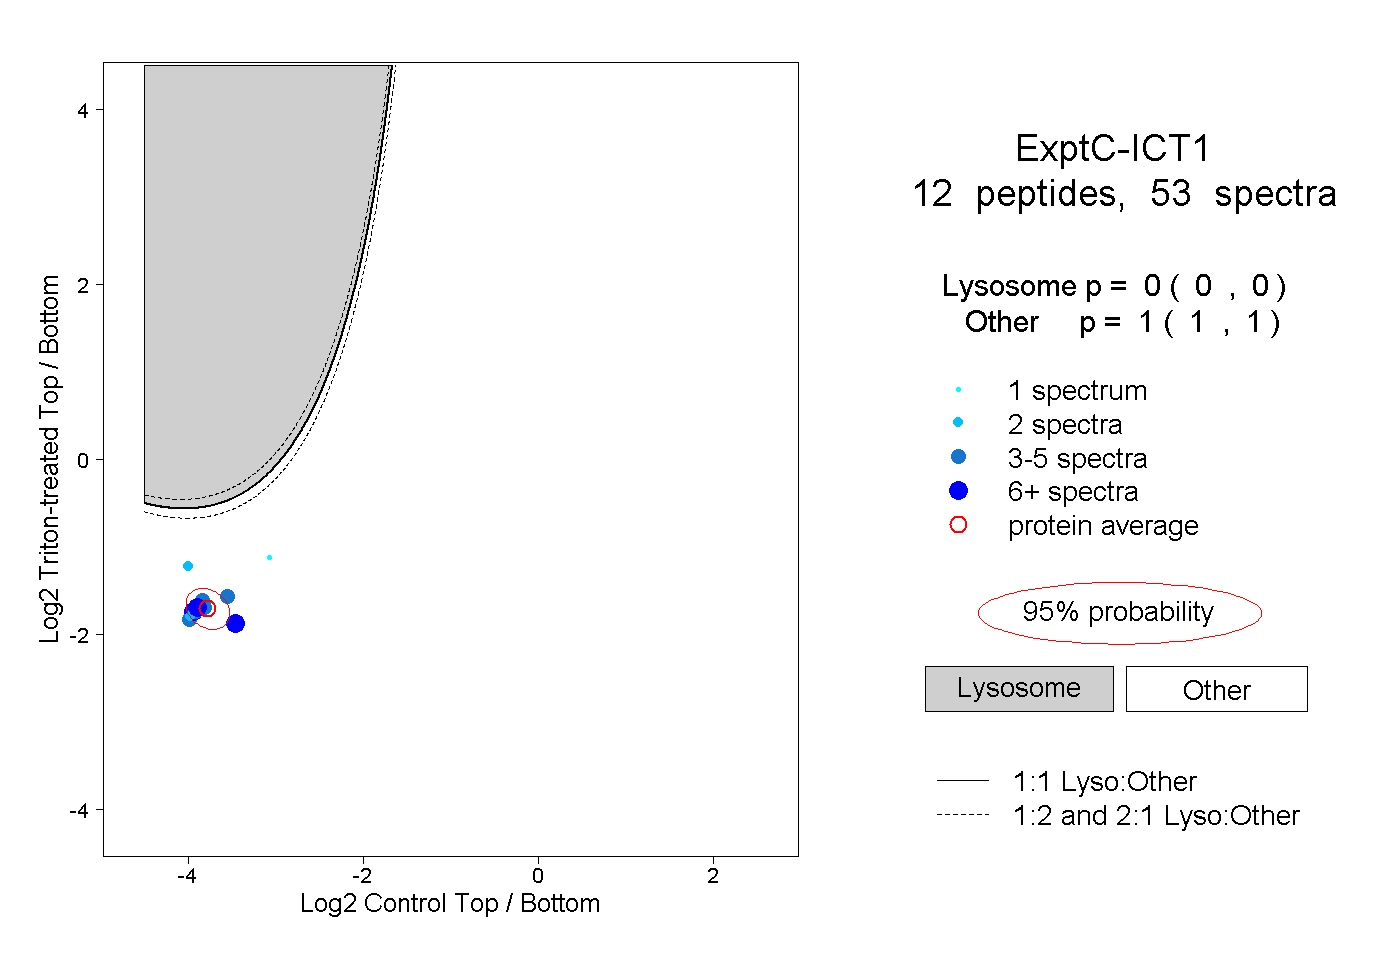
0.000 | 0.000
1.000 | 1.000
4peptides
spectra
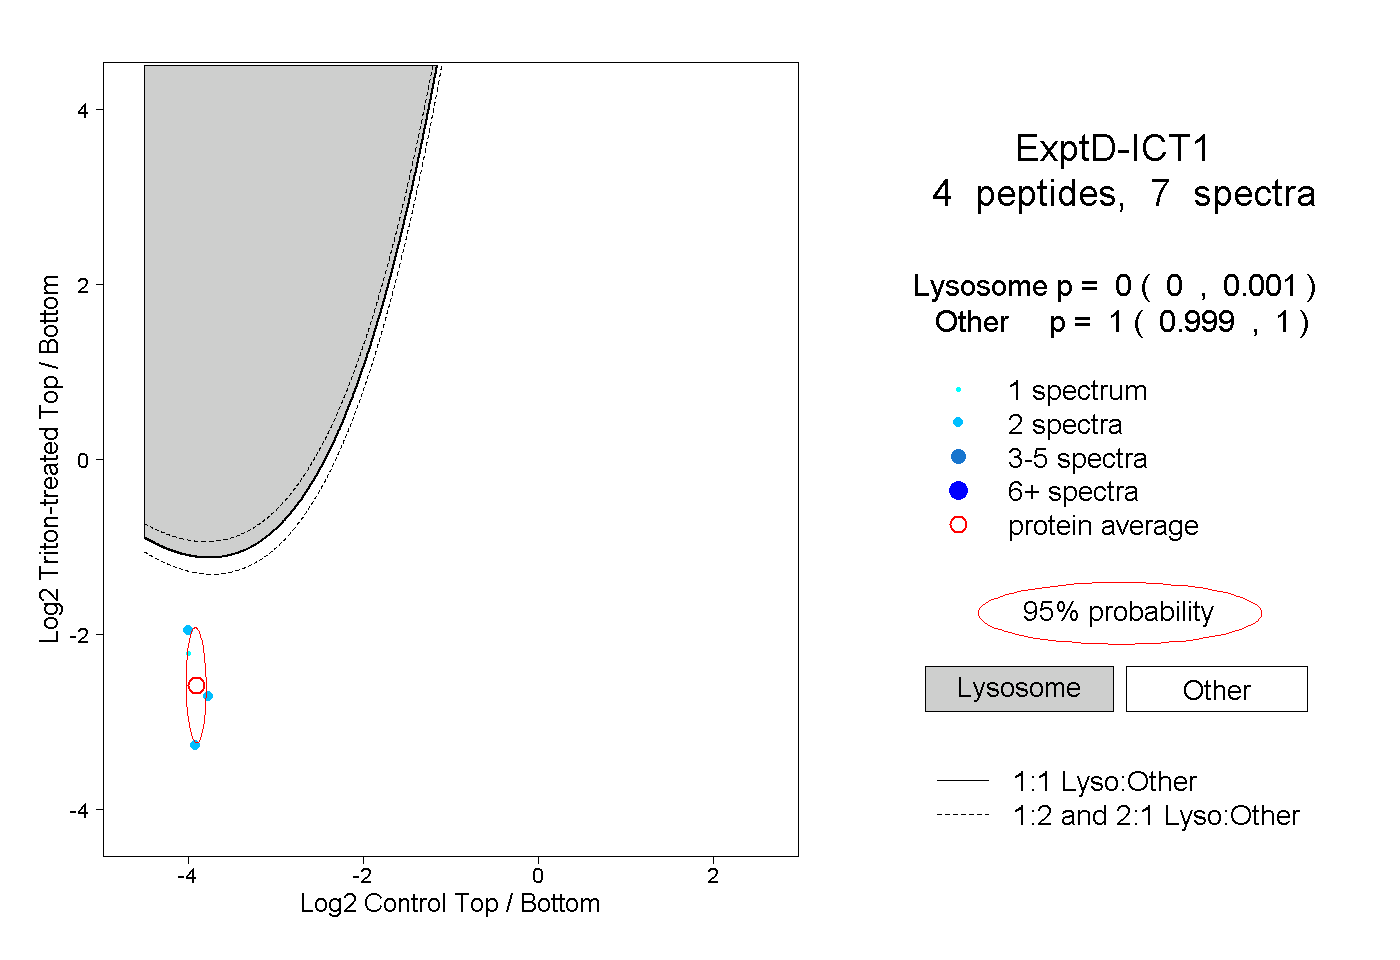
0.000 | 0.001
0.999 | 1.000