 6
6peptides
spectra
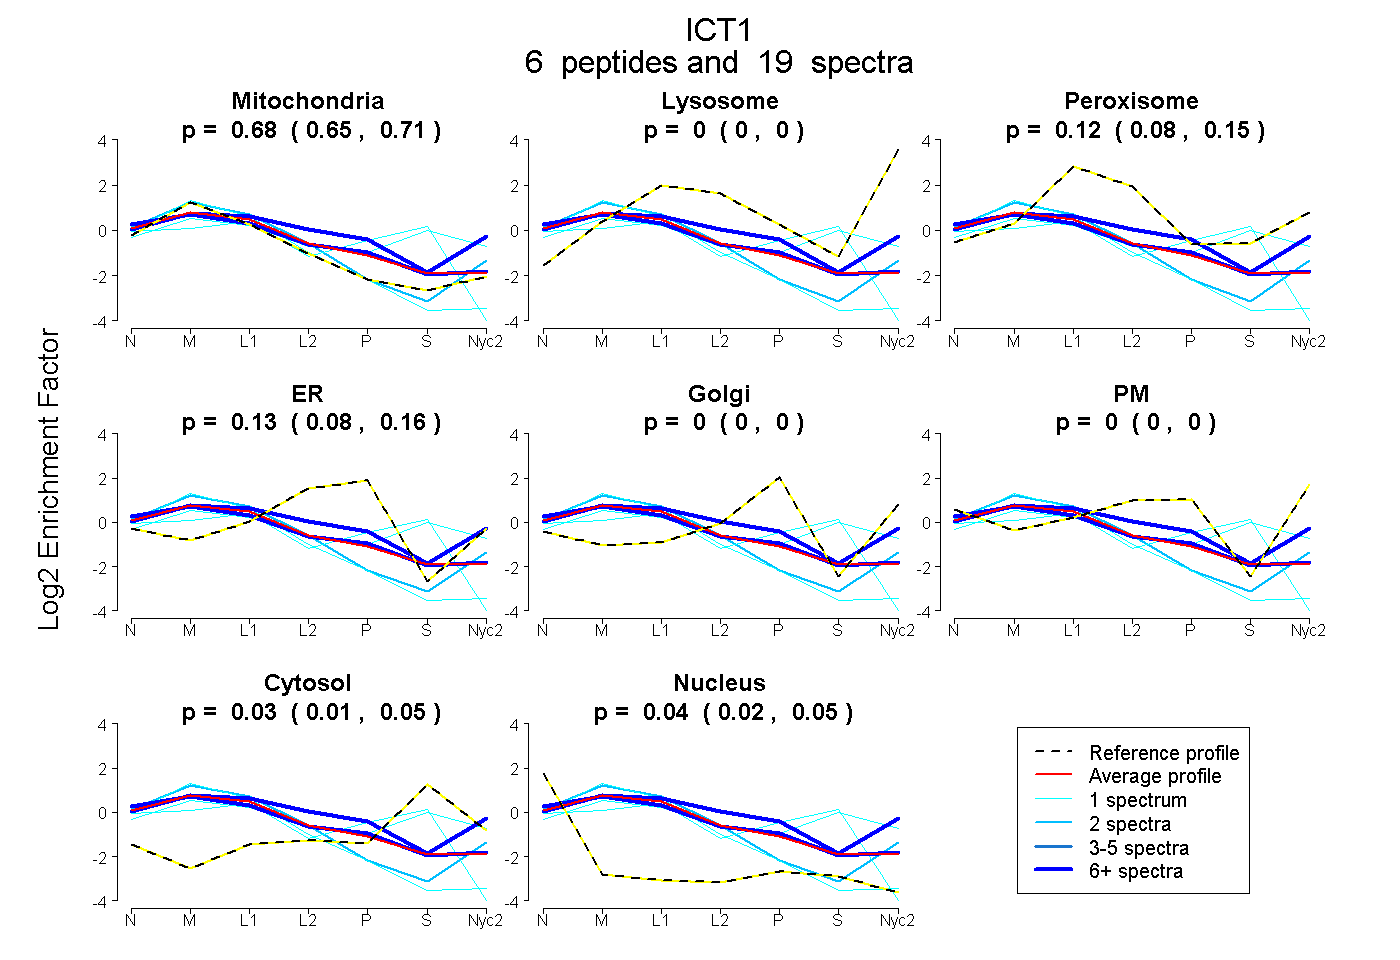
0.652 | 0.708
0.000 | 0.000
0.080 | 0.149
0.083 | 0.158
0.000 | 0.004
0.000 | 0.000
0.006 | 0.052
0.022 | 0.054
| Plot | Mito | Lyso | Perox | ER | Golgi | PM | Cytosol | Nucleus | |||||
| Expt A |
6 peptides |
19 spectra |
|
0.682 0.652 | 0.708 |
0.000 0.000 | 0.000 |
0.117 0.080 | 0.149 |
0.129 0.083 | 0.158 |
0.000 0.000 | 0.004 |
0.000 0.000 | 0.000 |
0.033 0.006 | 0.052 |
0.039 0.022 | 0.054 |
| 8 spectra, VPEHAEQASSDIPLDR | 0.446 | 0.000 | 0.212 | 0.000 | 0.107 | 0.235 | 0.000 | 0.000 | ||
| 2 spectra, AGELVLTSESSR | 0.873 | 0.013 | 0.036 | 0.000 | 0.000 | 0.078 | 0.000 | 0.000 | ||
| 1 spectrum, FHLASADWIAEPVR | 0.582 | 0.000 | 0.000 | 0.028 | 0.000 | 0.000 | 0.369 | 0.021 | ||
| 6 spectra, SSGPGGQNVNK | 0.632 | 0.000 | 0.110 | 0.165 | 0.000 | 0.000 | 0.019 | 0.073 | ||
| 1 spectrum, SIYSLDK | 0.379 | 0.017 | 0.257 | 0.000 | 0.005 | 0.002 | 0.340 | 0.000 | ||
| 1 spectrum, NLAECLQK | 0.961 | 0.000 | 0.000 | 0.000 | 0.000 | 0.000 | 0.000 | 0.039 |
| Plot | Mito | Lyso or Perox | ER | Golgi | PM | Cytosol | Nucleus | ||||||
| Expt B |
3 peptides |
4 spectra |
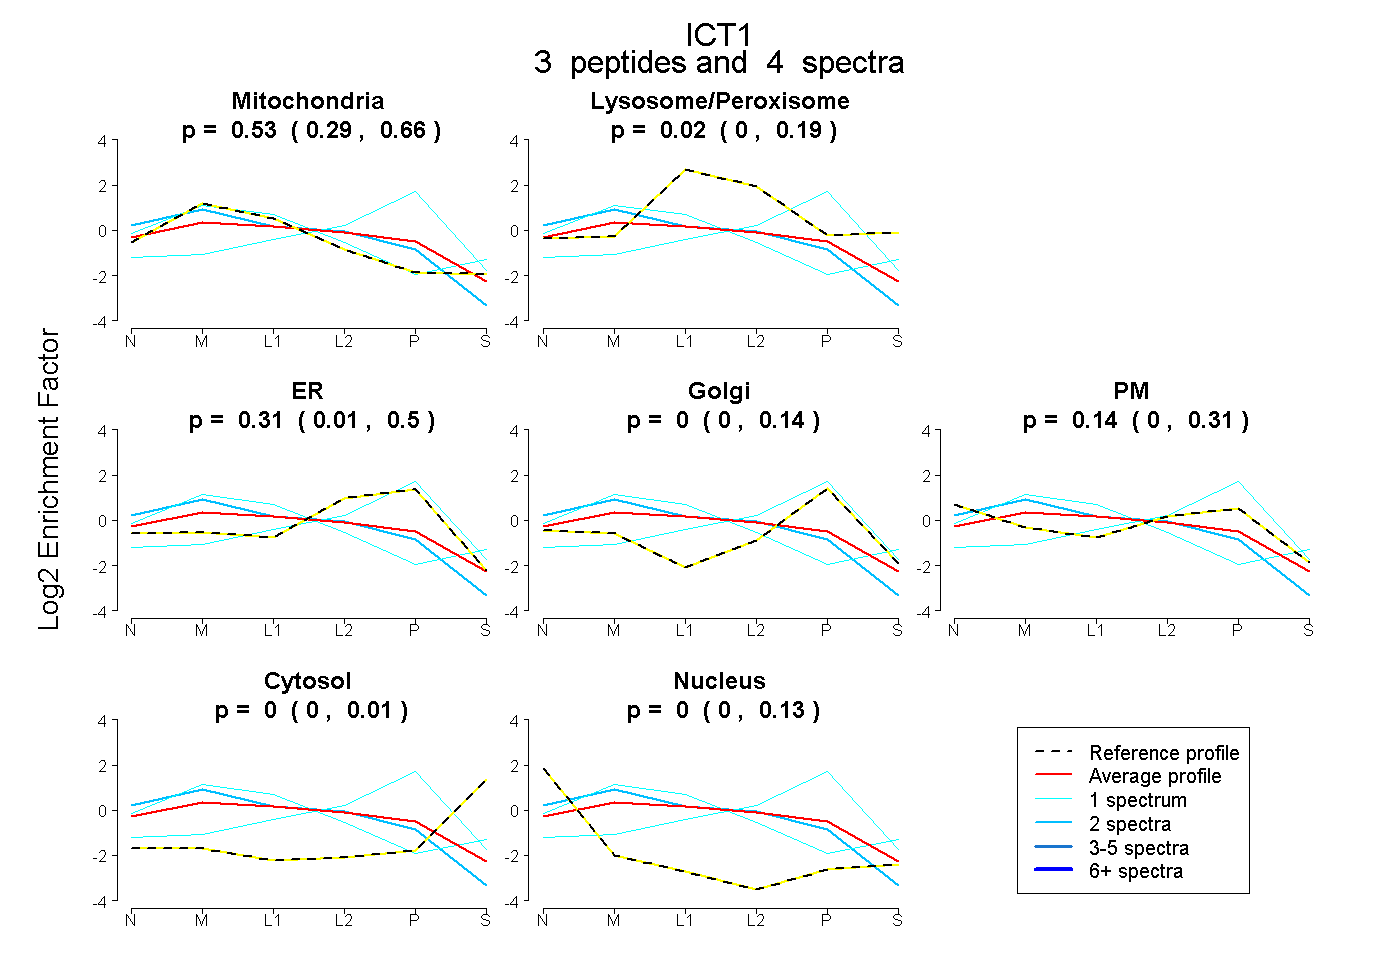 |
0.534 0.286 | 0.663 |
0.017 0.000 | 0.187 |
0.313 0.009 | 0.495 |
0.000 0.000 | 0.135 |
0.136 0.000 | 0.306 |
0.000 0.000 | 0.009 |
0.001 0.000 | 0.126 |
|||
| Plot | Lyso | Other | |||||||||||
| Expt C |
12 peptides |
53 spectra |
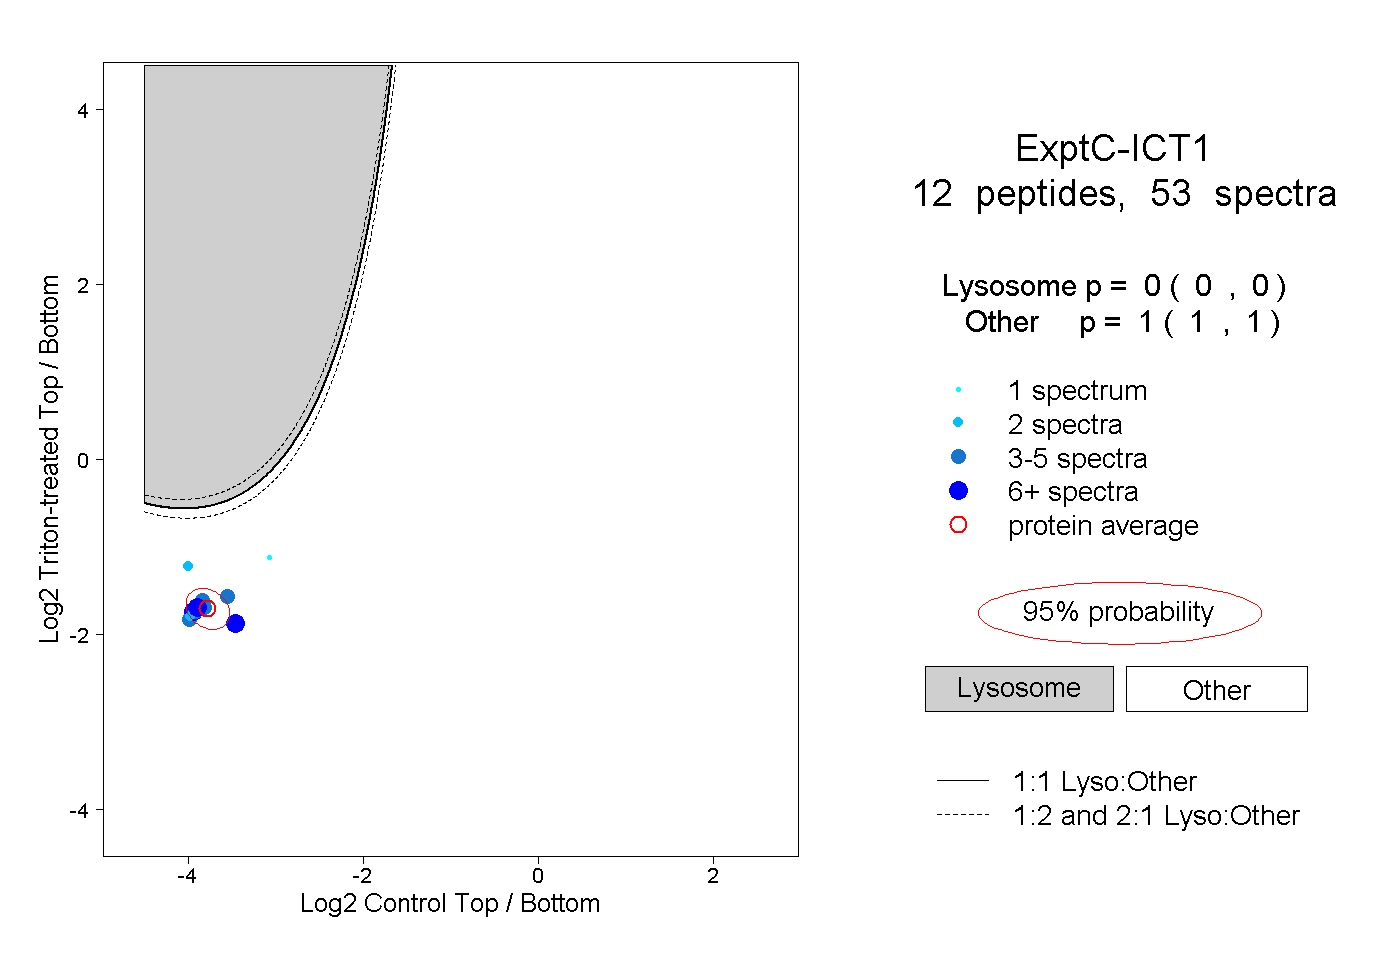 |
0.000 0.000 | 0.000 |
1.000 1.000 | 1.000 |
||||||||
| Plot | Lyso | Other | |||||||||||
| Expt D |
4 peptides |
7 spectra |
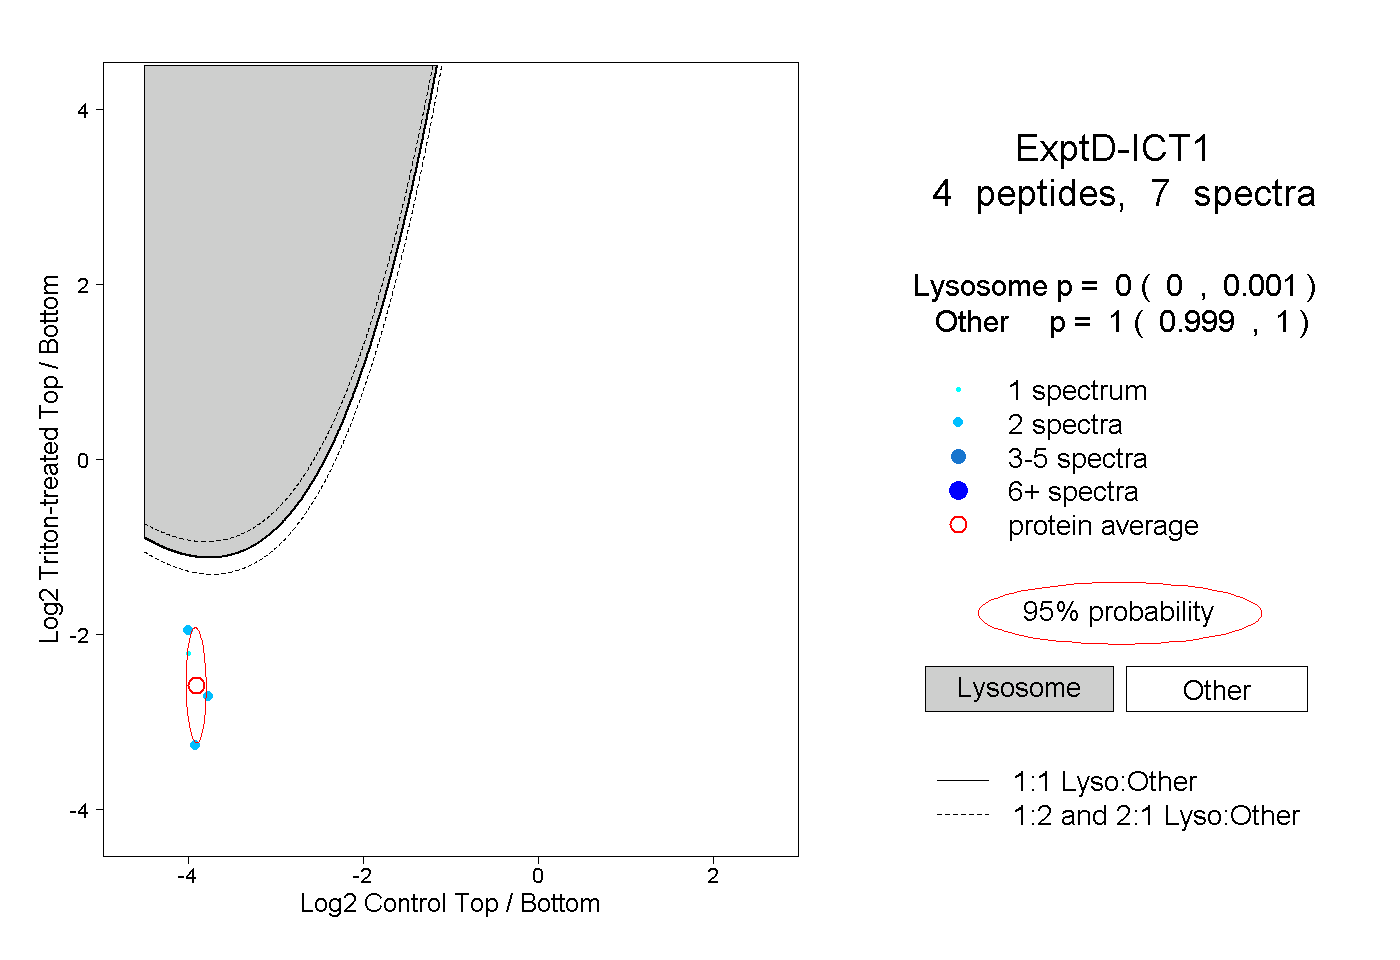 |
0.000 0.000 | 0.001 |
1.000 0.999 | 1.000 |