ICT1
[ENSRNOP00000043868]
Main page
| | | Plot |
Mito |
Lyso |
|
Perox |
ER |
Golgi |
PM |
Cytosol |
Nucleus |
|
| Expt A |
 6
6
peptides |
19
spectra |
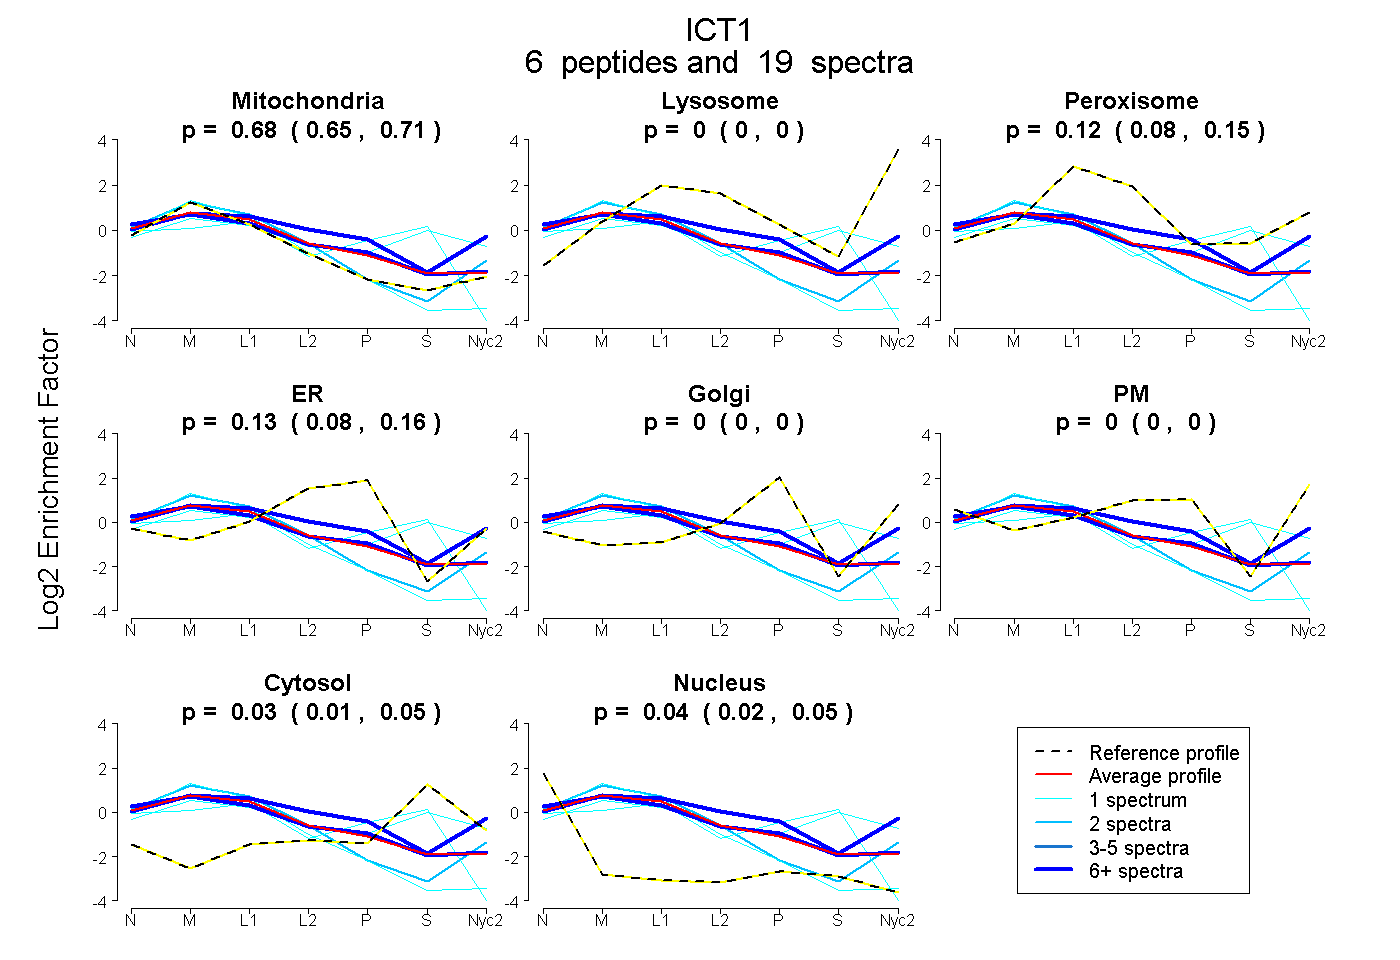 |
0.682
0.652 | 0.708 |
0.000
0.000 | 0.000 |
|
0.117
0.080 | 0.149 |
0.129
0.083 | 0.158 |
0.000
0.000 | 0.004 |
0.000
0.000 | 0.000 |
0.033
0.006 | 0.052 |
0.039
0.022 | 0.054 |
|
| | | Plot |
Mito |
|
Lyso or Perox |
|
ER |
Golgi |
PM |
Cytosol |
Nucleus |
|
| Expt B |
3
peptides |
4
spectra |
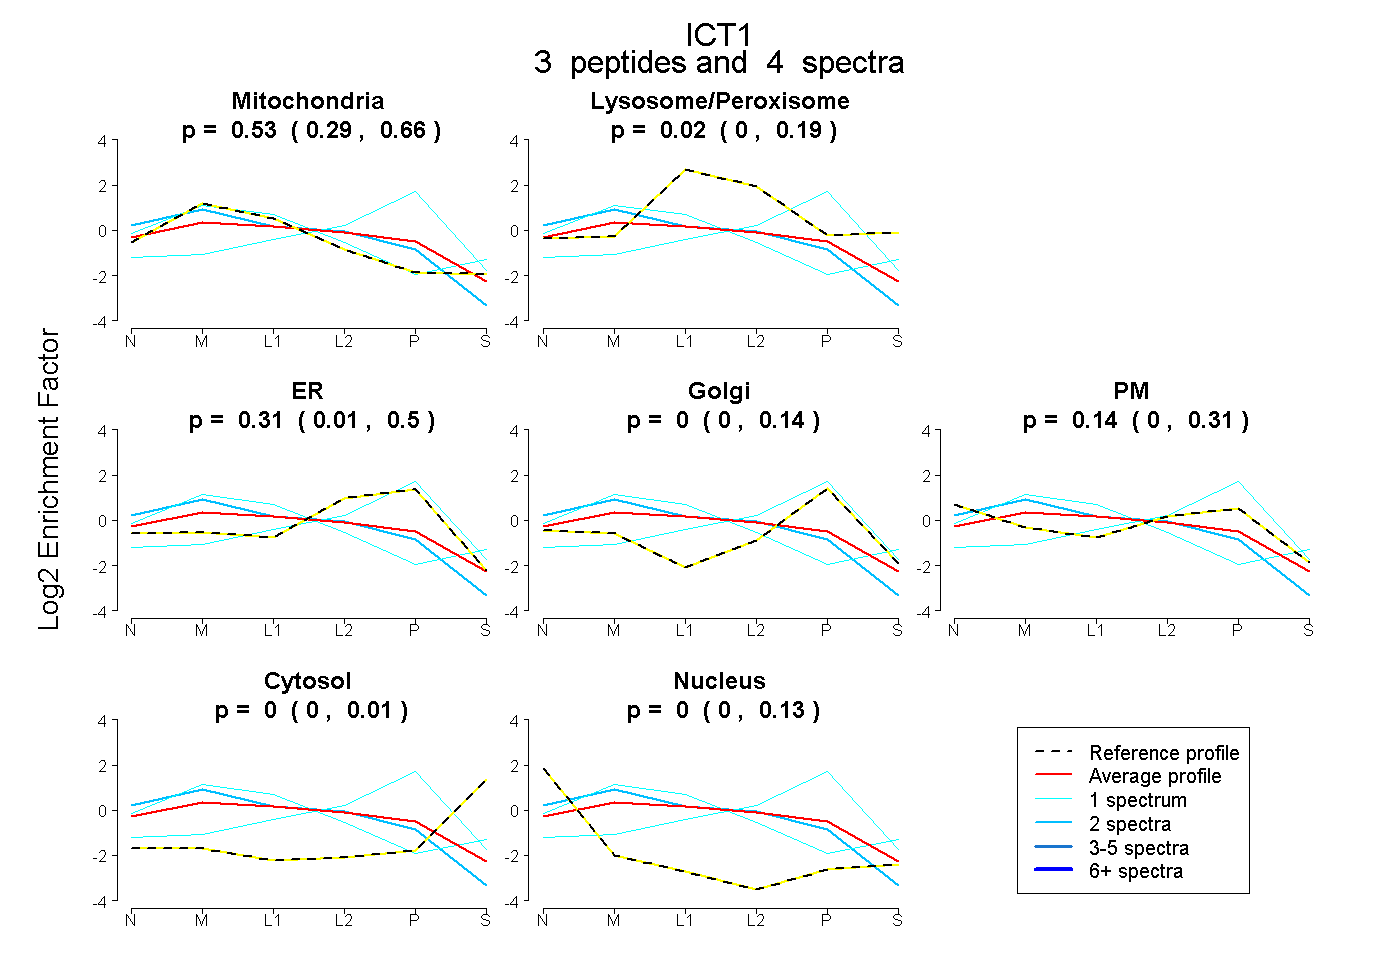 |
0.534
0.286 | 0.663 |
|
0.017
0.000 | 0.187 |
|
0.313
0.009 | 0.495 |
0.000
0.000 | 0.135 |
0.136
0.000 | 0.306 |
0.000
0.000 | 0.009 |
0.001
0.000 | 0.126 |
|
| 1 spectrum, MAAAWGLR |
0.000 |
|
0.104 |
|
0.603 |
0.267 |
0.000 |
0.027 |
0.000 |
|
| 2 spectra, AGELVLTSESSR |
0.617 |
|
0.000 |
|
0.149 |
0.000 |
0.234 |
0.000 |
0.000 |
|
| 1 spectrum, LSISYCR |
0.830 |
|
0.129 |
|
0.000 |
0.000 |
0.000 |
0.024 |
0.017 |
|
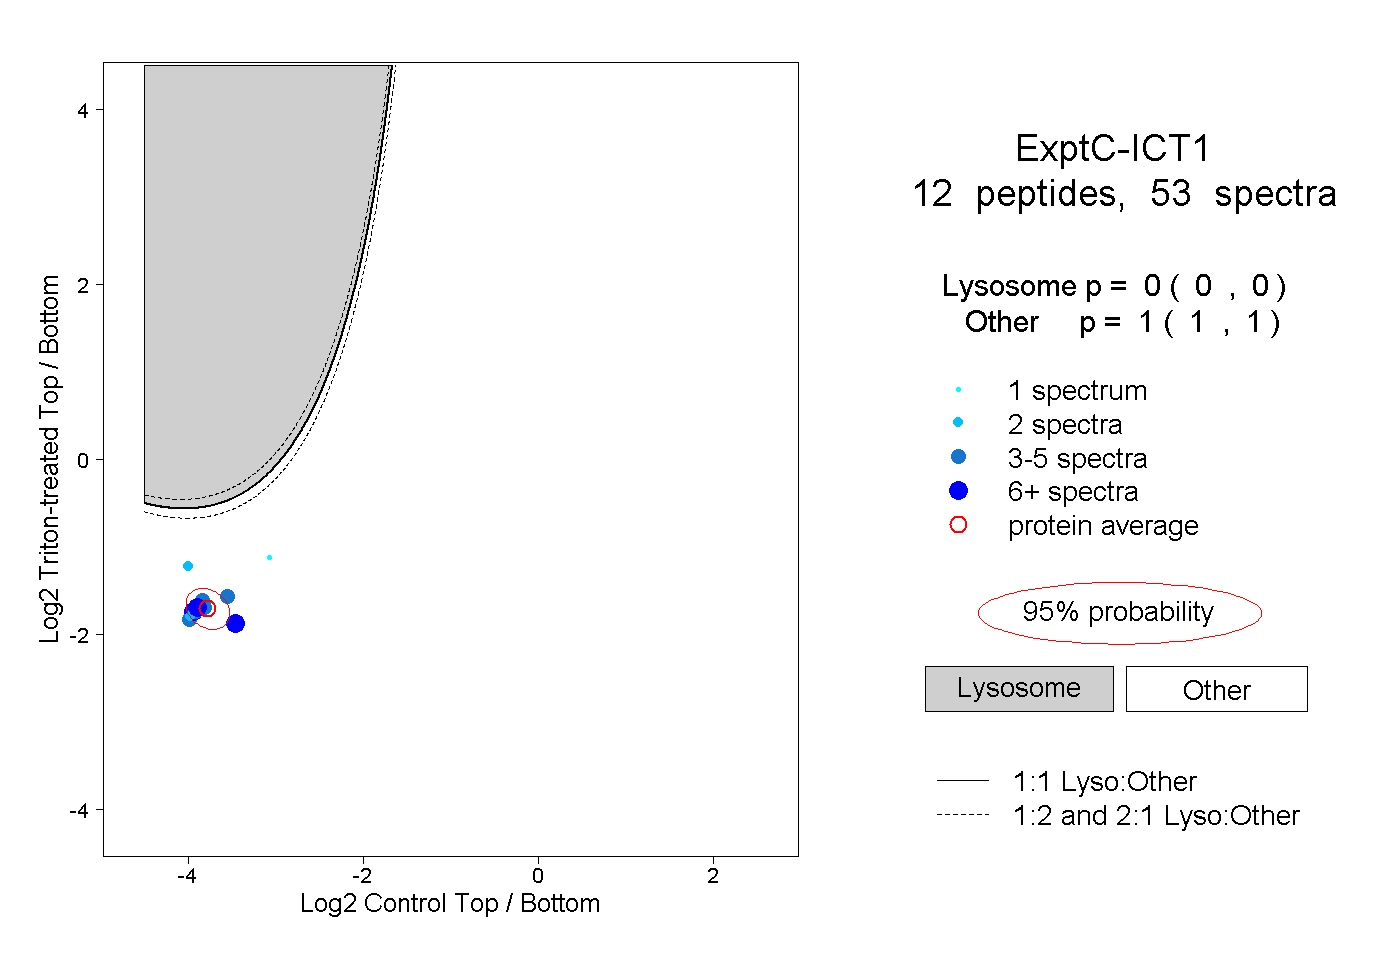
| | | Plot |
|
Lyso |
|
|
|
|
|
|
|
Other |
| Expt C |
12
peptides |
53
spectra |
 |
|
0.000
0.000 | 0.000 |
|
|
|
|
|
|
|
1.000
1.000 | 1.000 |
| | | Plot |
|
Lyso |
|
|
|
|
|
|
|
Other |
| Expt D |
4
peptides |
7
spectra |
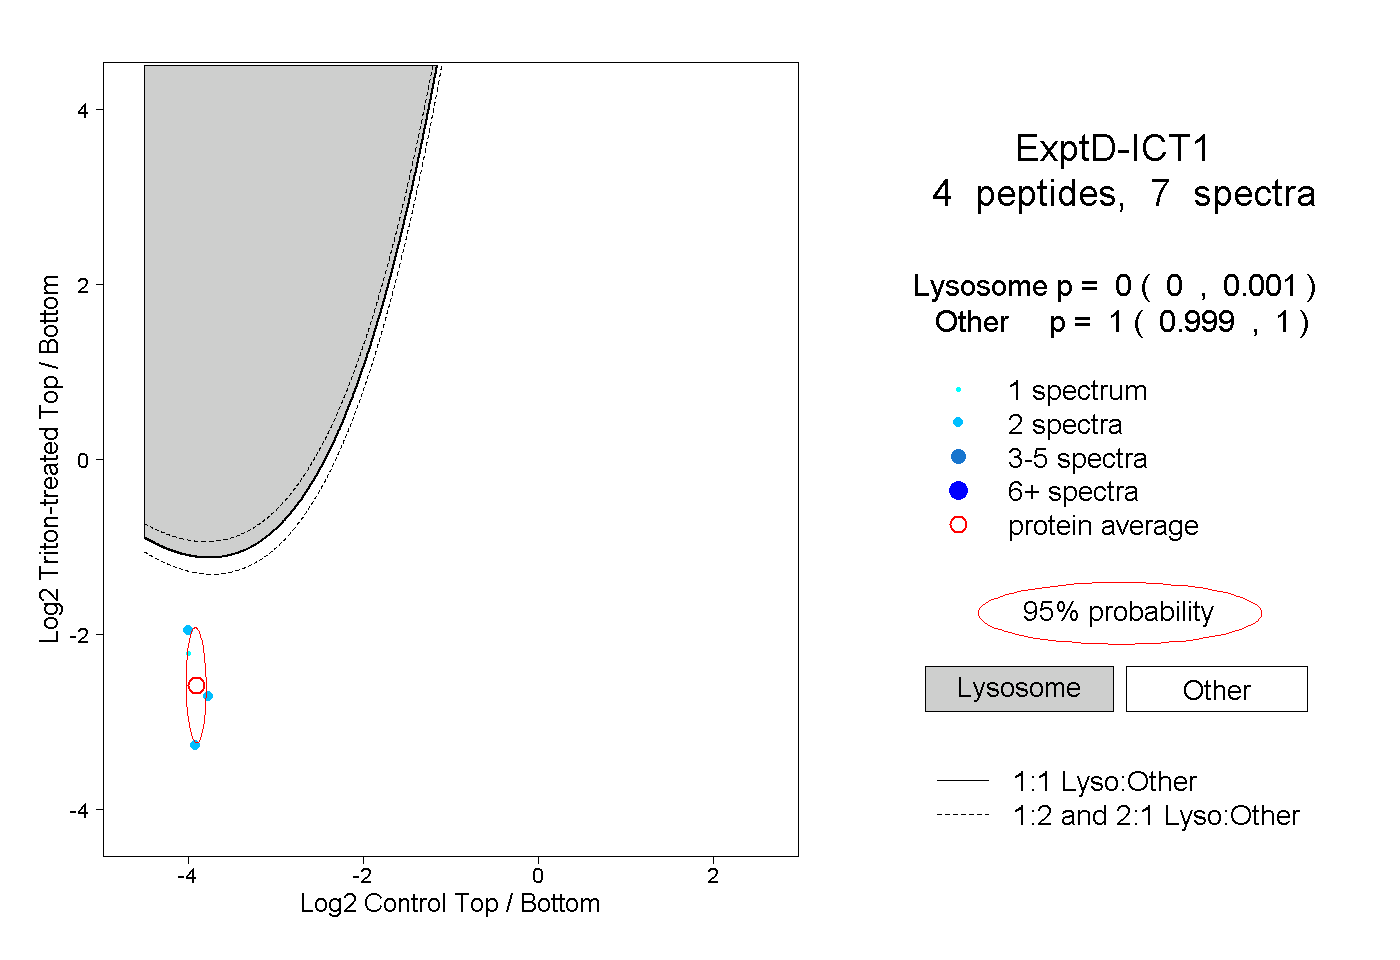 |
|
0.000
0.000 | 0.001 |
|
|
|
|
|
|
|
1.000
0.999 | 1.000 |