 11
11peptides
spectra
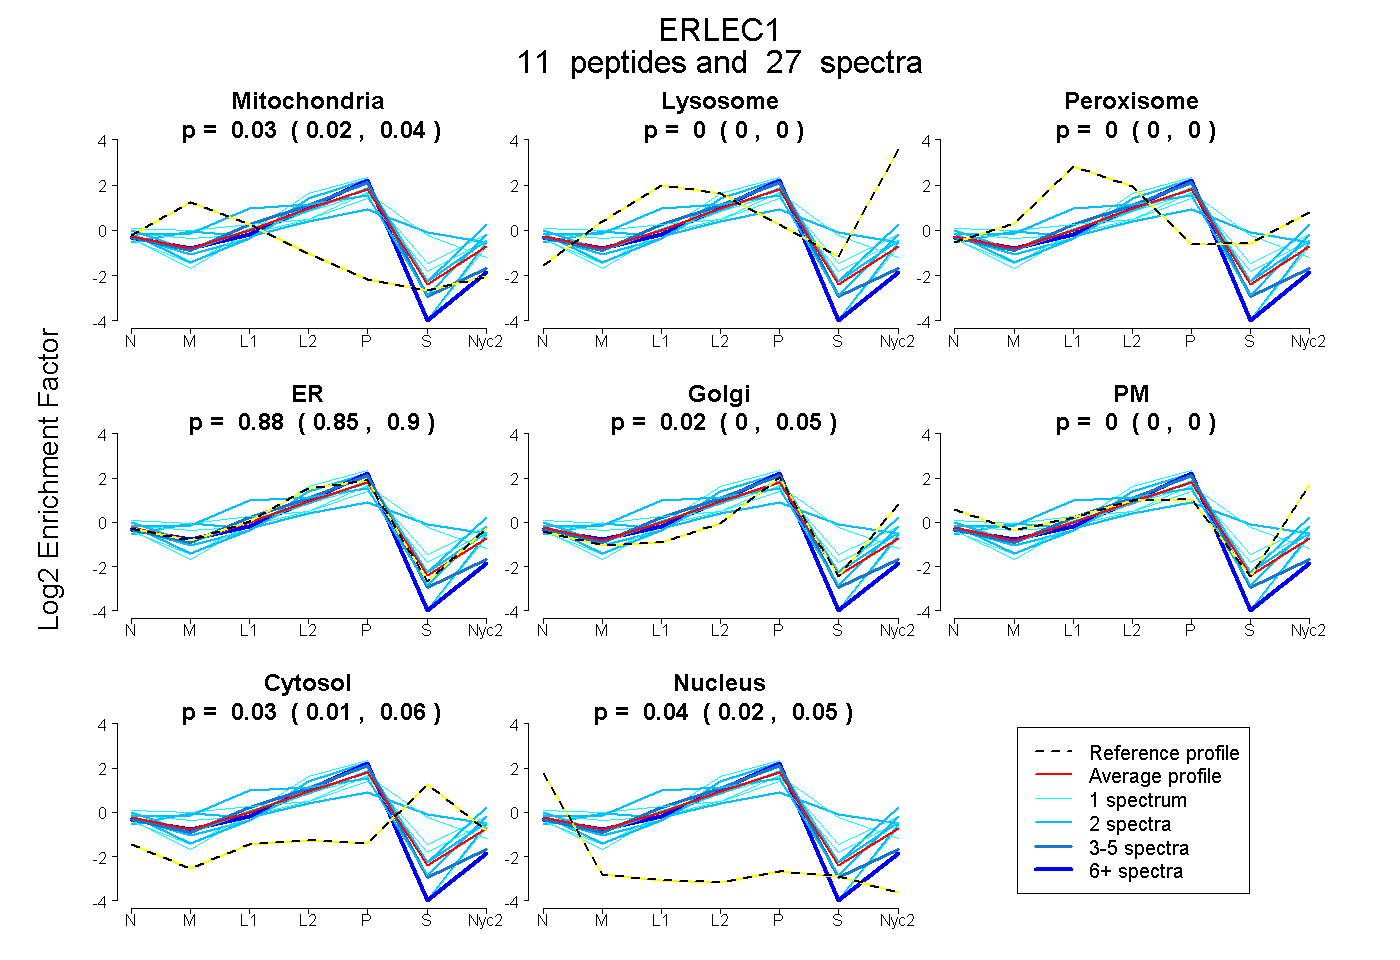
0.016 | 0.043
0.000 | 0.000
0.000 | 0.000
0.848 | 0.899
0.000 | 0.052
0.000 | 0.000
0.005 | 0.056
0.021 | 0.049
4peptides
spectra
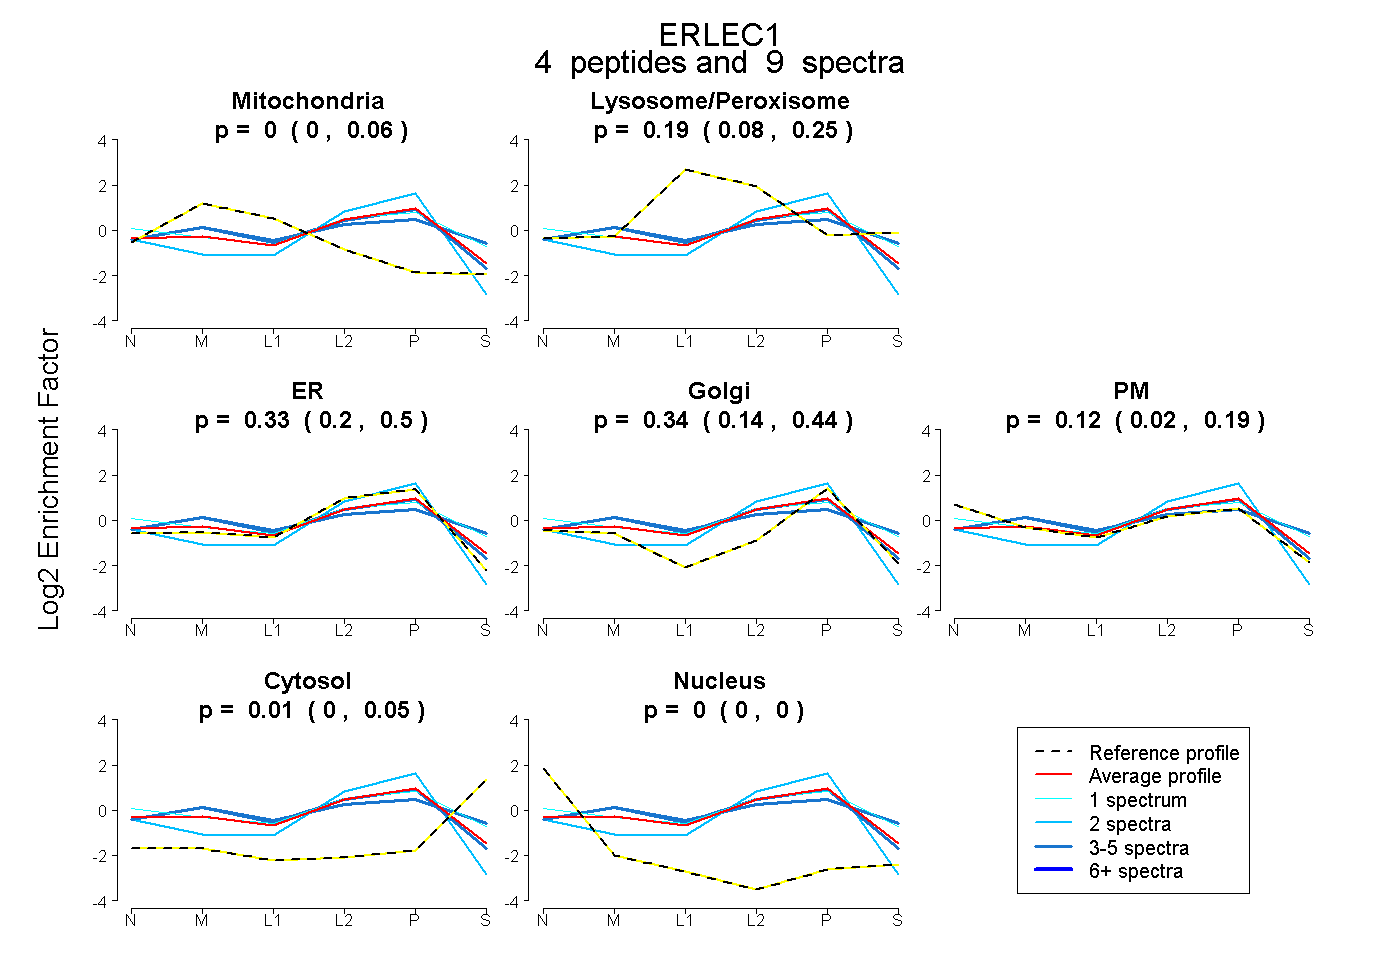
0.000 | 0.063
0.081 | 0.251
0.197 | 0.496
0.140 | 0.439
0.018 | 0.190
0.000 | 0.054
0.000 | 0.000
11peptides
spectra
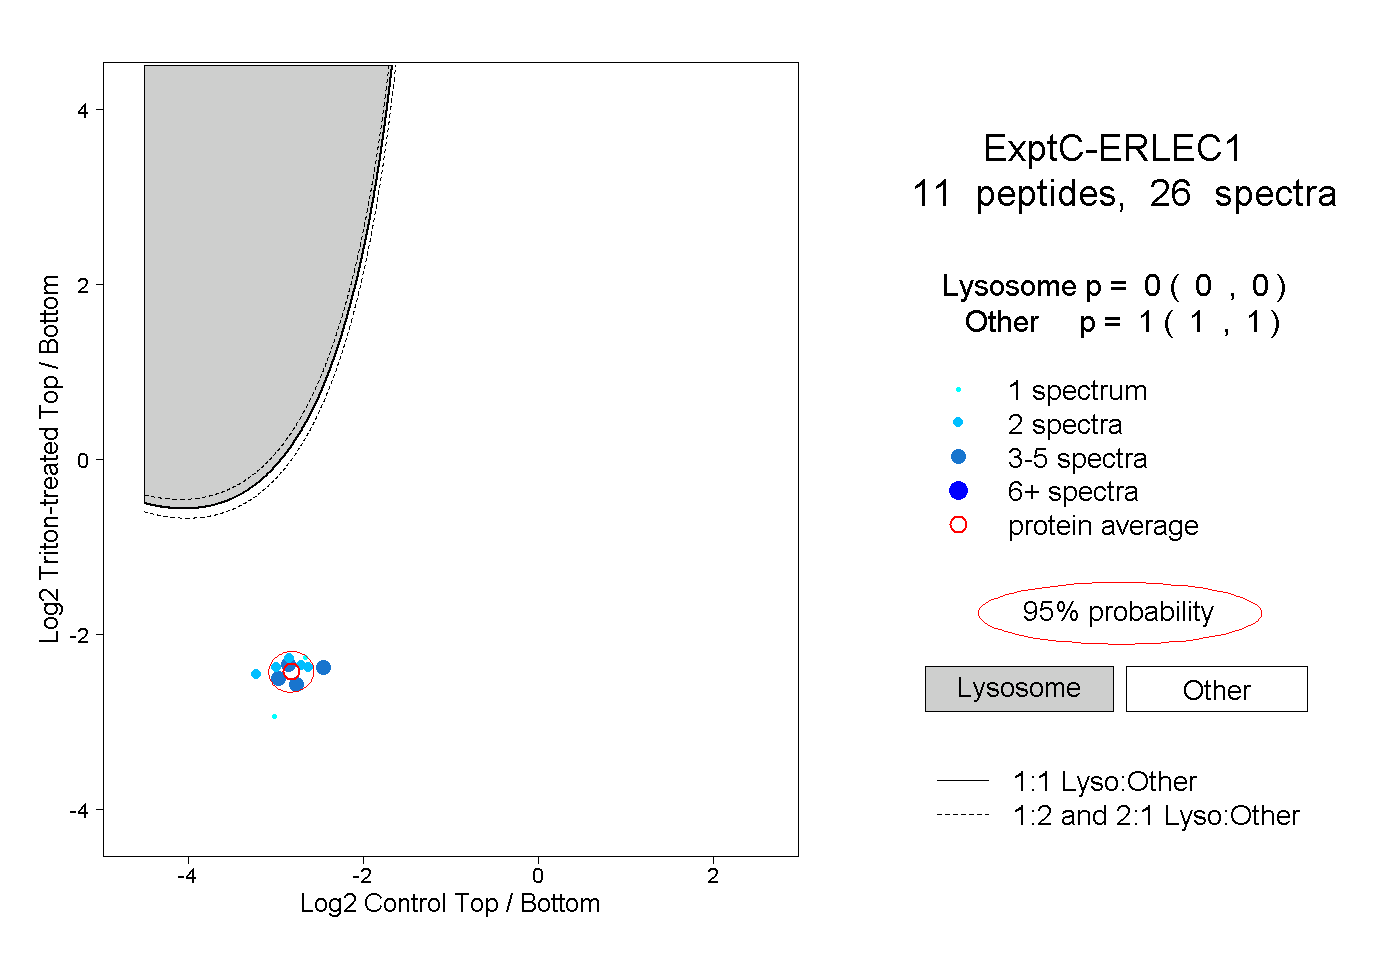
0.000 | 0.000
1.000 | 1.000
2peptides
spectra
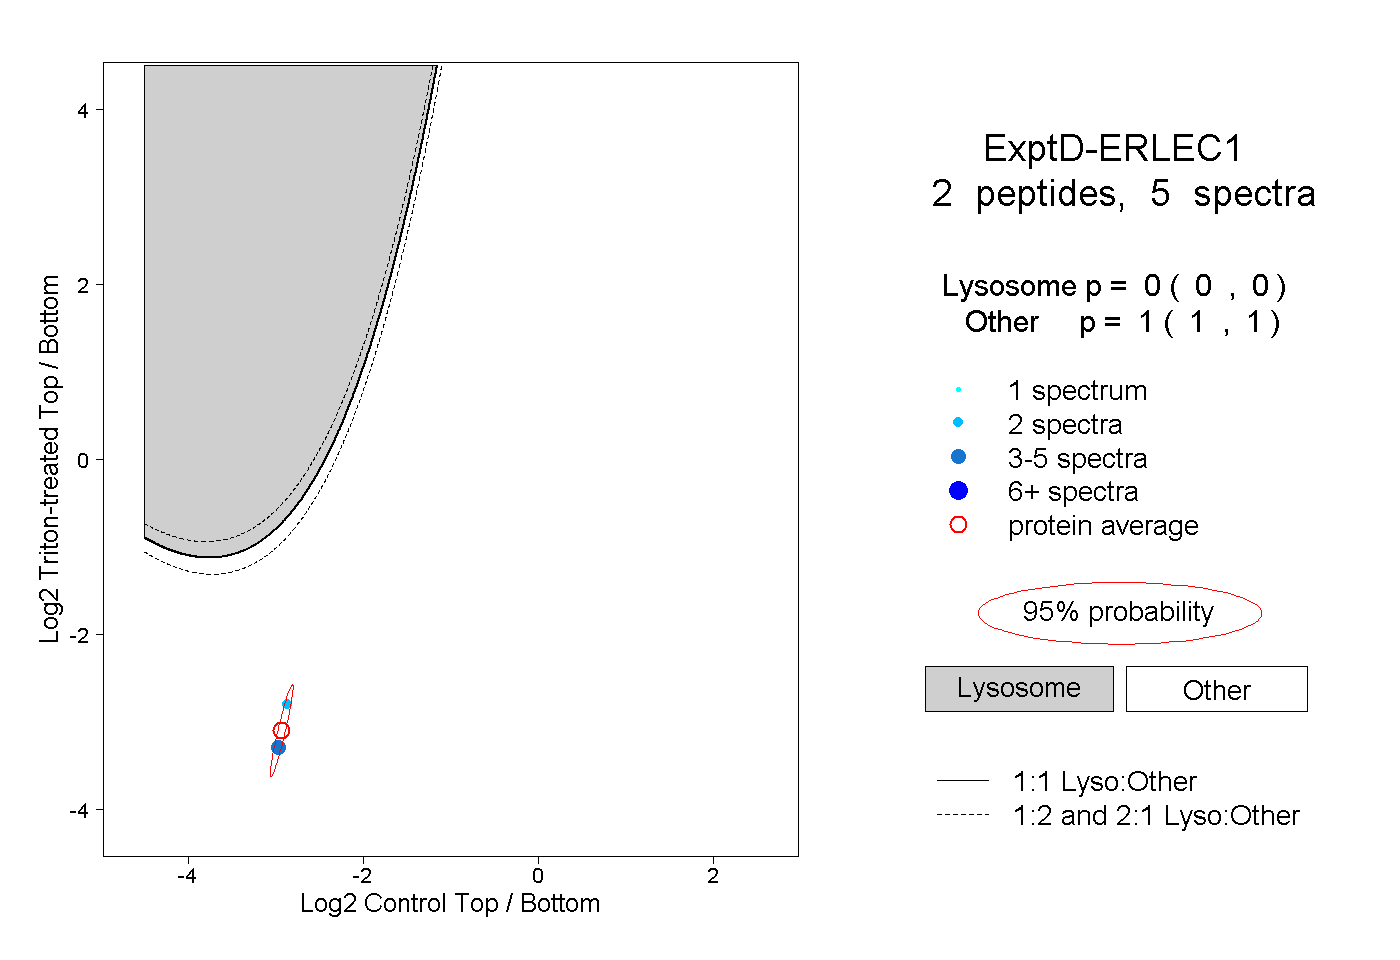
0.000 | 0.000
1.000 | 1.000